Analysis of Creep and Fatigue in Mechanical Engineering Systems
VerifiedAdded on 2020/04/15
|12
|1217
|346
Homework Assignment
AI Summary
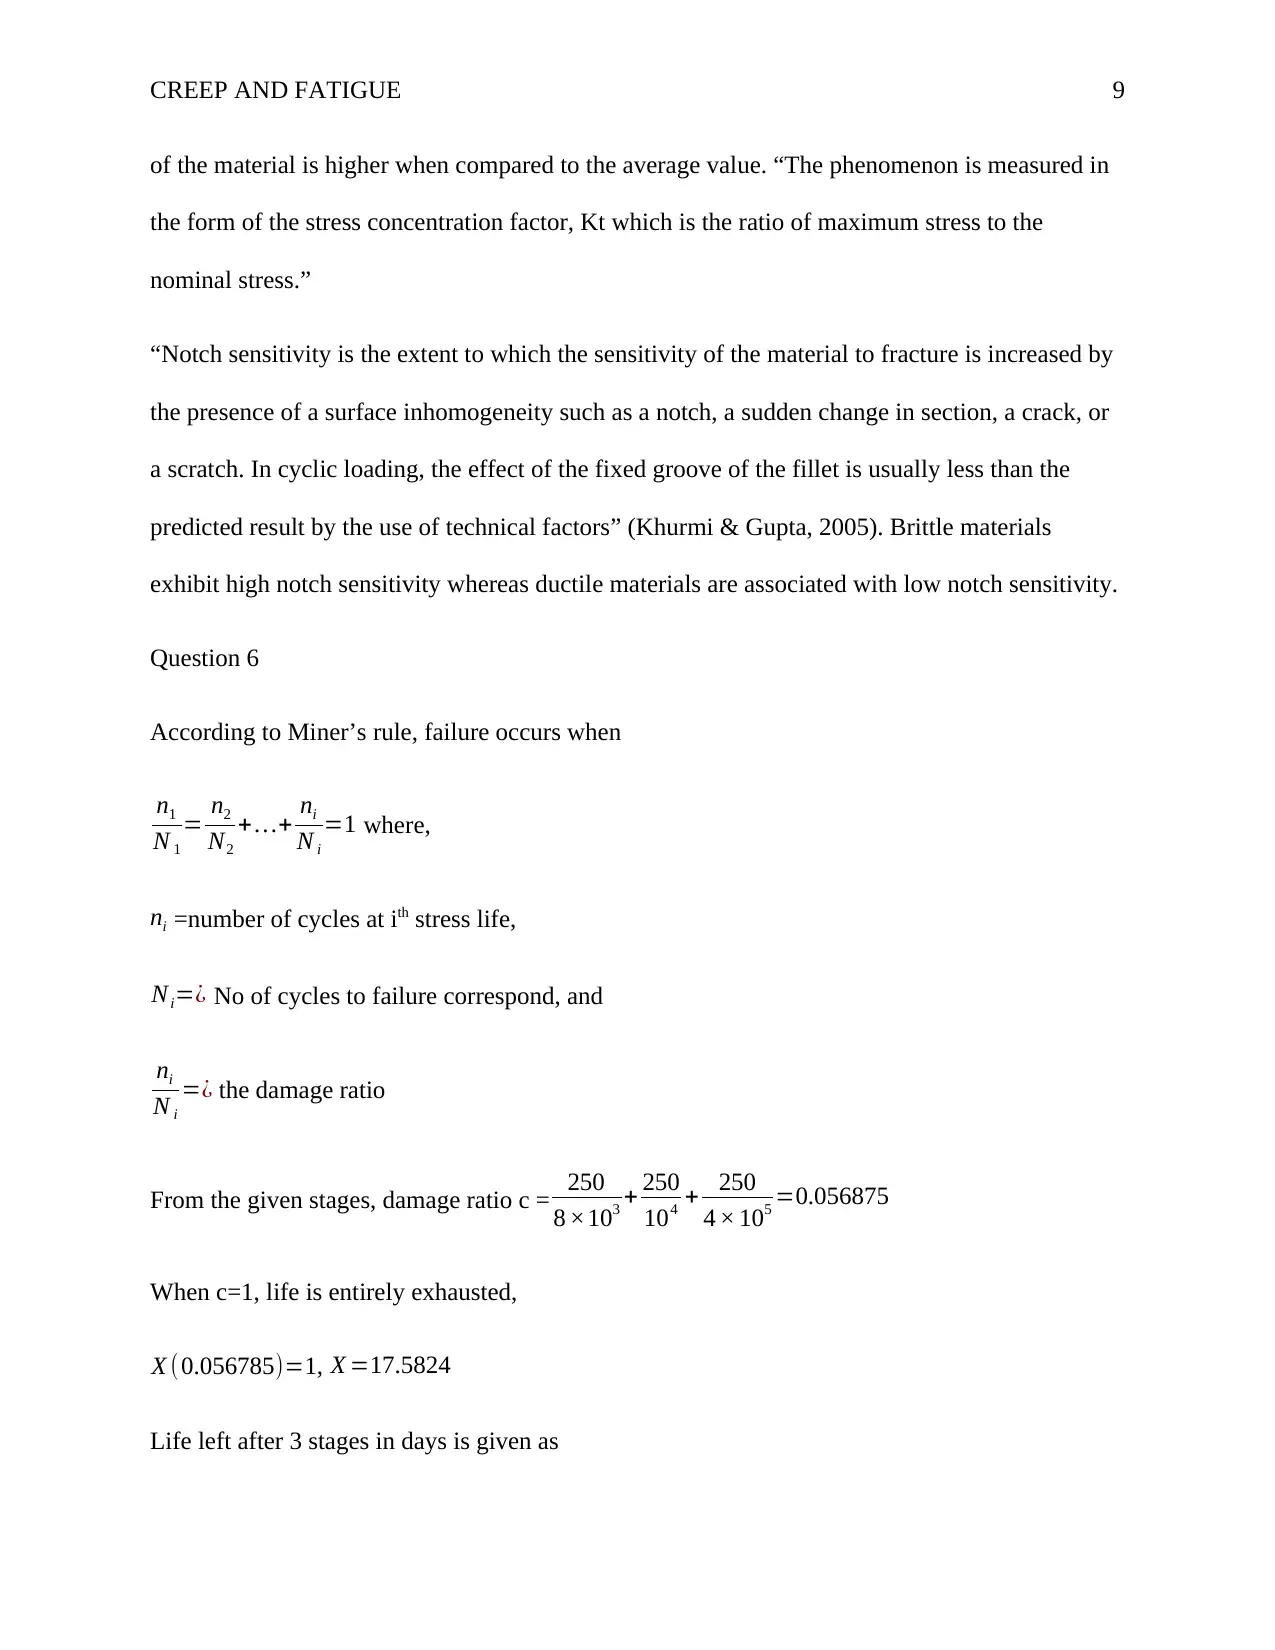
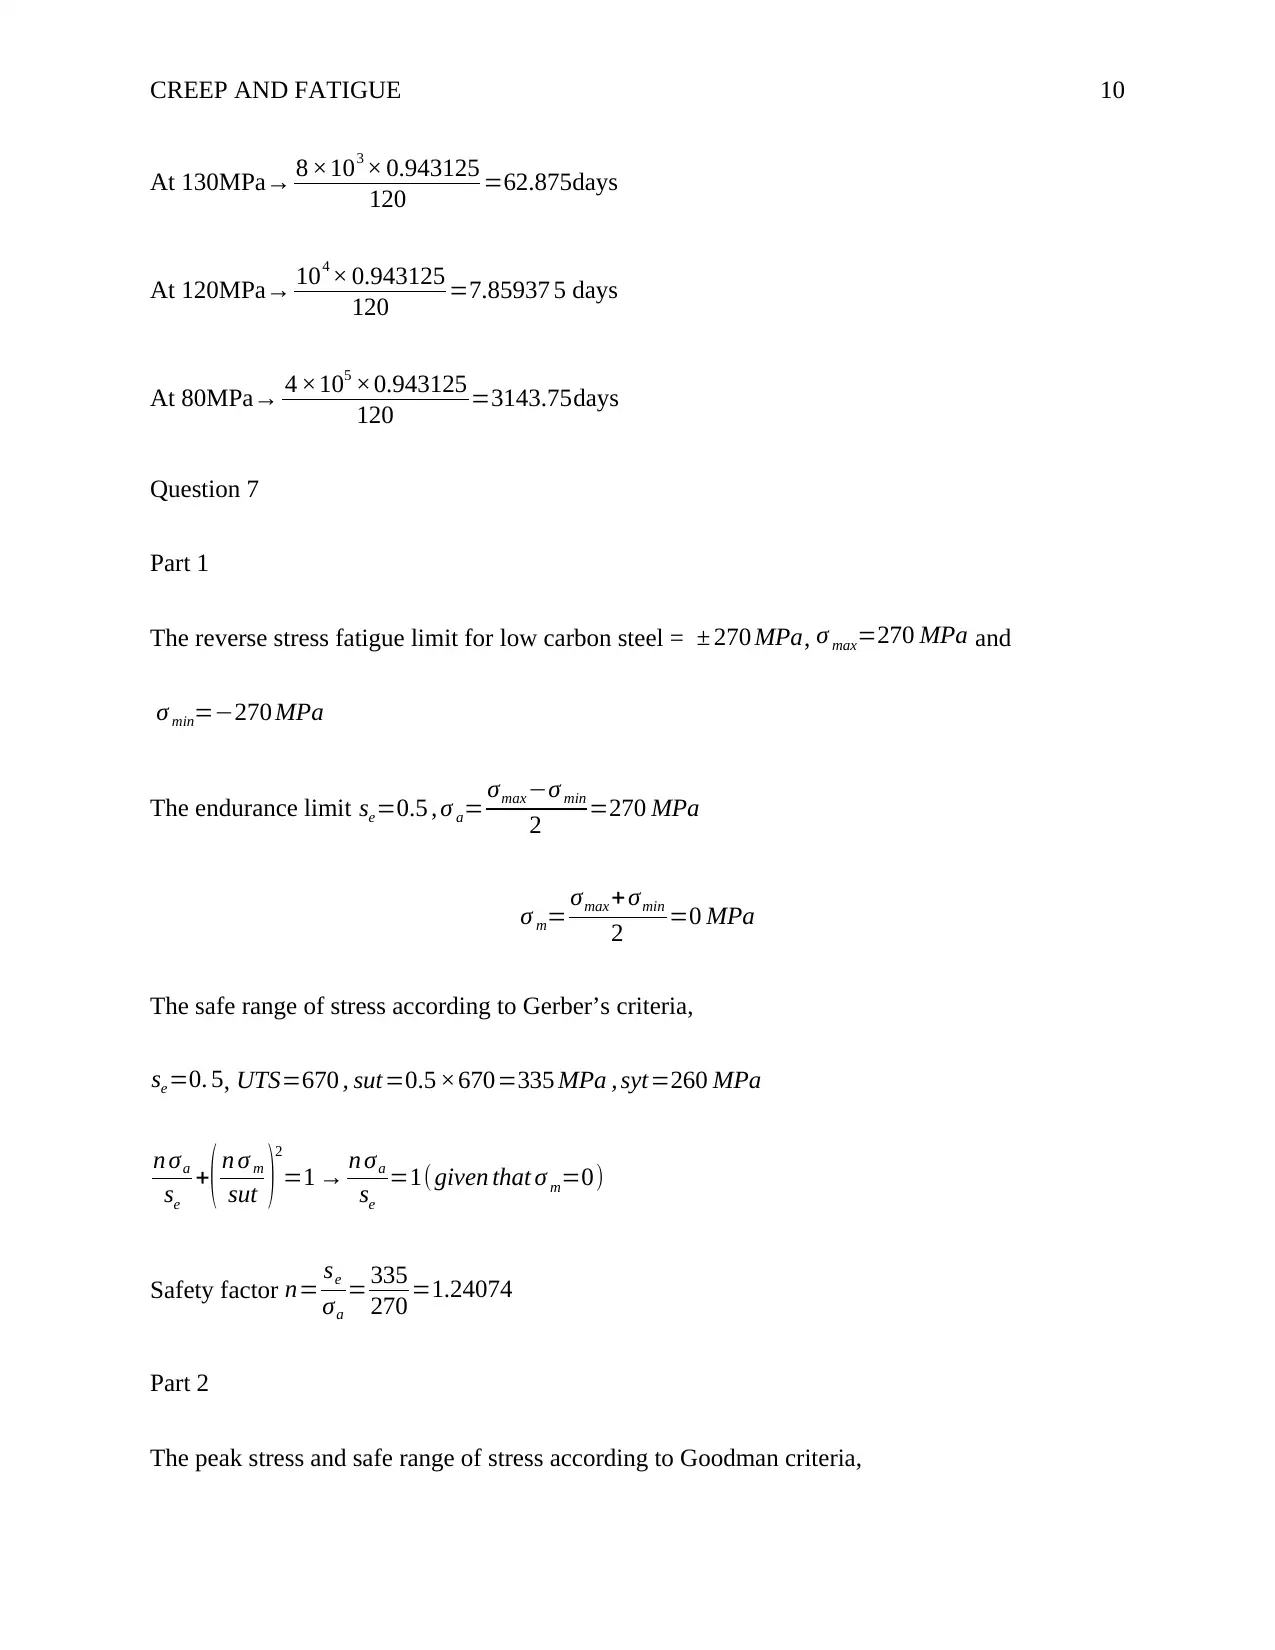
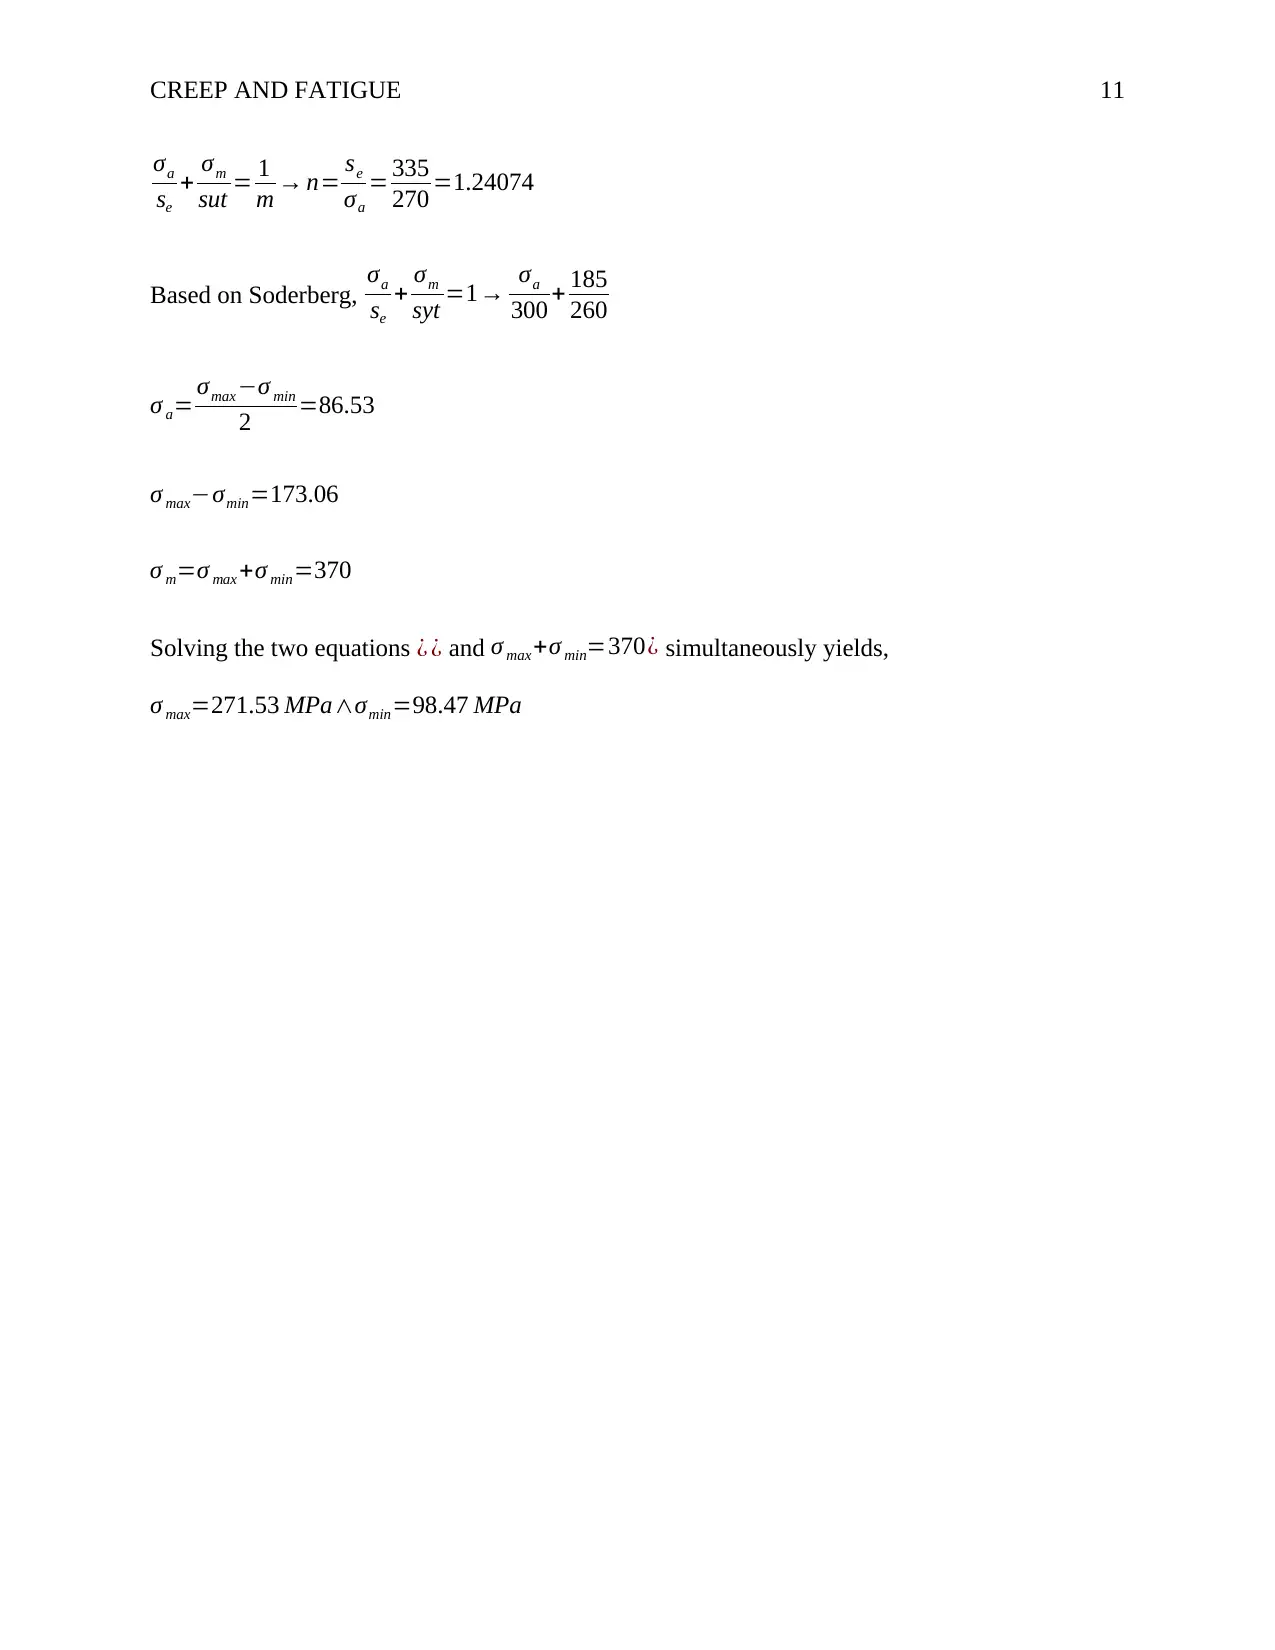
This assignment delves into the concepts of creep and fatigue in mechanical engineering. It begins with definitions of stress relaxation, creep rupture strength, and creep life, along with the factors influencing creep. The assignment then presents MATLAB code and plots to analyze creep behavior. It proceeds to address fatigue methods, including stress-life and strain-life approaches, and discusses the endurance limit and stress concentration. The assignment also applies Miner’s rule and evaluates safety factors using Gerber’s and Goodman’s criteria. The solution demonstrates calculations for various scenarios, providing a comprehensive understanding of creep and fatigue analysis in mechanical engineering applications. The assignment concludes with relevant references.

Running head: CREEP AND FATIGUE 1
Creep and Fatigue
Name
Institution
Creep and Fatigue
Name
Institution
Paraphrase This Document
Need a fresh take? Get an instant paraphrase of this document with our AI Paraphraser

CREEP AND FATIGUE 2
Creep and Fatigue
Question 1
Part 1
Stress relaxation refers to the decrease in stress under constant strain. In other words, the
reduction “time-dependent decrease in stress acting on a body that is constrained to a fixed
deformation.” A good example is in bolts which are designed to hold rigid bodies tightly. In such
bolts, the stress will reduce after an extended period.
Part 2
Creep rupture strength refers to “the highest stress that a material can withstand without rupture
for a specified length of time.” For example, in a turbine blade, the creep rupture strength is the
stress that produces a fracture in either 103 hours or 104 hours or105 hours for working at an
absolute temperature of 1073K.
Part 3
On the other hand, creep life refers to the time for a material to fracture for a given static load.
Part 4
The factors affecting creep include:
Load: the rate of creep is directly proportional to the load. That is, creep rate increases with the
increase in load and decreases with the decrease in load.
The temperature: the creep rate increases with the increase in temperature.

CREEP AND FATIGUE 3
Composition: Creep is more pronounced in pure metals as opposed to alloys. Notably, pure
metals are softer than alloys. The different phases present stops the dislocation glide.
Heat treatment changes the material structure which affects the material properties and
subsequently, the creep resistance.
Material grain size. The smaller the grain size, the stronger the material whereas the larger the
grain, the weaker the material. However, above Equicohesive temperature, the property of the
material will reverse.
Question 2
Using the MATLAB code attached in figure 1 and plotting the data points yields figure 2.
“Figure 1: The MATLAB Code”
“Figure 2: MATLAB Plot”
⊘ This is a preview!⊘
Do you want full access?
Subscribe today to unlock all pages.

Trusted by 1+ million students worldwide

CREEP AND FATIGUE 4
Question 3
“Figure 3: MATLAB Code”
“Figure 4: MATLAB Plot”
Question 3
“Figure 3: MATLAB Code”
“Figure 4: MATLAB Plot”
Paraphrase This Document
Need a fresh take? Get an instant paraphrase of this document with our AI Paraphraser

CREEP AND FATIGUE 5
˙ϵs 1= Dexp( −Q
R T 1
)
˙ϵs 2 =Dexp( −Q
R T 2
)
˙ϵs 1
˙ϵs 2
=
Dexp( −Q
R T1
)
Dexp( −Q
R T 2
)
=exp ( −Q
R T1
+ Q
R T 2
)
Q ( −1
R T1
+ 1
R T 2 )=ln ( ˙ϵs 1
˙ϵs 2
)
The activation energy Q=
ln ( ˙ϵs 1
˙ϵs 2 )
1 ( −1
R T 1
+ 1
R T 2 )
Putting the values from the table given T 1=290∧T 2=300
˙ϵs 1= Dexp( −Q
R T 1
)
˙ϵs 2 =Dexp( −Q
R T 2
)
˙ϵs 1
˙ϵs 2
=
Dexp( −Q
R T1
)
Dexp( −Q
R T 2
)
=exp ( −Q
R T1
+ Q
R T 2
)
Q ( −1
R T1
+ 1
R T 2 )=ln ( ˙ϵs 1
˙ϵs 2
)
The activation energy Q=
ln ( ˙ϵs 1
˙ϵs 2 )
1 ( −1
R T 1
+ 1
R T 2 )
Putting the values from the table given T 1=290∧T 2=300

CREEP AND FATIGUE 6
¿
ln ( 4.8 ×10⁻⁶
2.74 ×10⁻⁵ )
1
8.314 ( −1
290 + 1
300 ) = 125.997 kJ
mol∗K
“The constant for secondary Creep D”
˙ϵs 1= Dexp( −Q
R T 1
)
D= ˙ϵ s 1
exp ( −Q
R T 1
)
= 4.8 × 10⁻⁶
exp (−125.997 × 10³
8.314 ×290 )
= 4.8 ×10⁻⁶
exp (−52.2578) =2.37969 ×10⁻¹⁷
Putting the values from the table given T 1=290∧T 2=300
Question 4
Part a
Vessel Pressure (P)=1.5MPa
Diameter of cover plate=450mm, radius r=225mm
Number of bolts=30
Diameter of bolt (d)=20mm
Elasticity E =210 ×103
Area , A= π
4 D2= π
4 × 4502=159043.12 mm2
Secondary creep rate=32.2 ×10⁻¹⁷
⊘ This is a preview!⊘
Do you want full access?
Subscribe today to unlock all pages.

Trusted by 1+ million students worldwide

CREEP AND FATIGUE 7
The initial tightening stress in the bolt is given by σ = P D2
nd = 1.5× 450 × 450
30 ×20 =506.25 MPa
Part b
Time for tightening σ = Pr
t = 1.5 ×225
t
506.25= 1.5 ×225
t
Therefore t= 1.5× 225
506.25 =0.67
Question 5
Part 1
The three primary fatigue methods include:
The stress-life approach is applicable where stresses are elastic and on condition that plastic
strain occurs only at the tips of fatigue cracks. Stress life method is simple to compute since it
incorporates a single component. However, the method is less efficient at low cycles.
The strain-life method, on the other hand, can be applied in low cycle fatigue. Unlike the stress-
life, this technique is a combination of elastic and plastic stresses. Notably, the method is
complicated since both elastic and plastic components are included.
“The Linear Elastic Fracture Mechanics method (LEFM).” The LEFM is used when “the
material is isotropic and linear elastic.” Then, from “the stress field close to the crack tip
calculated using the law of elasticity.” The method is preferred since it can be applied in all the
Paraphrase This Document
Need a fresh take? Get an instant paraphrase of this document with our AI Paraphraser

CREEP AND FATIGUE 8
three modes of loadings. However, “LEFM is only valid when the inelastic deformation is
smaller relative to the size of the crack” (Khurmi & Gupta, 2005)
Part 2
Endurance limit refers to “the maximum value of the wholly reversed bending stress which a
polished standard specimen can withstand without failure.” The endurance limit modifying
factors include:
First, the load factor. Loading onto a member can be rotating bending, reversed axial or reversed
torsional. Each type of loading possesses different load correction factor and, consequently,
different endurance.
After that, the endurance limit also depends on the surface finish. Each surface has a different
finish factor. The endurance limit can be obtained as the product of the surface finish factor and
endurance limit factor.
The size of the specimen also determines the endurance limit. If the size of the sample is
increased, then the endurance limit decreases because a larger specimen is more likely to have
more defects as opposed to a small one.
Part 3
Stress concentration refers to “the irregularity in stress distribution that is caused by abrupt
changes in the form. It occurs in all kinds of stresses. For instance, in fillets, notches, scratches,
and holes” (Materion Performance Alloys, 2014). If we consider a member that has different
cross-sections under the influence of a tensile load, the nominal stress will be noticed to change
at the point where the cross-section varies. Additionally, the stress concentration along the edges

CREEP AND FATIGUE 9
of the material is higher when compared to the average value. “The phenomenon is measured in
the form of the stress concentration factor, Kt which is the ratio of maximum stress to the
nominal stress.”
“Notch sensitivity is the extent to which the sensitivity of the material to fracture is increased by
the presence of a surface inhomogeneity such as a notch, a sudden change in section, a crack, or
a scratch. In cyclic loading, the effect of the fixed groove of the fillet is usually less than the
predicted result by the use of technical factors” (Khurmi & Gupta, 2005). Brittle materials
exhibit high notch sensitivity whereas ductile materials are associated with low notch sensitivity.
Question 6
According to Miner’s rule, failure occurs when
n1
N 1
= n2
N2
+ …+ ni
N i
=1 where,
ni =number of cycles at ith stress life,
Ni=¿ No of cycles to failure correspond, and
ni
N i
=¿ the damage ratio
From the given stages, damage ratio c = 250
8 ×10³ + 250
104 + 250
4 × 105 =0.056875
When c=1, life is entirely exhausted,
X (0.056785)=1, X =17.5824
Life left after 3 stages in days is given as
⊘ This is a preview!⊘
Do you want full access?
Subscribe today to unlock all pages.

Trusted by 1+ million students worldwide

CREEP AND FATIGUE 10
At 130MPa→ 8 ×103 × 0.943125
120 =62.875days
At 120MPa→ 104 × 0.943125
120 =7.85937 5 days
At 80MPa→ 4 ×105 ×0.943125
120 =3143.75days
Question 7
Part 1
The reverse stress fatigue limit for low carbon steel = ± 270 MPa, σ max=270 MPa and
σ min=−270 MPa
The endurance limit se=0.5 , σ a= σmax−σ min
2 =270 MPa
σ m= σmax +σmin
2 =0 MPa
The safe range of stress according to Gerber’s criteria,
se=0. 5, UTS=670 , sut=0.5 ×670=335 MPa , syt=260 MPa
n σa
se
+( n σ m
sut )
2
=1 → n σa
se
=1( given that σ m=0)
Safety factor n= se
σa
= 335
270 =1.24074
Part 2
The peak stress and safe range of stress according to Goodman criteria,
Paraphrase This Document
Need a fresh take? Get an instant paraphrase of this document with our AI Paraphraser

CREEP AND FATIGUE 11
σa
se
+ σm
sut = 1
m → n= se
σa
= 335
270 =1.24074
Based on Soderberg, σa
se
+ σm
syt =1→ σa
300 + 185
260
σ a= σmax−σ min
2 =86.53
σ max−σmin=173.06
σ m=σ max +σ min=370
Solving the two equations ¿ ¿ and σ max +σ min=370¿ simultaneously yields,
σ max=271.53 MPa∧σmin=98.47 MPa
σa
se
+ σm
sut = 1
m → n= se
σa
= 335
270 =1.24074
Based on Soderberg, σa
se
+ σm
syt =1→ σa
300 + 185
260
σ a= σmax−σ min
2 =86.53
σ max−σmin=173.06
σ m=σ max +σ min=370
Solving the two equations ¿ ¿ and σ max +σ min=370¿ simultaneously yields,
σ max=271.53 MPa∧σmin=98.47 MPa

CREEP AND FATIGUE 12
References
Materion Performance Alloys. (2014). Practice for Statistical Analysis of Linear or Linearized
Stress-Life (S-N) and Strain-Life (-N) Fatigue Data. Stress Life vs. Strain Life, (67), 6-
10. doi:10.1520/e0739-91r04e01
Khurmi, R. S., & Gupta, J. K. (2005). A textbook of machine design. New Delhi: Eurasia
Publishing House.
⊘ This is a preview!⊘
Do you want full access?
Subscribe today to unlock all pages.

Trusted by 1+ million students worldwide
1 out of 12
Related Documents
Your All-in-One AI-Powered Toolkit for Academic Success.
+13062052269
info@desklib.com
Available 24*7 on WhatsApp / Email
Unlock your academic potential
Copyright © 2020–2025 A2Z Services. All Rights Reserved. Developed and managed by ZUCOL.


