Chicago Crime: Big Data Analytics Report on Crime Incidents 2012-2016
VerifiedAdded on 2023/06/06
|11
|2583
|352
Report
AI Summary
This report analyzes Chicago crime data from 2012 to 2016 using big data analytics techniques with IBM Watson. It identifies crime trends, high-crime locations, and peak crime times. The analysis reveals that streets and residences are the most vulnerable locations, with theft being the most common crime. The report also highlights districts with high crime rates and months with increased criminal activity. Recommendations are provided to the police chief, emphasizing increased vigilance in high-crime areas, stricter law enforcement, and targeted patrolling strategies. Domestic violence crime shows a decreasing trend. The report uses dashboard analysis for visual representation of data.
Running Head: BIG DATA AND ANALYTICS
Big Data and Analytics
Name of the student:
Name of the university:
Course ID:
Big Data and Analytics
Name of the student:
Name of the university:
Course ID:
Paraphrase This Document
Need a fresh take? Get an instant paraphrase of this document with our AI Paraphraser
1BIG DATA AND ANALYTICS
Table of Contents
1. Introduction:................................................................................................................................2
1.1. Background:..........................................................................................................................2
1.2. Target Audience:...................................................................................................................2
1.3. Research objective:...............................................................................................................2
1.4. Data Source:..........................................................................................................................2
1.5. Data Description:..................................................................................................................3
2. Reporting by Dashboards:...........................................................................................................4
2.1. Dashboard 1:.........................................................................................................................4
2.2. Dashboard 2:.........................................................................................................................4
2.3. Dashboard 3:.........................................................................................................................5
2.4. Dashboard 4:.........................................................................................................................6
2.5. Dashboard 5:.........................................................................................................................6
3. Advanced Insights:......................................................................................................................7
4. Research:......................................................................................................................................7
5. Recommendations for Police Chief:............................................................................................8
6. Cover Letter:................................................................................................................................9
7. Research Reflection:....................................................................................................................9
References:....................................................................................................................................10
2BIG DATA AND ANALYTICS
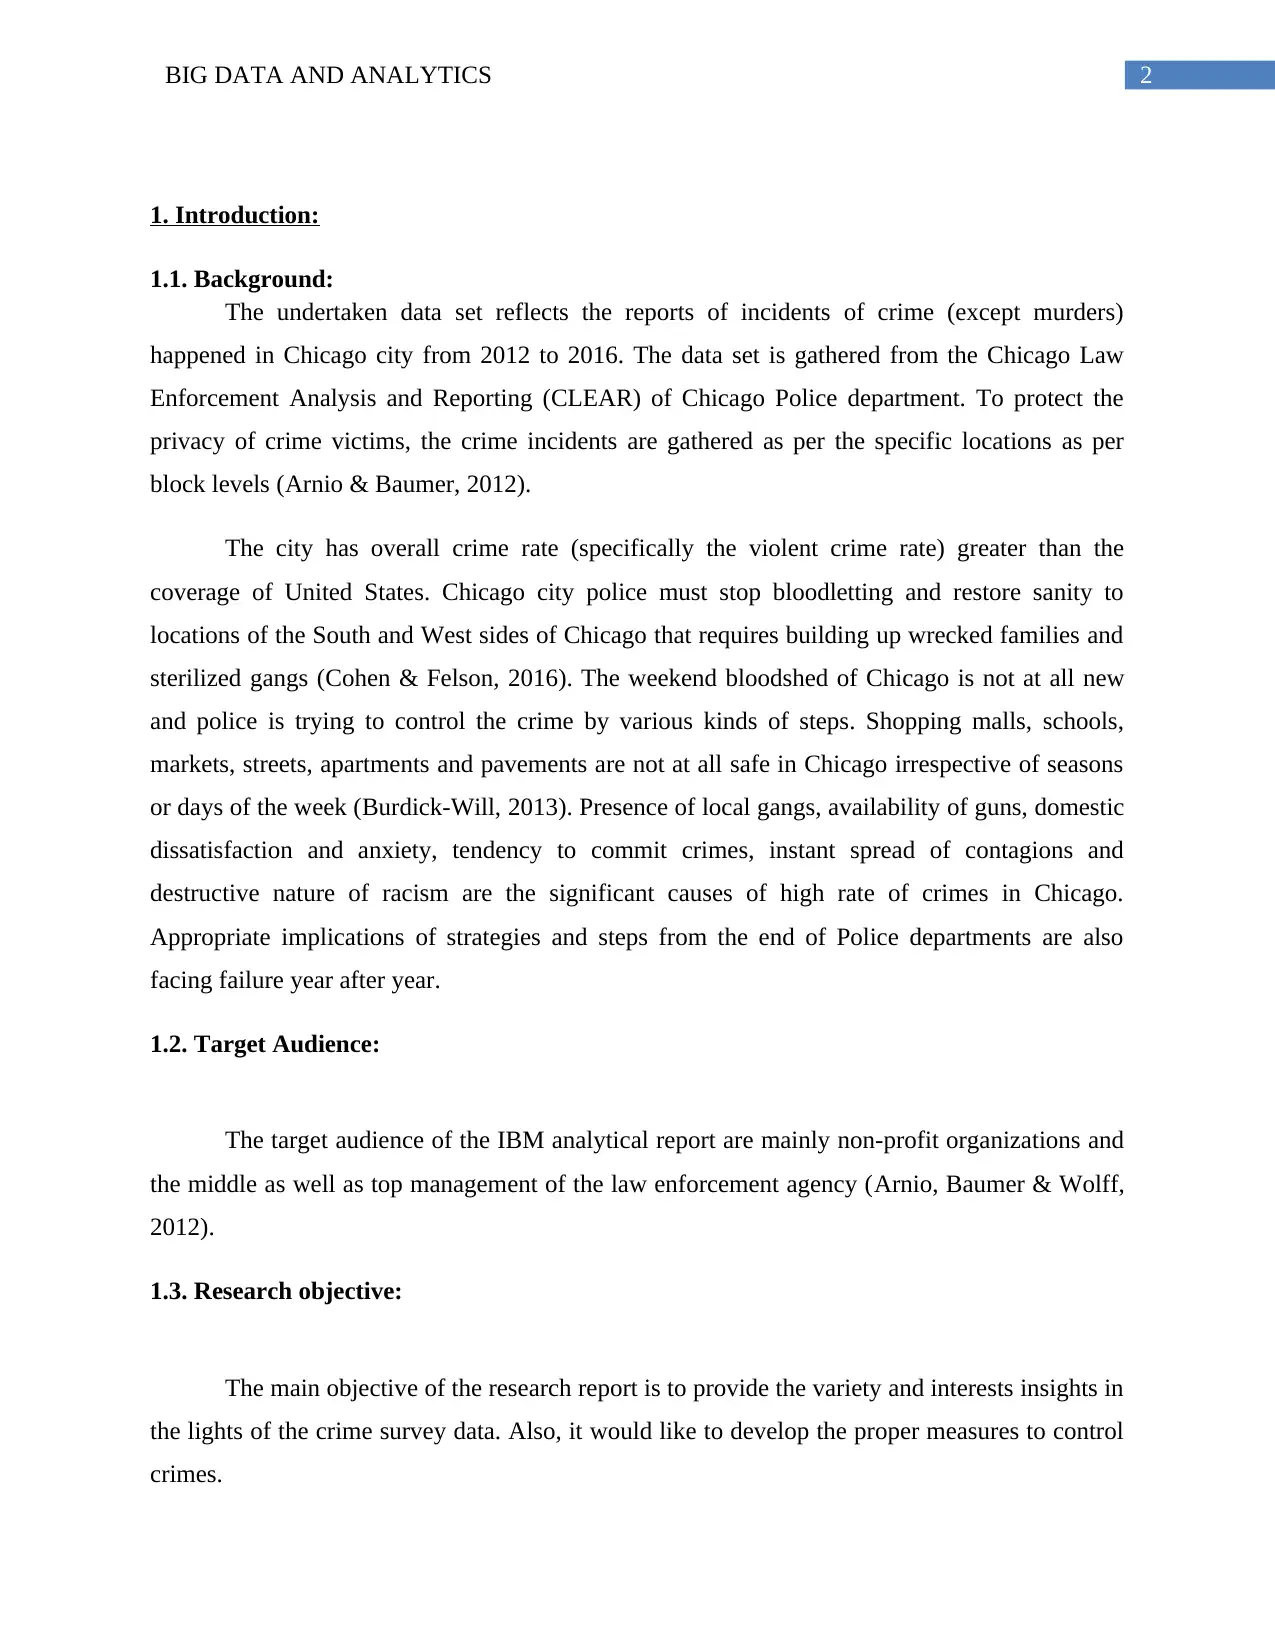
1. Introduction:
1.1. Background:
The undertaken data set reflects the reports of incidents of crime (except murders)
happened in Chicago city from 2012 to 2016. The data set is gathered from the Chicago Law
Enforcement Analysis and Reporting (CLEAR) of Chicago Police department. To protect the
privacy of crime victims, the crime incidents are gathered as per the specific locations as per
block levels (Arnio & Baumer, 2012).
The city has overall crime rate (specifically the violent crime rate) greater than the
coverage of United States. Chicago city police must stop bloodletting and restore sanity to
locations of the South and West sides of Chicago that requires building up wrecked families and
sterilized gangs (Cohen & Felson, 2016). The weekend bloodshed of Chicago is not at all new
and police is trying to control the crime by various kinds of steps. Shopping malls, schools,
markets, streets, apartments and pavements are not at all safe in Chicago irrespective of seasons
or days of the week (Burdick-Will, 2013). Presence of local gangs, availability of guns, domestic
dissatisfaction and anxiety, tendency to commit crimes, instant spread of contagions and
destructive nature of racism are the significant causes of high rate of crimes in Chicago.
Appropriate implications of strategies and steps from the end of Police departments are also
facing failure year after year.
1.2. Target Audience:
The target audience of the IBM analytical report are mainly non-profit organizations and
the middle as well as top management of the law enforcement agency (Arnio, Baumer & Wolff,
2012).
1.3. Research objective:
The main objective of the research report is to provide the variety and interests insights in
the lights of the crime survey data. Also, it would like to develop the proper measures to control
crimes.
⊘ This is a preview!⊘
Do you want full access?
Subscribe today to unlock all pages.
Trusted by 1+ million students worldwide
3BIG DATA AND ANALYTICS
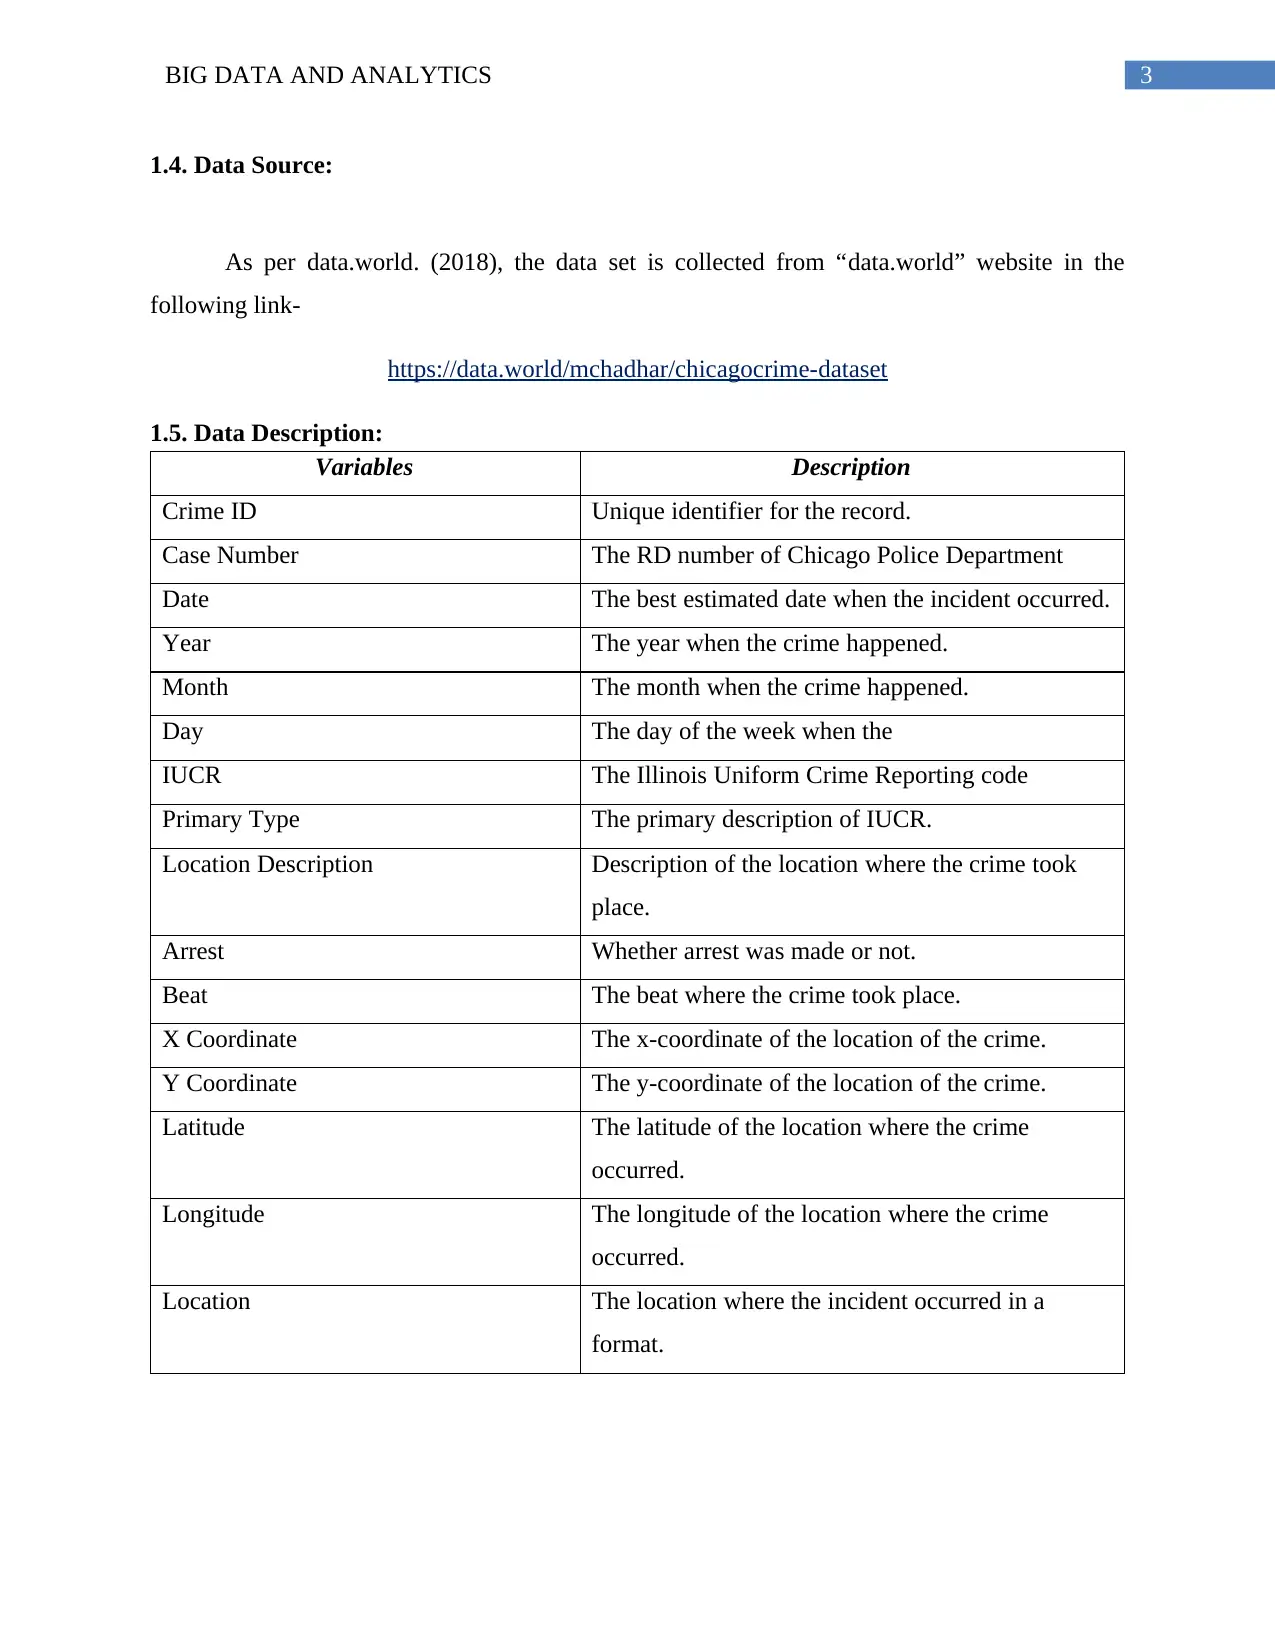
1.4. Data Source:
As per data.world. (2018), the data set is collected from “data.world” website in the
following link-
https://data.world/mchadhar/chicagocrime-dataset
1.5. Data Description:
Variables Description
Crime ID Unique identifier for the record.
Case Number The RD number of Chicago Police Department
Date The best estimated date when the incident occurred.
Year The year when the crime happened.
Month The month when the crime happened.
Day The day of the week when the
IUCR The Illinois Uniform Crime Reporting code
Primary Type The primary description of IUCR.
Location Description Description of the location where the crime took
place.
Arrest Whether arrest was made or not.
Beat The beat where the crime took place.
X Coordinate The x-coordinate of the location of the crime.
Y Coordinate The y-coordinate of the location of the crime.
Latitude The latitude of the location where the crime
occurred.
Longitude The longitude of the location where the crime
occurred.
Location The location where the incident occurred in a
format.
Paraphrase This Document
Need a fresh take? Get an instant paraphrase of this document with our AI Paraphraser
4BIG DATA AND ANALYTICS
2. Reporting by Dashboards:
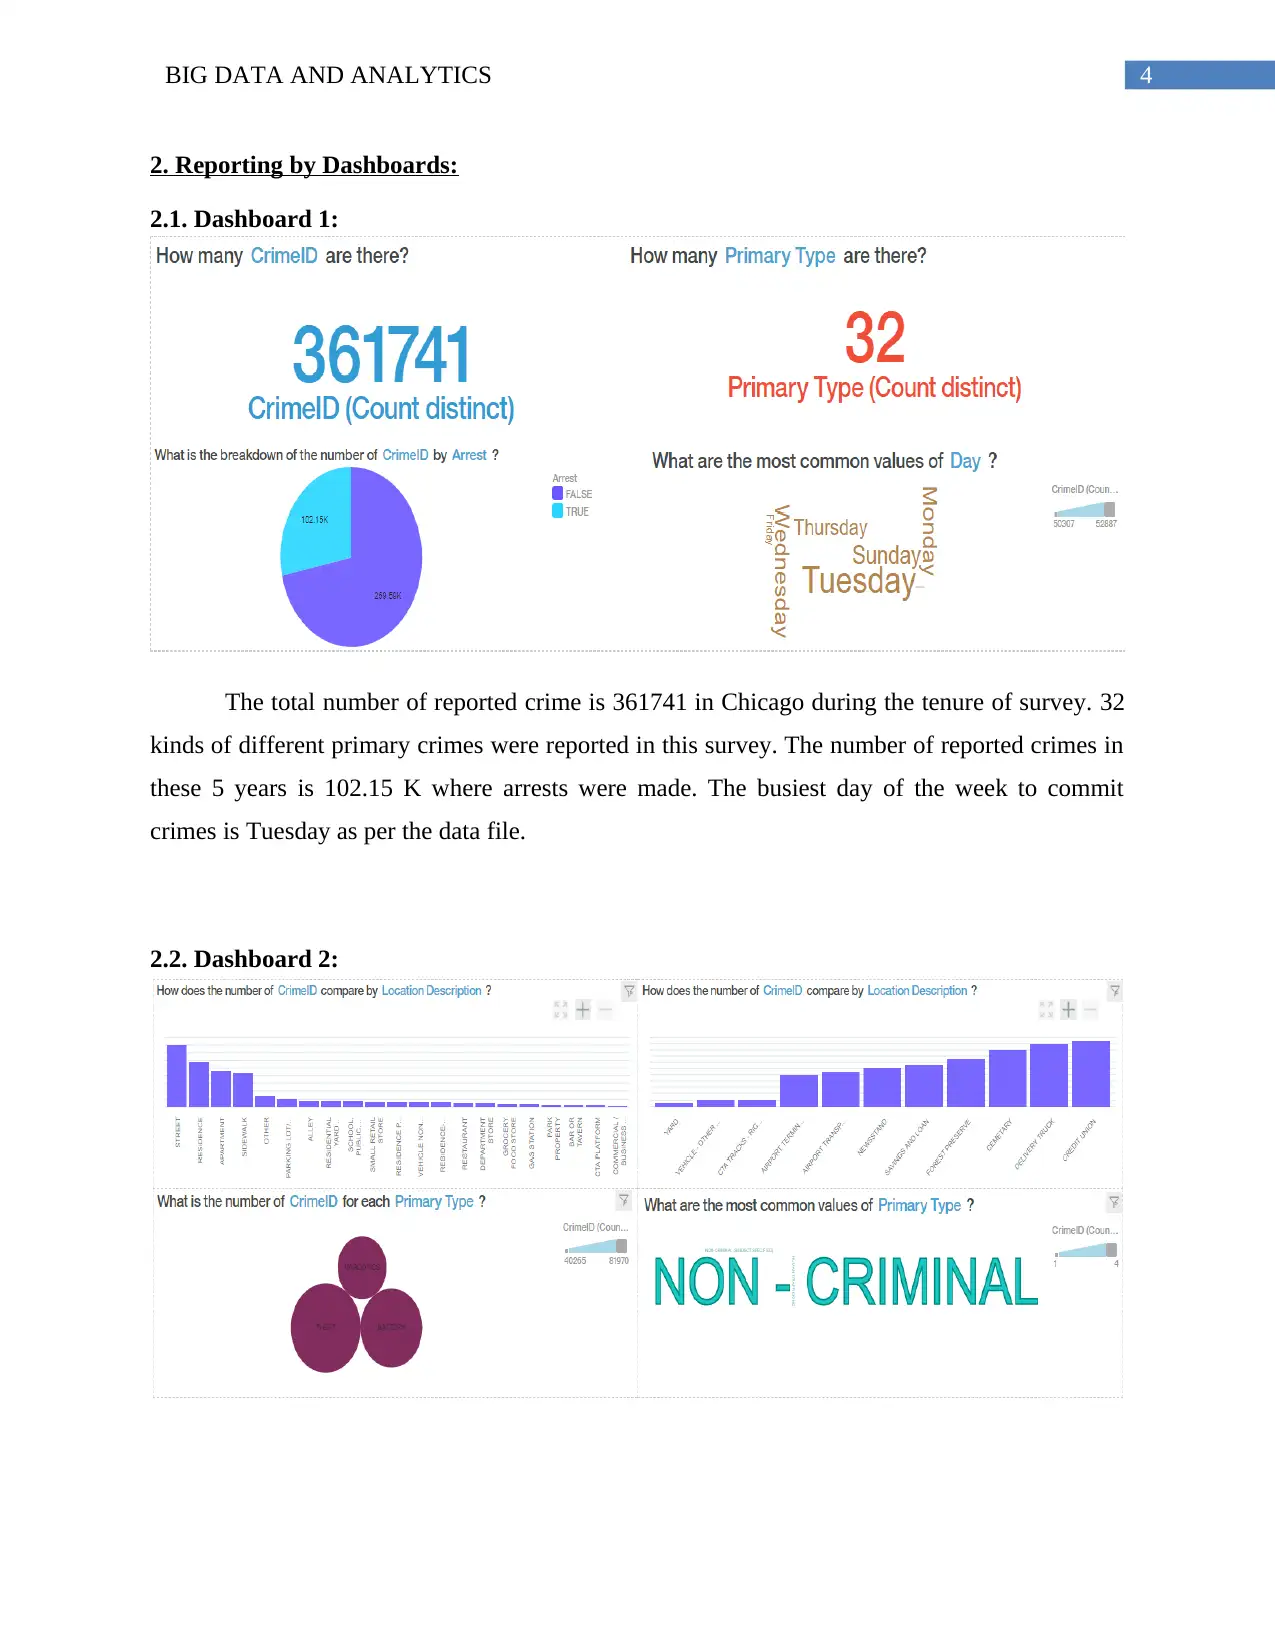
2.1. Dashboard 1:
The total number of reported crime is 361741 in Chicago during the tenure of survey. 32
kinds of different primary crimes were reported in this survey. The number of reported crimes in
these 5 years is 102.15 K where arrests were made. The busiest day of the week to commit
crimes is Tuesday as per the data file.
2.2. Dashboard 2:
2. Reporting by Dashboards:
2.1. Dashboard 1:
The total number of reported crime is 361741 in Chicago during the tenure of survey. 32
kinds of different primary crimes were reported in this survey. The number of reported crimes in
these 5 years is 102.15 K where arrests were made. The busiest day of the week to commit
crimes is Tuesday as per the data file.
2.2. Dashboard 2:
5BIG DATA AND ANALYTICS
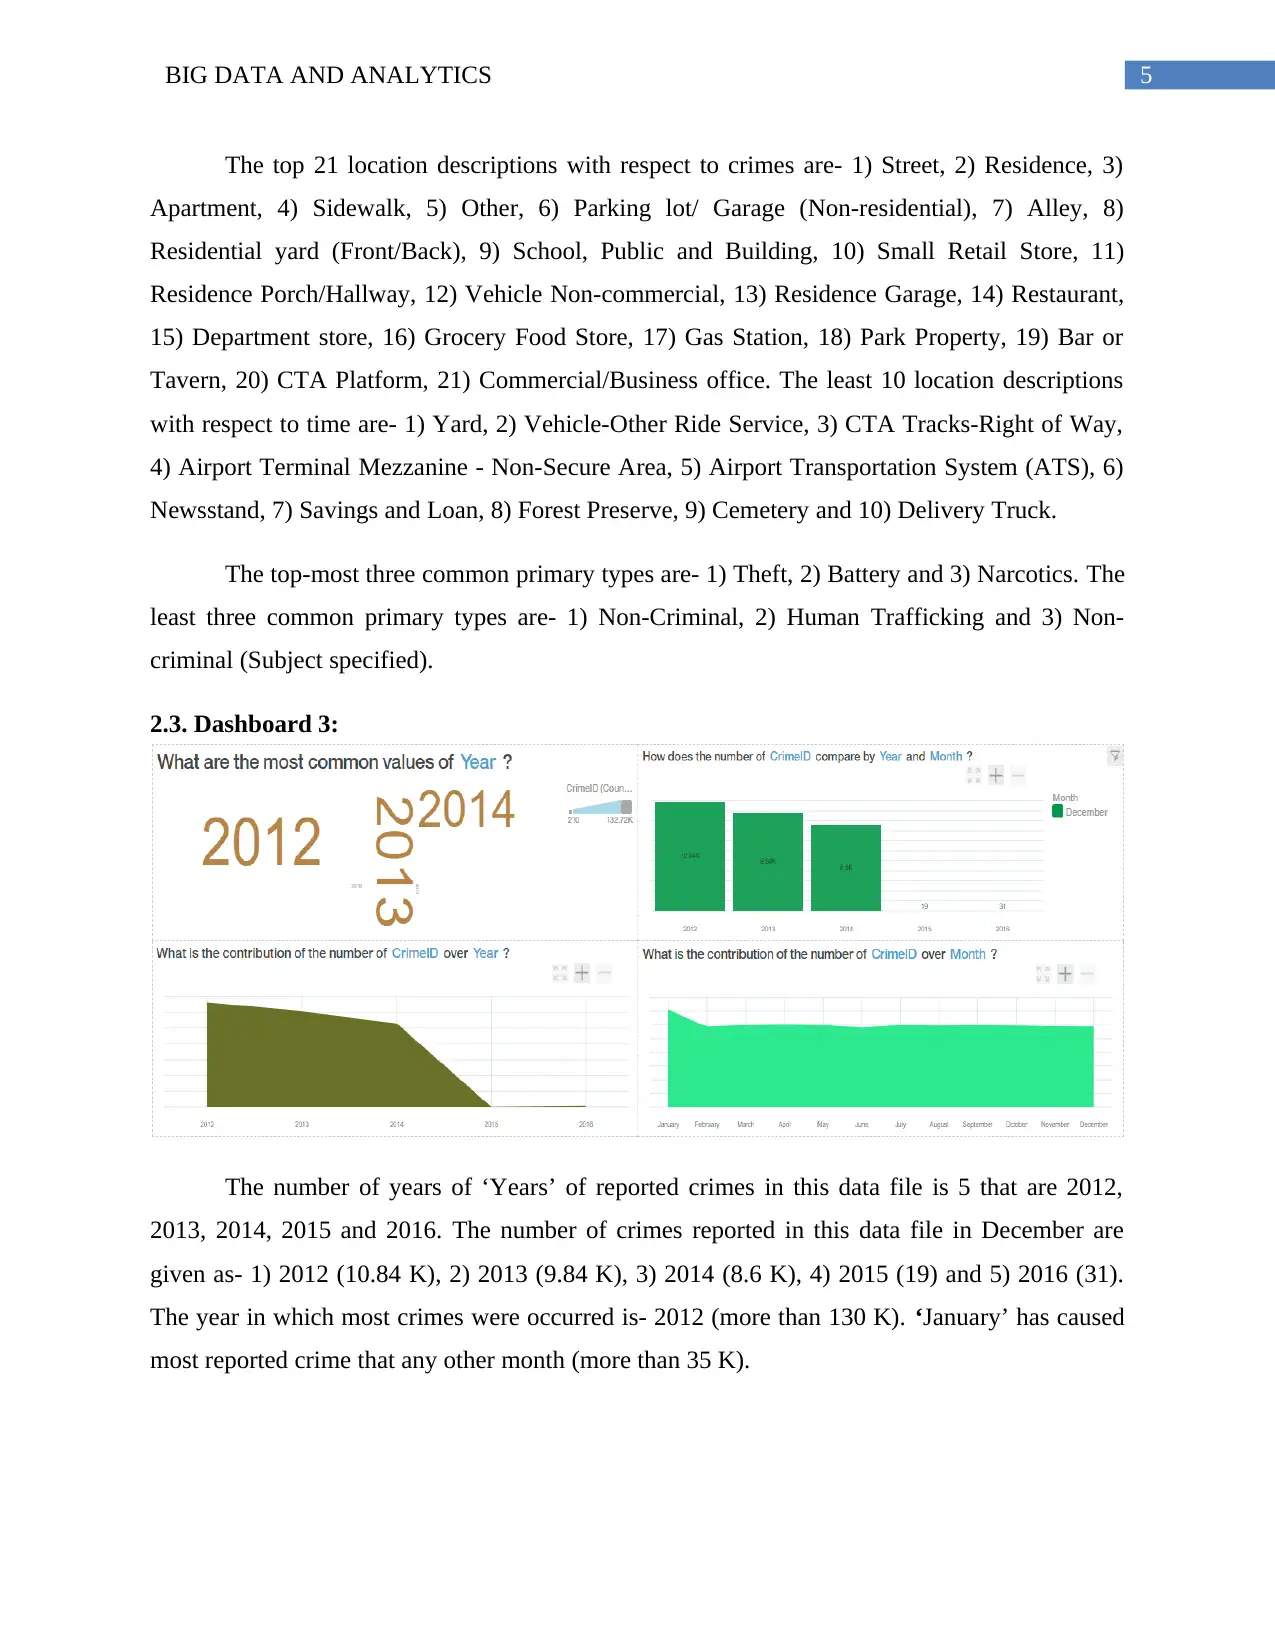
The top 21 location descriptions with respect to crimes are- 1) Street, 2) Residence, 3)
Apartment, 4) Sidewalk, 5) Other, 6) Parking lot/ Garage (Non-residential), 7) Alley, 8)
Residential yard (Front/Back), 9) School, Public and Building, 10) Small Retail Store, 11)
Residence Porch/Hallway, 12) Vehicle Non-commercial, 13) Residence Garage, 14) Restaurant,
15) Department store, 16) Grocery Food Store, 17) Gas Station, 18) Park Property, 19) Bar or
Tavern, 20) CTA Platform, 21) Commercial/Business office. The least 10 location descriptions
with respect to time are- 1) Yard, 2) Vehicle-Other Ride Service, 3) CTA Tracks-Right of Way,
4) Airport Terminal Mezzanine - Non-Secure Area, 5) Airport Transportation System (ATS), 6)
Newsstand, 7) Savings and Loan, 8) Forest Preserve, 9) Cemetery and 10) Delivery Truck.
The top-most three common primary types are- 1) Theft, 2) Battery and 3) Narcotics. The
least three common primary types are- 1) Non-Criminal, 2) Human Trafficking and 3) Non-
criminal (Subject specified).
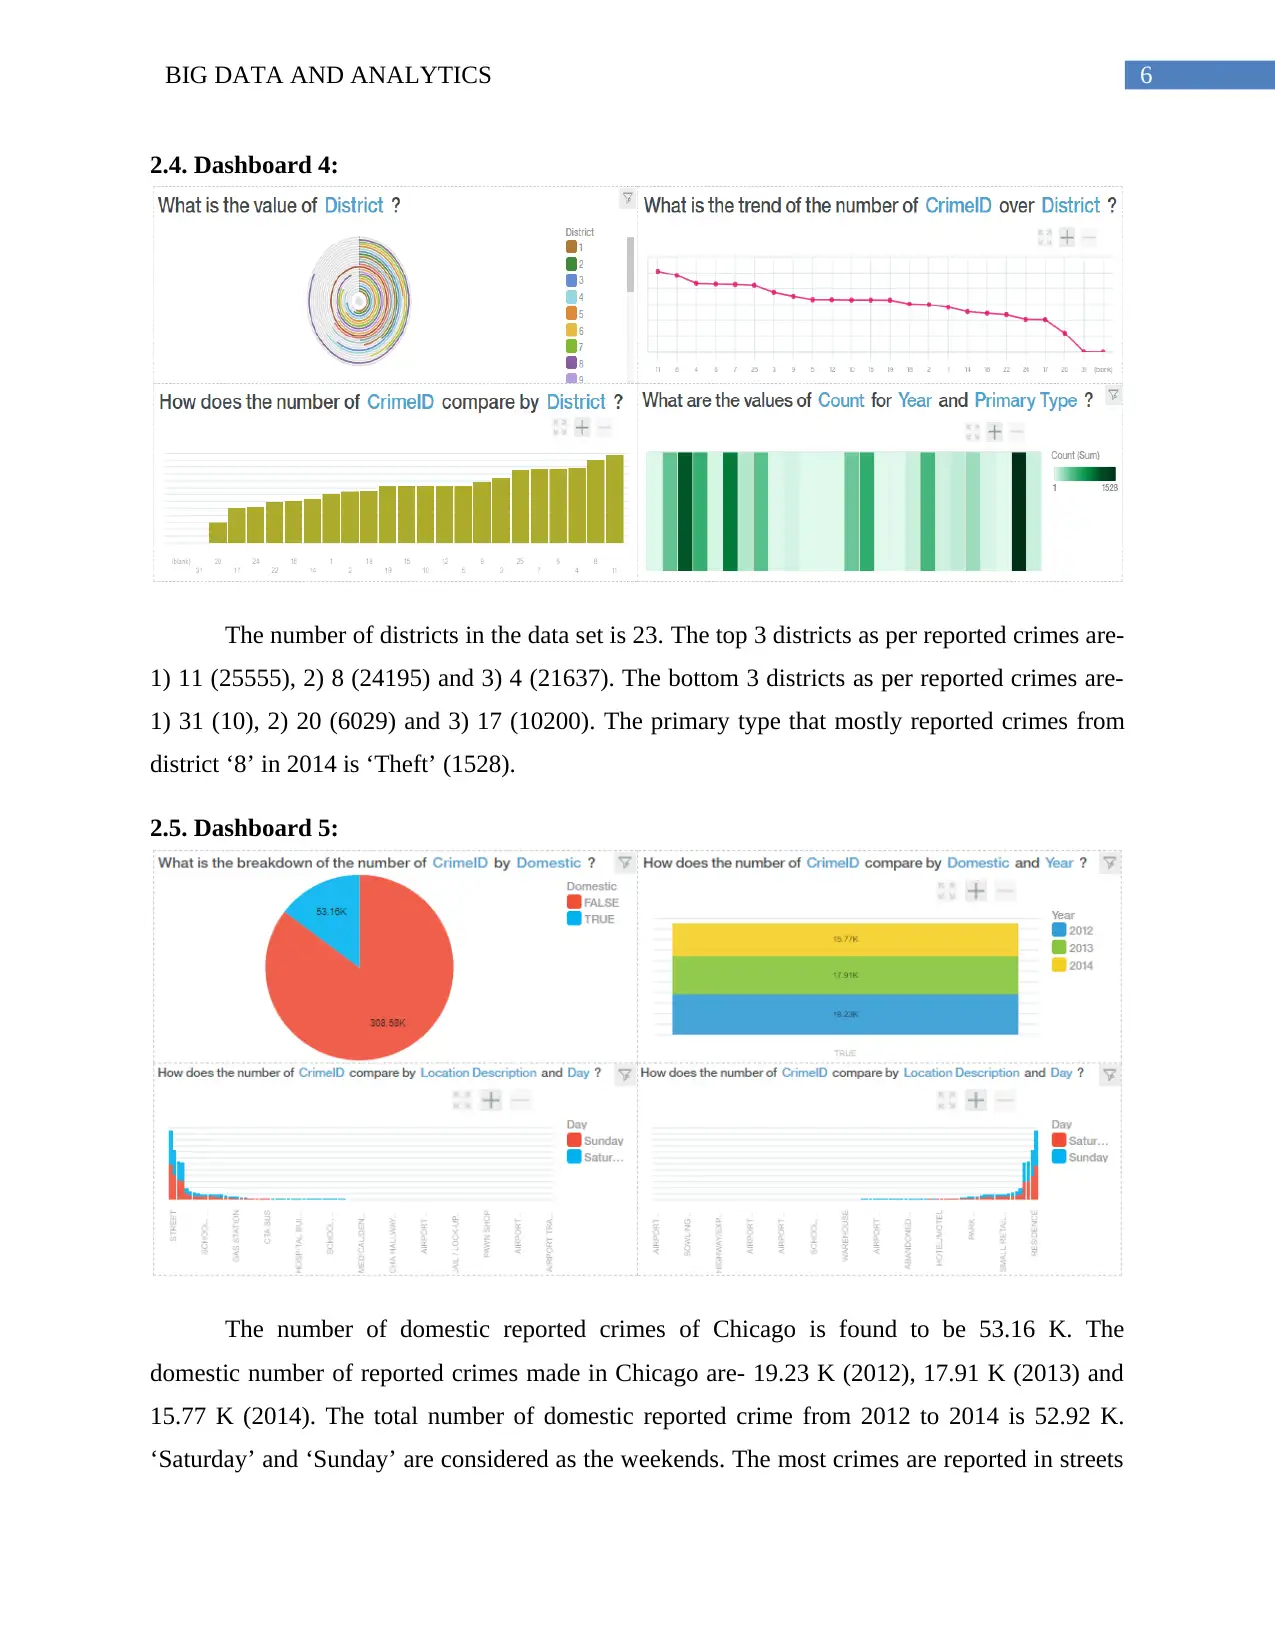
2.3. Dashboard 3:
The number of years of ‘Years’ of reported crimes in this data file is 5 that are 2012,
2013, 2014, 2015 and 2016. The number of crimes reported in this data file in December are
given as- 1) 2012 (10.84 K), 2) 2013 (9.84 K), 3) 2014 (8.6 K), 4) 2015 (19) and 5) 2016 (31).
The year in which most crimes were occurred is- 2012 (more than 130 K). ‘January’ has caused
most reported crime that any other month (more than 35 K).
The top 21 location descriptions with respect to crimes are- 1) Street, 2) Residence, 3)
Apartment, 4) Sidewalk, 5) Other, 6) Parking lot/ Garage (Non-residential), 7) Alley, 8)
Residential yard (Front/Back), 9) School, Public and Building, 10) Small Retail Store, 11)
Residence Porch/Hallway, 12) Vehicle Non-commercial, 13) Residence Garage, 14) Restaurant,
15) Department store, 16) Grocery Food Store, 17) Gas Station, 18) Park Property, 19) Bar or
Tavern, 20) CTA Platform, 21) Commercial/Business office. The least 10 location descriptions
with respect to time are- 1) Yard, 2) Vehicle-Other Ride Service, 3) CTA Tracks-Right of Way,
4) Airport Terminal Mezzanine - Non-Secure Area, 5) Airport Transportation System (ATS), 6)
Newsstand, 7) Savings and Loan, 8) Forest Preserve, 9) Cemetery and 10) Delivery Truck.
The top-most three common primary types are- 1) Theft, 2) Battery and 3) Narcotics. The
least three common primary types are- 1) Non-Criminal, 2) Human Trafficking and 3) Non-
criminal (Subject specified).
2.3. Dashboard 3:
The number of years of ‘Years’ of reported crimes in this data file is 5 that are 2012,
2013, 2014, 2015 and 2016. The number of crimes reported in this data file in December are
given as- 1) 2012 (10.84 K), 2) 2013 (9.84 K), 3) 2014 (8.6 K), 4) 2015 (19) and 5) 2016 (31).
The year in which most crimes were occurred is- 2012 (more than 130 K). ‘January’ has caused
most reported crime that any other month (more than 35 K).
⊘ This is a preview!⊘
Do you want full access?
Subscribe today to unlock all pages.
Trusted by 1+ million students worldwide
6BIG DATA AND ANALYTICS
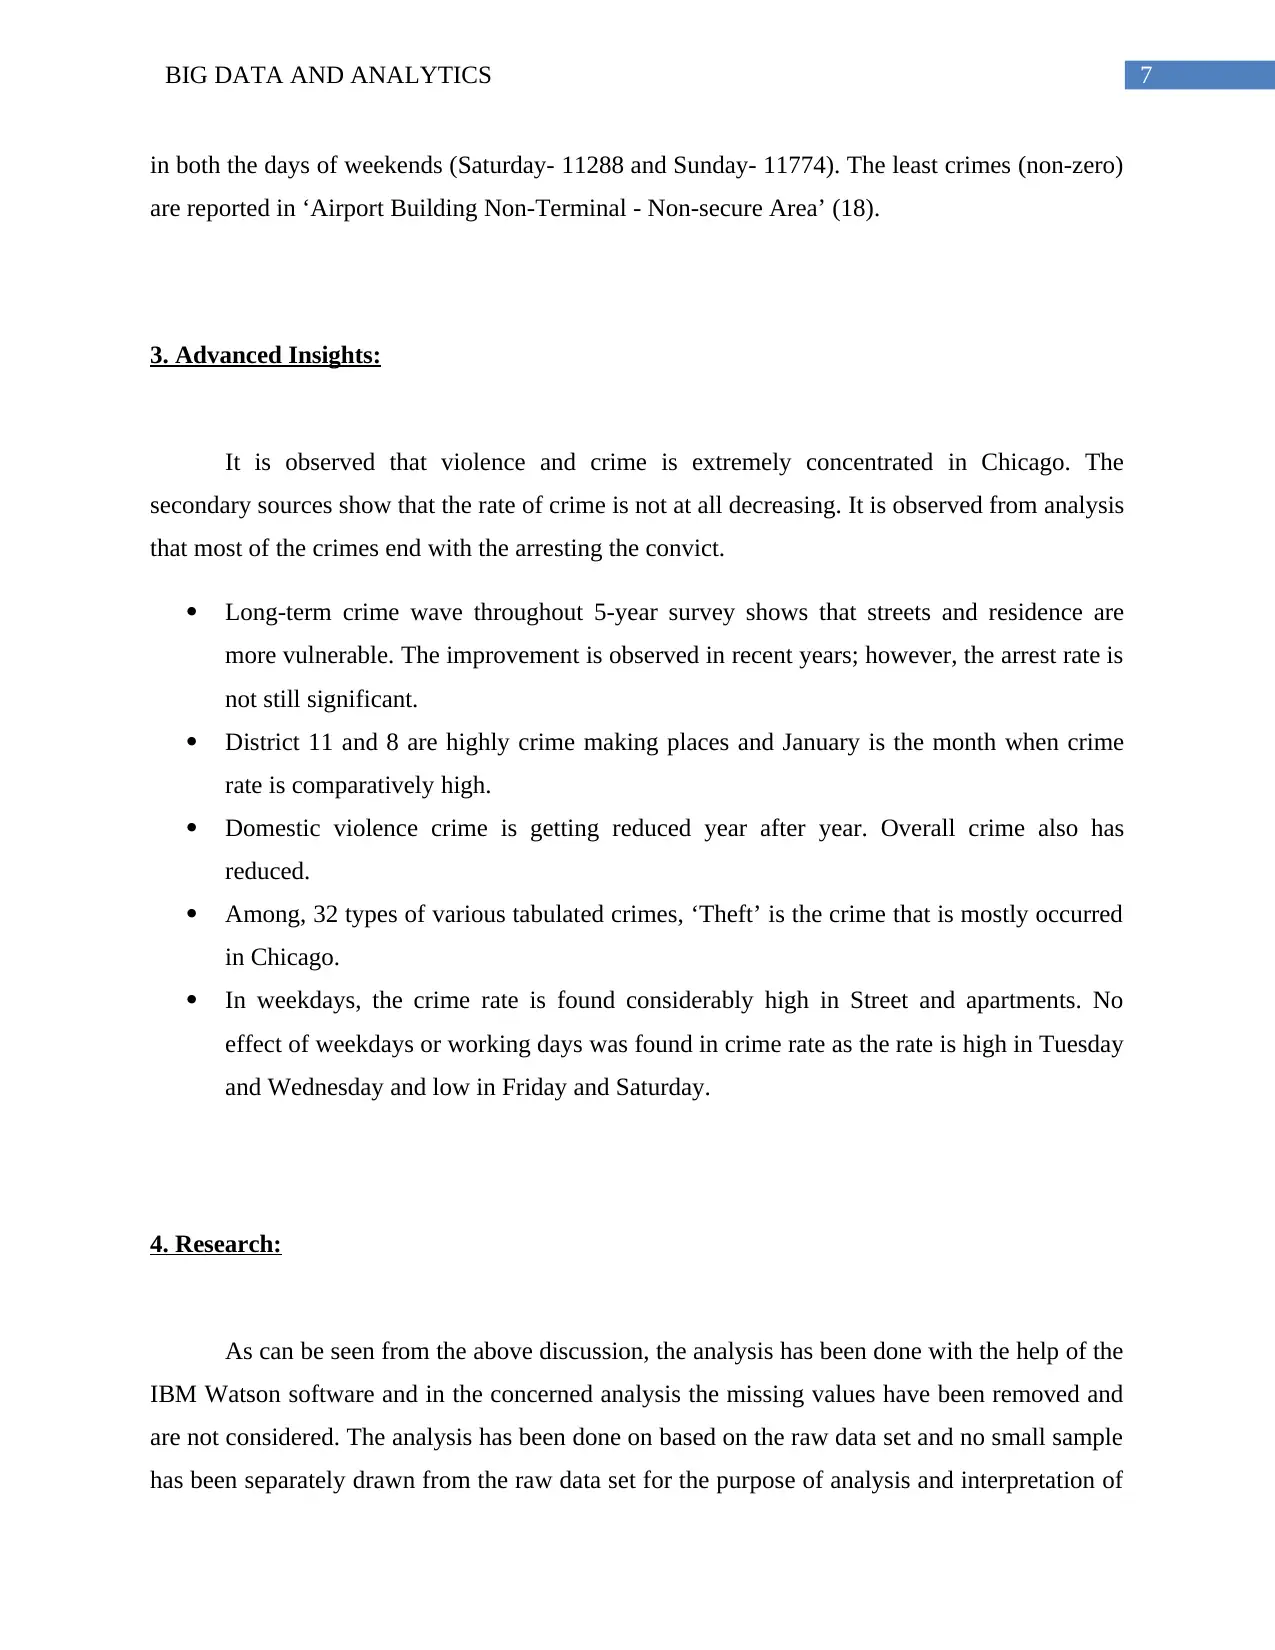
2.4. Dashboard 4:
The number of districts in the data set is 23. The top 3 districts as per reported crimes are-
1) 11 (25555), 2) 8 (24195) and 3) 4 (21637). The bottom 3 districts as per reported crimes are-
1) 31 (10), 2) 20 (6029) and 3) 17 (10200). The primary type that mostly reported crimes from
district ‘8’ in 2014 is ‘Theft’ (1528).
2.5. Dashboard 5:
The number of domestic reported crimes of Chicago is found to be 53.16 K. The
domestic number of reported crimes made in Chicago are- 19.23 K (2012), 17.91 K (2013) and
15.77 K (2014). The total number of domestic reported crime from 2012 to 2014 is 52.92 K.
‘Saturday’ and ‘Sunday’ are considered as the weekends. The most crimes are reported in streets
Paraphrase This Document
Need a fresh take? Get an instant paraphrase of this document with our AI Paraphraser
7BIG DATA AND ANALYTICS
in both the days of weekends (Saturday- 11288 and Sunday- 11774). The least crimes (non-zero)
are reported in ‘Airport Building Non-Terminal - Non-secure Area’ (18).
3. Advanced Insights:
It is observed that violence and crime is extremely concentrated in Chicago. The
secondary sources show that the rate of crime is not at all decreasing. It is observed from analysis
that most of the crimes end with the arresting the convict.
Long-term crime wave throughout 5-year survey shows that streets and residence are
more vulnerable. The improvement is observed in recent years; however, the arrest rate is
not still significant.
District 11 and 8 are highly crime making places and January is the month when crime
rate is comparatively high.
Domestic violence crime is getting reduced year after year. Overall crime also has
reduced.
Among, 32 types of various tabulated crimes, ‘Theft’ is the crime that is mostly occurred
in Chicago.
In weekdays, the crime rate is found considerably high in Street and apartments. No
effect of weekdays or working days was found in crime rate as the rate is high in Tuesday
and Wednesday and low in Friday and Saturday.
4. Research:
As can be seen from the above discussion, the analysis has been done with the help of the
IBM Watson software and in the concerned analysis the missing values have been removed and
are not considered. The analysis has been done on based on the raw data set and no small sample
has been separately drawn from the raw data set for the purpose of analysis and interpretation of
8BIG DATA AND ANALYTICS
the crime rates and scenarios in Chicago in the contemporary period (Chen, Chiang & Storey,
2012).
The interpretation and analysis have been done with the help of dashboard analysis and
representation, which, in the contemporary period, is one of the primary and most useful
methods used for the purpose of visual representation of large data and trends (Ahishakiye et al.,
2013). The dashboard form of data representation has a very comprehensive and easily
understandable visual form of representation of the trends studied in a research, which in turn,
makes it immensely easy for the readers to understand the complicated trends and patterns
(Miller, 2016). Taking this into consideration, this form of analysis and interpretation has been
used for the concerned study.
5. Recommendations for Police Chief:
Based on the analysis the following aspects are recommended to the police chief:
The crime on streets and residents being increasing over the years, the department needs
to increase its vigilance in these areas.
The number of relevant arrests should be increased and stricter laws should be imposed.
Theft being one of the most commonly occurring the department needs to be stricter in
these aspects.
The patrolling and vigilance need to be high on weekdays as the crime rates can be seen
to be higher in the apartments in these days (Kubrin & Ishizawa, 2012).
⊘ This is a preview!⊘
Do you want full access?
Subscribe today to unlock all pages.
Trusted by 1+ million students worldwide
9BIG DATA AND ANALYTICS
6. Cover Letter:
Dear Sir/Madam,
Based on the research conducted and the data analysis in the concerned study, few things can be
asserted about the trends in the crime rates in Chicago in the contemporary period. The data
analysis and findings show that in the contemporary period, the residences and the streets of
Chicago have both been becoming more vulnerable to different kinds of crimes and in spite of
several improvements in the recent periods, the arrest rates of the offenders by the Police
Department remain considerably low. Crime rates can be seen to be considerably high in
January. However, in the concerned period, the crime rates regarding those of domestic violence
can be seen to have decreased to some extent, which is a positive trait.
These findings, in turn, suggest that the police department of the concerned region has to
increase their vigilance and patrolling in the concerned region, especially on the streets and
residences and the judiciary also needs to be stricter regarding arresting and post arrest
procedures, especially for thefts, as the same is highest form of crime in the concerned region.
Surveillance also needs to be increased in weekdays.
Thank You.
7. Research Reflection:
Conducting the concerned research on the crime trends in the region of Chicago for the
concerned period of time has been a learning experience, both in terms of research related
activities as well as in terms of increase in the knowledge base regarding the trends and patterns
of crime rates in the concerned region. However, several challenges were incurred while carrying
out the research, the primary ones being the selection and analysis of the huge raw data and
organization of the same so as to make the findings easily comprehendible. Sorting the findings
across regions, time frames and types of crimes have also been a challenge in the concerned
Paraphrase This Document
Need a fresh take? Get an instant paraphrase of this document with our AI Paraphraser
10BIG DATA AND ANALYTICS
research. However, these activities have helped the concerned research to recommend relevant
solutions to the issues regarding the crime rates and incidences in the concerned region.
References:
Ahishakiye, E., Omulo, E. O., Taremwa, D., & Wario, R. (2013). Comparative Analysis of Open
source Business Intelligence tools for Crime Data Analytics.
Arnio, A. N., & Baumer, E. P. (2012). Demography, foreclosure, and crime: Assessing spatial
heterogeneity in contemporary models of neighborhood crime rates. Demographic
Research, 26, 449-486.
Arnio, A. N., Baumer, E. P., & Wolff, K. T. (2012). The contemporary foreclosure crisis and US
crime rates. Social science research, 41(6), 1598-1614.Burdick-Will, J., 2013. School
violent crime and academic achievement in Chicago. Sociology of education, 86(4),
pp.343-361.
Burdick-Will, J. (2013). School violent crime and academic achievement in Chicago. Sociology
of education, 86(4), 343-361.
Chen, H., Chiang, R. H., & Storey, V. C. (2012). Business intelligence and analytics: from big
data to big impact. MIS quarterly, 1165-1188.
Cohen, L. E., & Felson, M. (2016). Social Change and Crime Rate Trends: A Routine Activity
Approach (1979). In Classics in Environmental Criminology (pp. 203-232). CRC Press.
data.world. (2018). Data.world. Retrieved 21 September 2018, from
https://data.world/mchadhar/chicagocrime-dataset
Kubrin, C. E., & Ishizawa, H. (2012). Why some immigrant neighborhoods are safer than others:
Divergent findings from Los Angeles and Chicago. The Annals of the American Academy
of Political and Social Science, 641(1), 148-173.
Miller, J. D. (2016). Learning IBM Watson Analytics. Packt Publishing Ltd.
1 out of 11
Related Documents


Your All-in-One AI-Powered Toolkit for Academic Success.
+13062052269
info@desklib.com
Available 24*7 on WhatsApp / Email
![[object Object]](/_next/static/media/star-bottom.7253800d.svg)
Unlock your academic potential
Copyright © 2020–2026 A2Z Services. All Rights Reserved. Developed and managed by ZUCOL.