ITECH1103 Big Data and Analytics: Crime Data Analysis and Insights
VerifiedAdded on 2023/06/04
|17
|2108
|443
Report
AI Summary
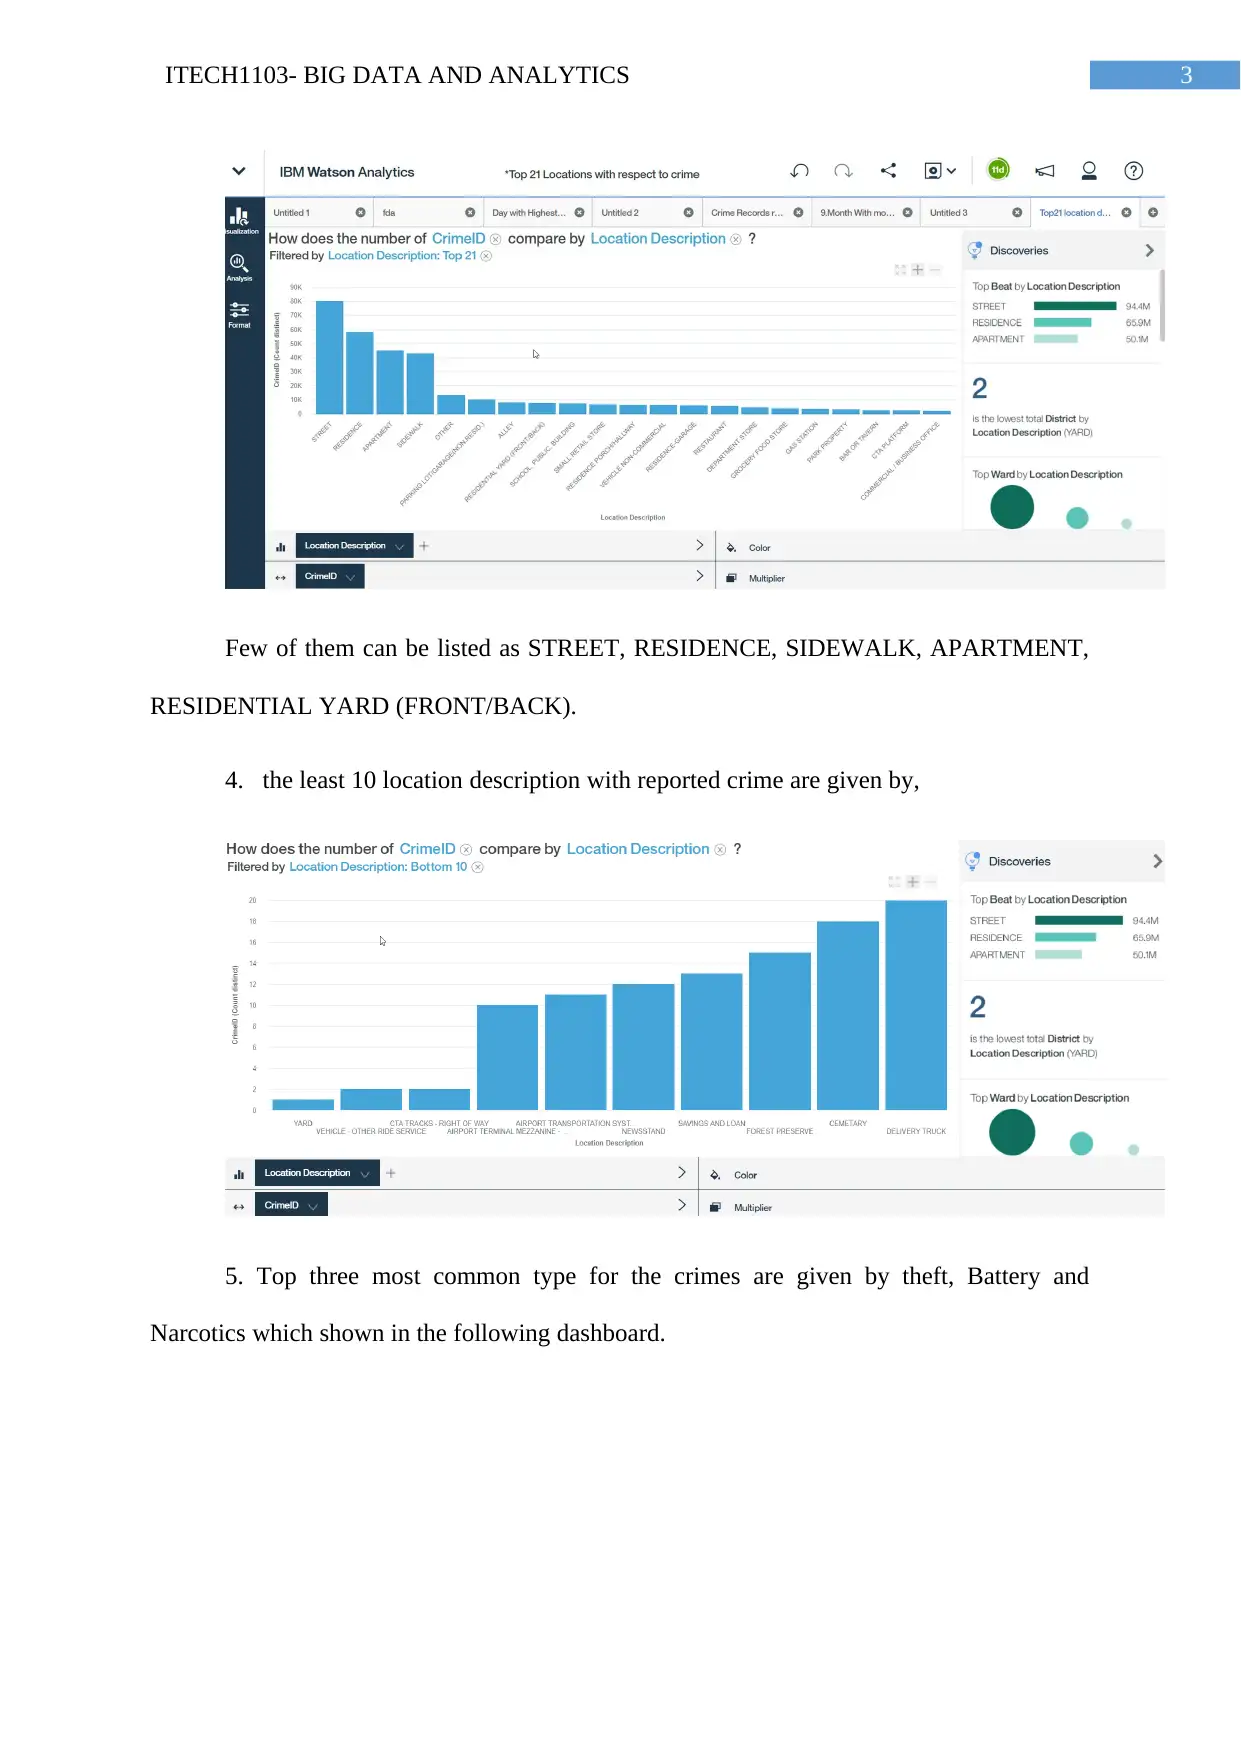
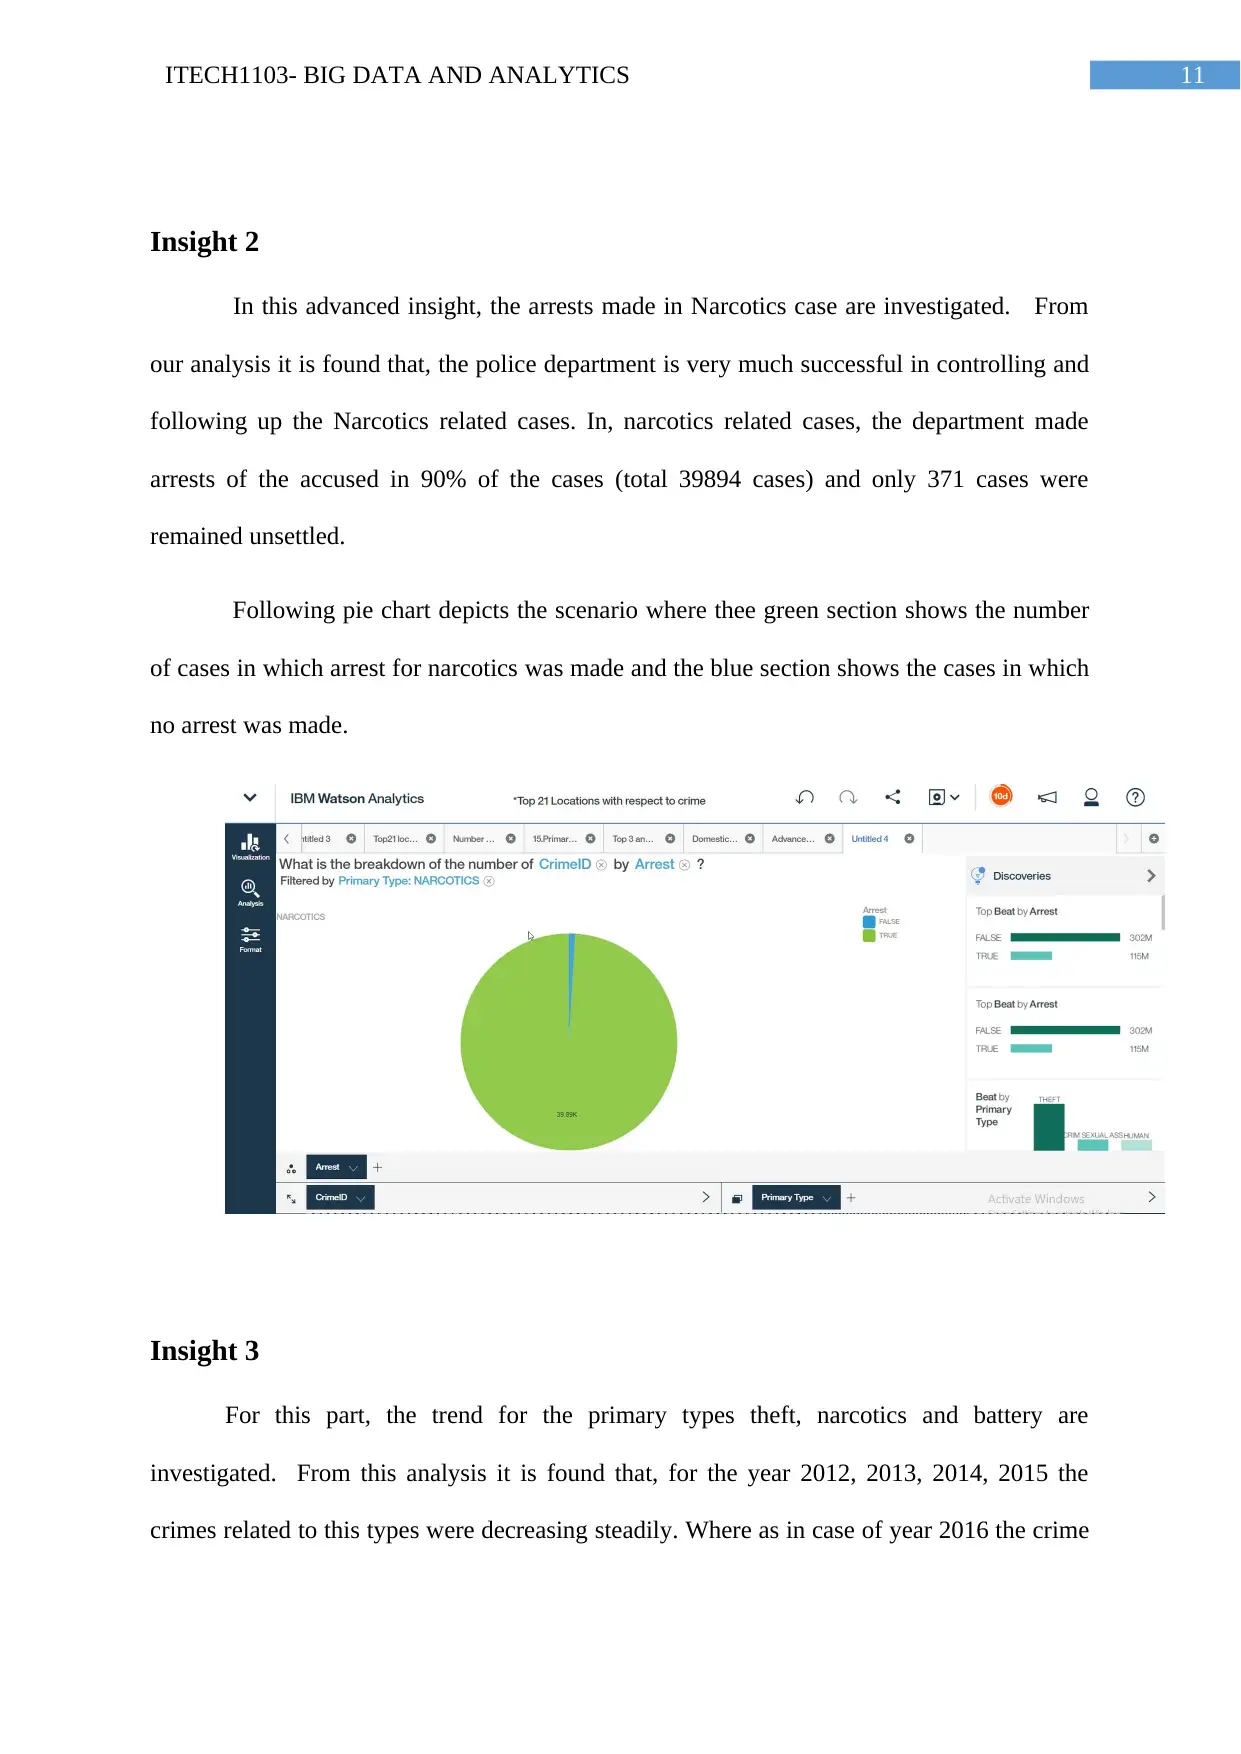
This report presents an analysis of crime data from Chicago (2012-2016) using IBM Watson Analytics. It identifies crime trends, high-risk locations, and arrest patterns. Key findings include the prevalence of theft, battery, and narcotics-related crimes, the high crime rates on streets and sidewalks, and the disproportionately low arrest rates compared to reported crimes. The report also provides recommendations to the Police Chief, emphasizing increased security in high-crime areas and improved response times for common crime types. The analysis uses dashboards and visualizations to illustrate insights, such as the decreasing trend of certain crimes from 2012-2015, the district with the most domestic crimes, and a comparison of reported crimes versus arrests.
Contribute Materials
Your contribution can guide someone’s learning journey. Share your
documents today.

Running head: ITECH1103- BIG DATA AND ANALYTICS
ITECH1103- Big Data and Analytics
Name of the Student
Name of the University
Authors note
ITECH1103- Big Data and Analytics
Name of the Student
Name of the University
Authors note
Secure Best Marks with AI Grader
Need help grading? Try our AI Grader for instant feedback on your assignments.

1ITECH1103- BIG DATA AND ANALYTICS
Table of Contents
Introduction................................................................................................................................2
Task 1: Background information...............................................................................................2
Task 2 – Reporting / Dashboards...............................................................................................2
Task 3 – Advanced Insights.....................................................................................................10
Insight 1....................................................................................................................10
Insight 2....................................................................................................................11
Insight 3....................................................................................................................11
Insight 4....................................................................................................................12
Insight 5....................................................................................................................13
Task 4 – Research....................................................................................................................13
Task 5 – Recommendations for POLICE CHIEF....................................................................14
Task 6 – Cover letter................................................................................................................14
Task 7 - The Reflection............................................................................................................15
Bibliography.............................................................................................................................16

2ITECH1103- BIG DATA AND ANALYTICS
Introduction
The main objective of this project is to find out the insight from the available data set
using the IBM Watson data analytics tool. With the use of big data analytics, the firm will
be able to find the risk and opportunity to prevent the increase in the crime, trends of different
crimes in the different beats or wards. In this way the Police department can proactively
identify and manage the risks associated with crime trends in order protect the citizens in the
locality.
Following report contributes to the discussion about the insights from the analysis,
and recommendation for the police chief with some advanced insights from the given dataset.
Task 1: Background information
The selected data set is comma separated file that contains the crime record for the
Chicago city for the time period of year 2012 to 2017. The data file contains 24 columns
which stores data about a crime and its different attributes such as Unique identifier ID, Case
Number, Incident date, Illinois Unifrom Crime Reporting code, block in which the incident
occurred, Primary Type or description of the crime, FBI code, community area etc.
Task 2 – Reporting / Dashboards
1. For the first dataset, there are 361741 reported crimes in the given dataset.
2. There are 32 types of reported crime in the selected dataset.
3. Top 21 location description by the following dashboard,

3ITECH1103- BIG DATA AND ANALYTICS
Few of them can be listed as STREET, RESIDENCE, SIDEWALK, APARTMENT,
RESIDENTIAL YARD (FRONT/BACK).
4. the least 10 location description with reported crime are given by,
5. Top three most common type for the crimes are given by theft, Battery and
Narcotics which shown in the following dashboard.
Few of them can be listed as STREET, RESIDENCE, SIDEWALK, APARTMENT,
RESIDENTIAL YARD (FRONT/BACK).
4. the least 10 location description with reported crime are given by,
5. Top three most common type for the crimes are given by theft, Battery and
Narcotics which shown in the following dashboard.
Secure Best Marks with AI Grader
Need help grading? Try our AI Grader for instant feedback on your assignments.

4ITECH1103- BIG DATA AND ANALYTICS
6. Three least common primary types are NON-CRIMINAL (4 records), NON-
CRIMINAL (SUBJECT SPECIFIED) (1 Record), HUMAN TRAFFICKING (1 Record).
Following dashboards of Watson analytics shows the same.
7. The data set contains crime records of 5 years (2012,2013,2014,2015,2016)
8.For the year 2012, 2013, 2014, 2015, 2016 the number of crime records for
December months are 1084, 9836, 8601, 19, 31. Following dashboard depicts the result.

5ITECH1103- BIG DATA AND ANALYTICS
9. According to the given dataset the maximum number of reported crimes are in the
year of 2012. The total number of reported crimes are 132721. Where as in the years
2013,2014, 2015 and 2016 the number of recorded crimes are 121130, 106139, 210 and
1541.Following is the dashboard depicting the result;
10. January, 2012 generated the most reported crime in the Chicago city. Related
Dashboard is depicted below.

6ITECH1103- BIG DATA AND ANALYTICS
11. The number of cases where an arrest was made is given by 102147. Following is
the dashboard for this result.
12. For the given dataset there are total 31 distinct districts in it.
13.Top three districts in terms of the reported crimes are district number District 8,
District 25 and District 11. Following is the related dashboard on Watson analytics.
Paraphrase This Document
Need a fresh take? Get an instant paraphrase of this document with our AI Paraphraser

7ITECH1103- BIG DATA AND ANALYTICS
14. The least three districts according to the given data set and analysis on IBM
Watson are District 20, 17 and 24.
15. The primary type that reported most crimes from the district “8” in the year 2014
is Theft. Following is the dashboard depicting the result.
16. From the given crime record dataset the total number of domestic reported crime
is 53161. In the following dash board the green coloured circle depicts the number of the
total number of domestic crimes.

8ITECH1103- BIG DATA AND ANALYTICS
17.Domestic number of reported crimes in the years 2012, 2013 and 2014 are given
by 19231, 17914 and 15766. Following is the dashboard for the given results.
18. The busiest day of the week in terms of committed crimes is Sunday of the year
2012, where 2405 crimes were committed. Following is the related dash board

9ITECH1103- BIG DATA AND ANALYTICS
19. Location description with most number of recorded crimes is the Street which
includes the Saturdays and Sundays. Following is the Dash board.
20. The location description that has the least number of crime recorded in the
weekends is the AIRPORT TERMINAL MEZZANINE - NON-SECURE AREA that has
only three reported crimes. Following is the created dashboard,
Secure Best Marks with AI Grader
Need help grading? Try our AI Grader for instant feedback on your assignments.

10ITECH1103- BIG DATA AND ANALYTICS
Task 3 – Advanced Insights
Insight 1
In this part, the trend of arrests for the primary type of the crime is derived from the
Watson analytics tool which resulted in the following dashboard which shows that the
maximum number of arrests from the Street.
Task 3 – Advanced Insights
Insight 1
In this part, the trend of arrests for the primary type of the crime is derived from the
Watson analytics tool which resulted in the following dashboard which shows that the
maximum number of arrests from the Street.

11ITECH1103- BIG DATA AND ANALYTICS
Insight 2
In this advanced insight, the arrests made in Narcotics case are investigated. From
our analysis it is found that, the police department is very much successful in controlling and
following up the Narcotics related cases. In, narcotics related cases, the department made
arrests of the accused in 90% of the cases (total 39894 cases) and only 371 cases were
remained unsettled.
Following pie chart depicts the scenario where thee green section shows the number
of cases in which arrest for narcotics was made and the blue section shows the cases in which
no arrest was made.
Insight 3
For this part, the trend for the primary types theft, narcotics and battery are
investigated. From this analysis it is found that, for the year 2012, 2013, 2014, 2015 the
crimes related to this types were decreasing steadily. Where as in case of year 2016 the crime

12ITECH1103- BIG DATA AND ANALYTICS
related to battery and theft were increased. Following is the Watson dashboard depicting the
same.
Insight 4
In this insight the district with the maximum number of domestic reported crimes
were investigated and from the analysis it is found that, the highest number of reported
domestic crimes happened in the district 25 and the minimum number of domestic crime was
reported from the district 1.
Dashboard related to that depicted in the following figure;
Paraphrase This Document
Need a fresh take? Get an instant paraphrase of this document with our AI Paraphraser

13ITECH1103- BIG DATA AND ANALYTICS
Insight 5
In this advanced insight the comparison between the reported crimes and arrests for
them were compared against every year. The results of the analysis id provided below;
From above figure it can be stated that there is way less number of arrest when
compared to the reported crimes. Thus it can be said that most of the crimes results or
resolved without arrest.

14ITECH1103- BIG DATA AND ANALYTICS
Task 4 – Research
As the given dataset was related to crime records that were recorded for the crimes in
the Chicago city, thus the analysis related to the most number of crimes and the trend of the
crime can be helpful for the police department as with results of this analysis can help in
protecting the citizen by employing the officers and protection at different sensitive locations
at which there is a possibility of occurrence of the crimes.
This analysis is also helpful in understanding the number of numerous type of crimes
and its occurrences over time in Chicago. Moreover the way the number arrests
corresponding to the crimes changed over time in Chicago also analysed in this project.
Task 5 – Recommendations for POLICE CHIEF
It is important to provide better security to the citizen on the street and sidewalks in
order to secure them from different kind of crimes as most of them are recorded as the
occurrence place for numerous crimes. It is recommended to have higher Police patrolling in
the areas which are analysed as most dangerous places in the analysis.
The crime rate particularly homicide in the year 2016 gained a sharp rise when it is
compared with the results of 2015, which must be taken care of. More over the
neighbourhood areas in of airport, harbours and streets appears to be most dangerous and
notorious areas compared to the other location descriptions provided in the dataset as
according to the analysis lot of crimes have been occurred in those places.
Task 6 – Cover letter
January 25, 2015
Police Chief,

15ITECH1103- BIG DATA AND ANALYTICS
Chicago City
I am writing this letter in order to deliver the insights from the provided dataset about
the crimes that happened in the last 5 years (2012-2016).
From our analysis we found that the maximum number of crime is happening on
streets on the weekends and are tend to be increasing, therefore in this regard it is suggested
to increase the number of officers on the streets for the weekends. Moreover, the most
common type for the crimes in the city are given by theft, Battery and Narcotics. Thus it is
suggested to improve the response time against this type of crimes.
Based on the analysis of the dataset it is also found that count of reported crimes are
much higher compared to number of arrests for the crimes. The number of crimes involving
sidewalks also seems to have greatly reduced. There is huge increase in the number of
homicides in Chicago in 2016 compared to previous years.
Thus it is suggested to have a look in the insights we have collected and take
necessary steps to mitigate and stop the occurrences of different crimes
Task 7 - The Reflection
In this data analysis project, the main challenges are determining the chart or
visualization types to better display the results of our analysis as most the cases include huge
amount of data in the charts. Moreover, as the dataset was too large inclusion of new variable
in charts for better results sometimes lead to complex scenarios. While completing the project
I learned to improve the analysis by including the other variables to display the impact of it
on the results.
Secure Best Marks with AI Grader
Need help grading? Try our AI Grader for instant feedback on your assignments.

16ITECH1103- BIG DATA AND ANALYTICS
Bibliography
Hurwitz, J. S., Kaufman, M., & Bowles, A. (2015). Cognitive computing and big data
analytics. John Wiley & Sons.
Mohammadi, M., & Al-Fuqaha, A. (2018). Enabling cognitive smart cities using big data and
machine learning: Approaches and challenges. IEEE Communications
Magazine, 56(2), 94-101.
Nagwanshi, K. K., & Dubey, S. (2018). Statistical Feature Analysis of Human Footprint for
Personal Identification Using BigML and IBM Watson Analytics. Arabian Journal
for Science and Engineering, 1-10.
Perlman, S. E., Gwynn, R. C., Greene, C. M., Freeman, A., Chernov, C., & Thorpe, L. E.
(2018). NYC HANES 2013–14 and Reflections on Future Population Health
Surveillance. Journal of Urban Health, 1-4.
Zhu, W. D. J., Foyle, B., Gagné, D., Gupta, V., Magdalen, J., Mundi, A. S., ... & Triska, M.
(2014). IBM Watson content analytics: Discovering actionable insight from your
content. IBM Redbooks.
1 out of 17
Related Documents

Your All-in-One AI-Powered Toolkit for Academic Success.
+13062052269
info@desklib.com
Available 24*7 on WhatsApp / Email
Unlock your academic potential
© 2024 | Zucol Services PVT LTD | All rights reserved.