Statistical Analysis of Crime Rates and Education Levels
VerifiedAdded on 2022/10/04
|4
|1075
|18
Homework Assignment
AI Summary
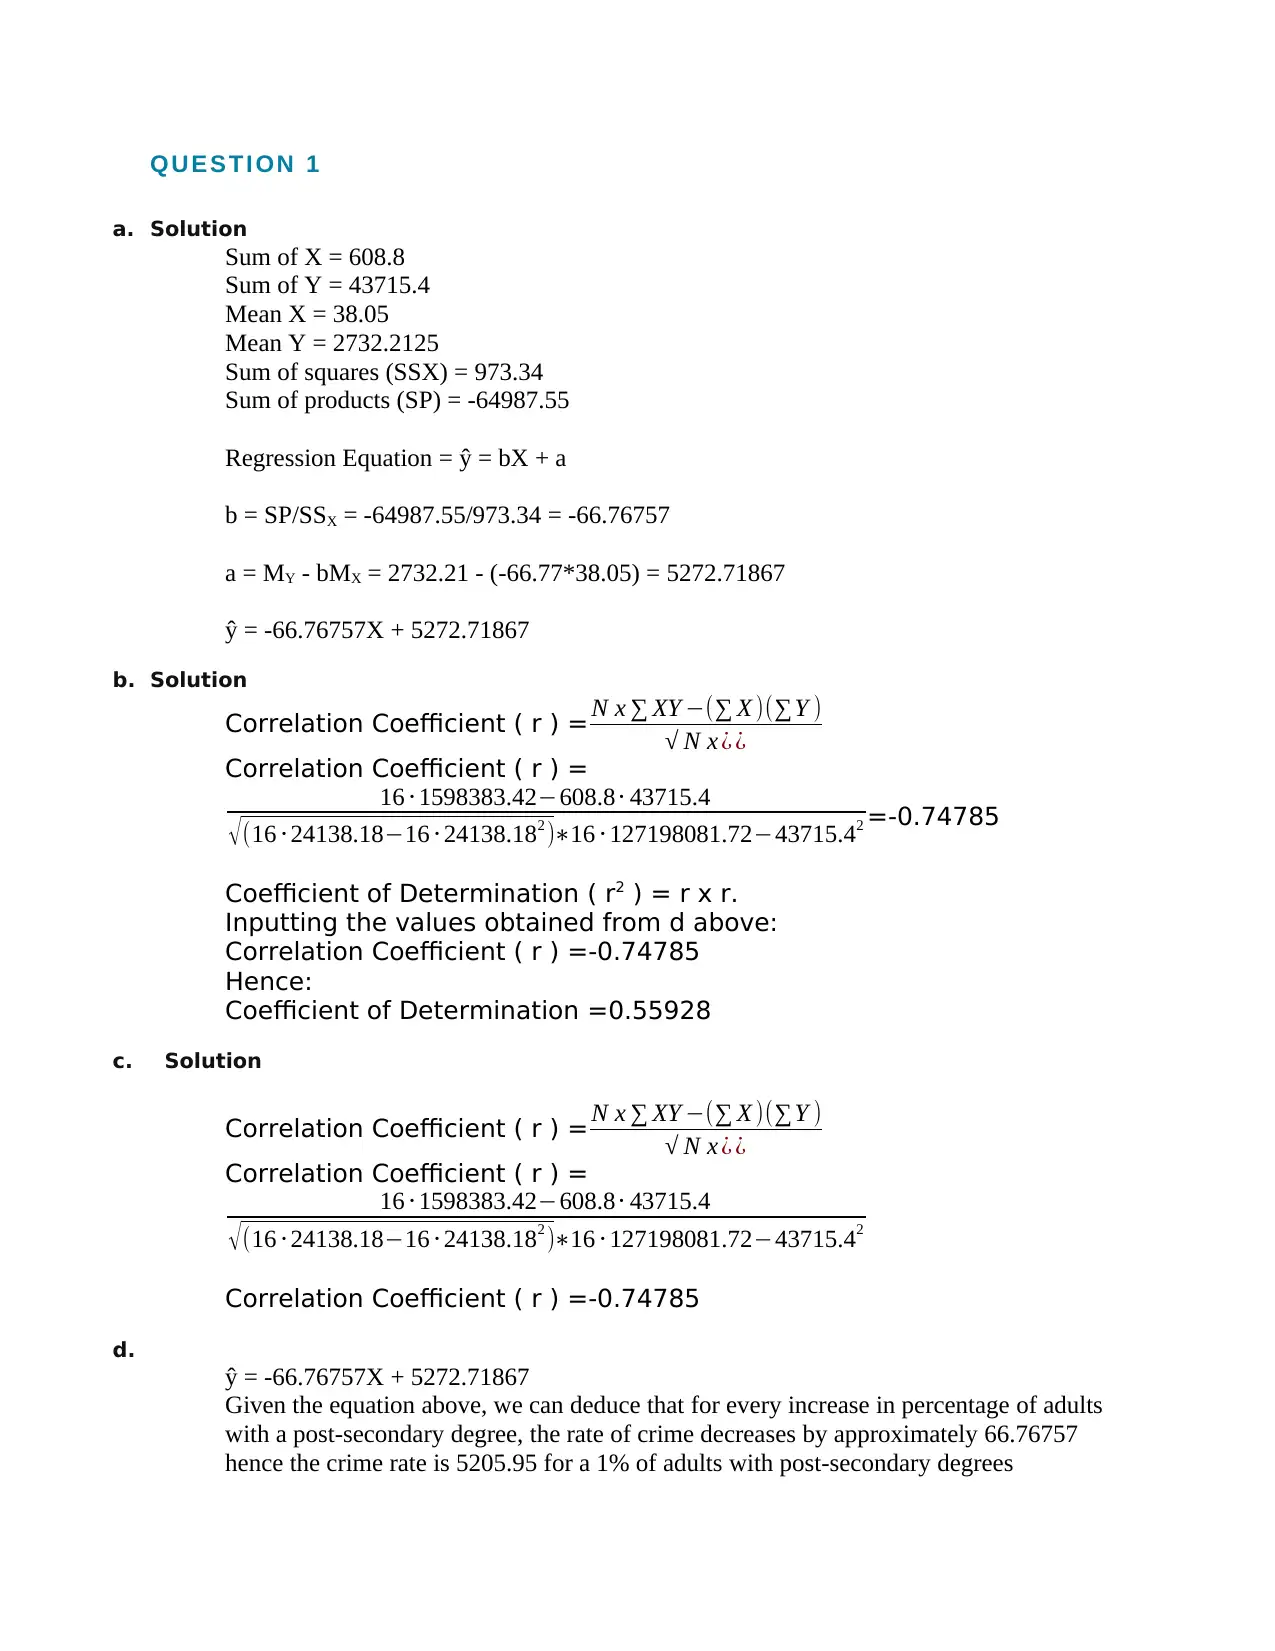
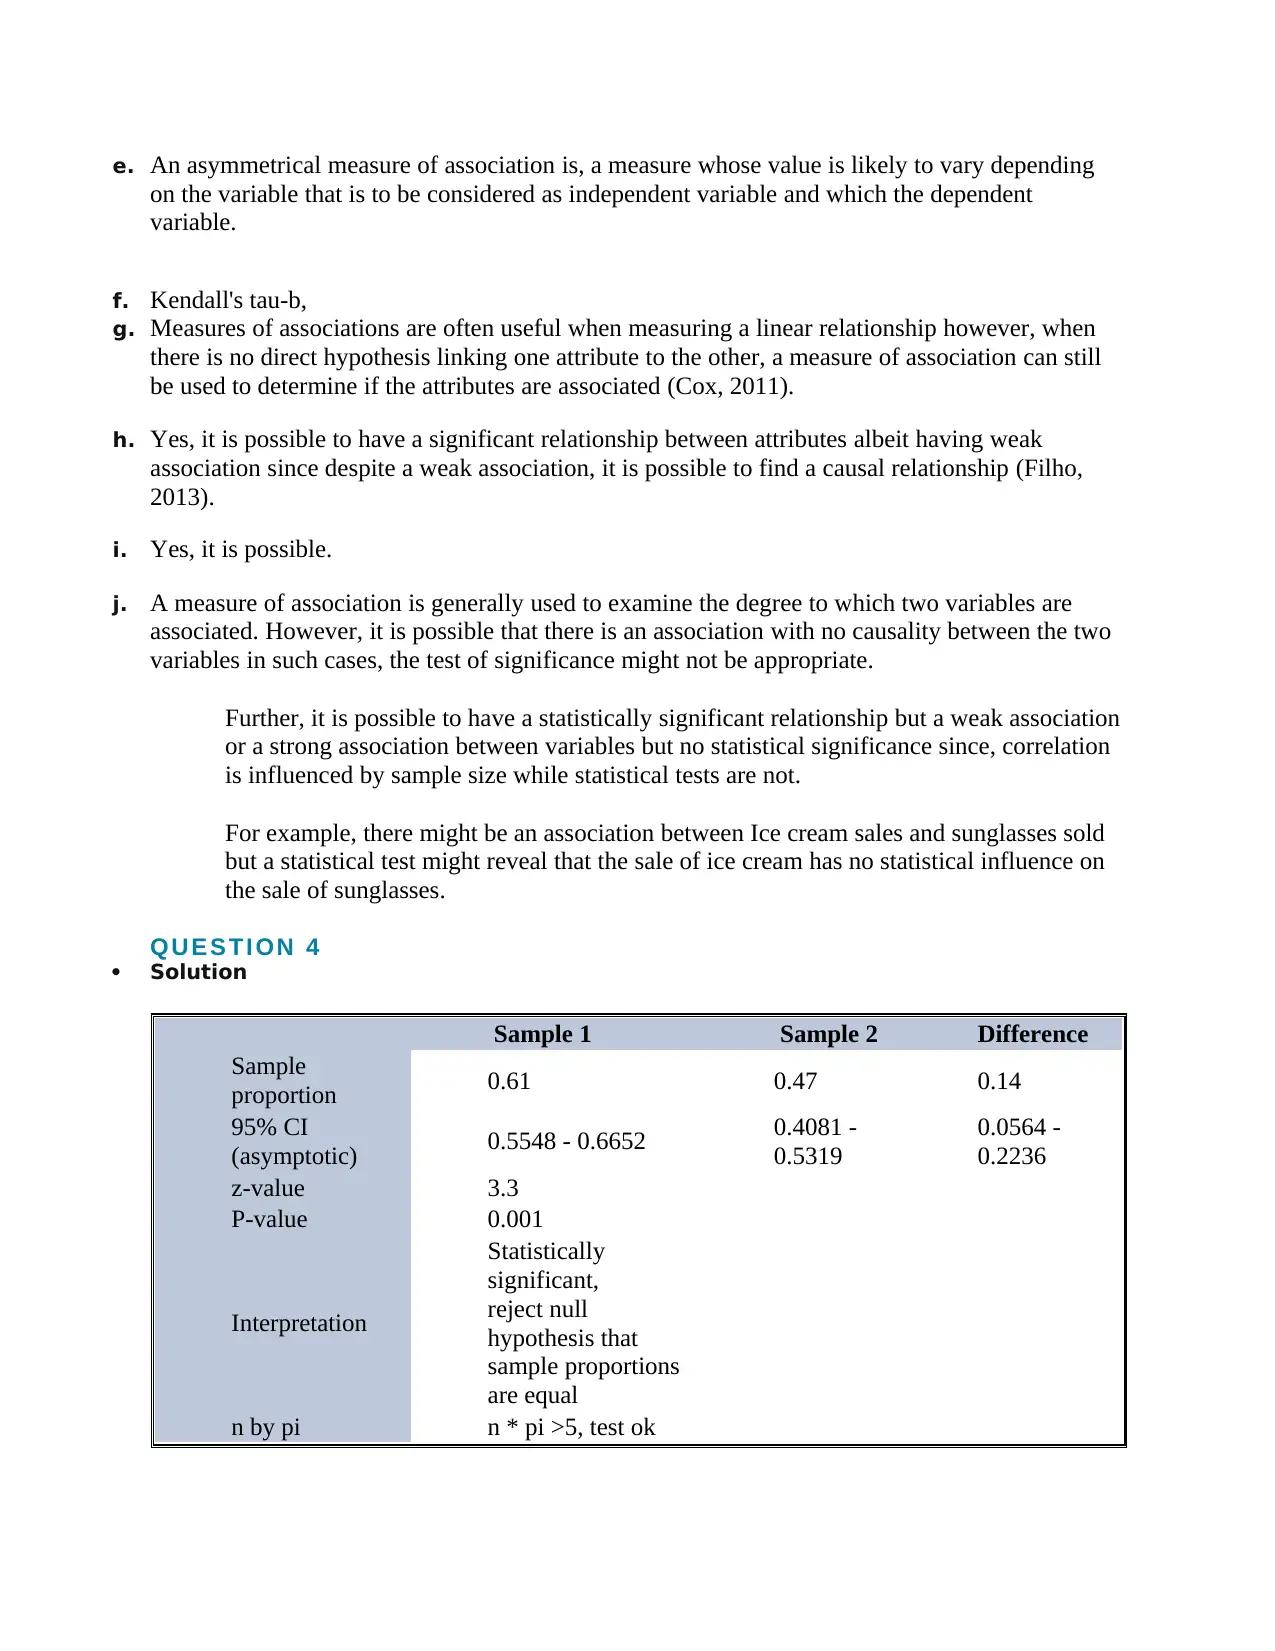
This statistics assignment addresses the relationship between crime rates and education levels across different states. The solution begins with a regression analysis, calculating the prediction equation, coefficient of determination, and Pearson's correlation coefficient. It then explores hypothesis testing, determining confidence intervals and assessing the significance of results. The assignment also delves into statistical concepts such as measures of association (Chi-square, Cramer's V, Gamma, Kendall's tau-b, and Pearson’s correlation coefficient), symmetrical and asymmetrical measures, PRE tests, and the interpretation of statistical significance versus association. Furthermore, the solution calculates confidence intervals for proportions and interprets the results within the context of the data provided, including a comparison of attitudes toward the police between different demographic groups. The assignment concludes with the evaluation of the usefulness of multiple regression in further analysis.

Q U E S T I O N 1
a. Solution
Sum of X = 608.8
Sum of Y = 43715.4
Mean X = 38.05
Mean Y = 2732.2125
Sum of squares (SSX) = 973.34
Sum of products (SP) = -64987.55
Regression Equation = ŷ = bX + a
b = SP/SSX = -64987.55/973.34 = -66.76757
a = MY - bMX = 2732.21 - (-66.77*38.05) = 5272.71867
ŷ = -66.76757X + 5272.71867
b. Solution
Correlation Coefficient ( r ) = N x ∑ XY −(∑ X )(∑Y )
√ N x ¿ ¿
Correlation Coefficient ( r ) =
16 ⋅1598383.42−608.8⋅ 43715.4
√ (16 ⋅24138.18−16 ⋅24138.182 )∗16 ⋅ 127198081.72−43715.42 =-0.74785
Coefficient of Determination ( r2 ) = r x r.
Inputting the values obtained from d above:
Correlation Coefficient ( r ) =-0.74785
Hence:
Coefficient of Determination =0.55928
c. Solution
Correlation Coefficient ( r ) = N x ∑ XY −(∑ X )(∑Y )
√ N x ¿ ¿
Correlation Coefficient ( r ) =
16 ⋅1598383.42−608.8⋅ 43715.4
√ (16 ⋅24138.18−16 ⋅24138.182 )∗16 ⋅ 127198081.72−43715.42
Correlation Coefficient ( r ) =-0.74785
d.
ŷ = -66.76757X + 5272.71867
Given the equation above, we can deduce that for every increase in percentage of adults
with a post-secondary degree, the rate of crime decreases by approximately 66.76757
hence the crime rate is 5205.95 for a 1% of adults with post-secondary degrees
Paraphrase This Document
Need a fresh take? Get an instant paraphrase of this document with our AI Paraphraser

e.
Yes, using a multiple regression would be useful in further analysis since it would help in
understanding the relationship between the response variable and several other predictor
variables instead of a single predictor variable
Q U E S T I O N 2
1. Solution
Let p be the estimated probability of obtaining heads and r the maximum error which is
defined by |p-r| where p: we let h be the number of heads and t the number of tails then
p= h
h+t
32
50=0.64
Now using Z-tables, the value of z corresponding to 95% confidence interval is 1.960.
Now calculating the error:
E= Z
2 √n = 1.96
2 √ 50 =0.1386
Hence:
0.5014<r<0.7786 which closes out on 0.5 hence we can conclude with a 95% confidence
that the coin is biased.
Q U E S T I O N 3
1. Consider the following:
o Chi Square
o Coefficient of determination
o Cramer’s V
o Gamma
o Kendall’s tau-b
o Pearson’s correlation coefficient
o t test
b. Solution
In statistics, tests of statistical significance are used to calculate the probability that, “…a
relationship observed in the data occurred only by chance; the probability that the
variables are really unrelated in the population” (Devore, 2011) while, measures of
association, “..provide a means of summarizing the size of the
association between two variables” (Mahdavi Damghani, 2012)
c.
According to (Göktaş & İşçi, 2011), a PRE Test (Proportional Reduction in Error) is, a
statistical criterion used to quantify the extent to which having knowledge on a given
variable can aid in the prediction of another variable.”
d. Examples of PRE measures are: Cramer’s V and Gamma

e. An asymmetrical measure of association is, a measure whose value is likely to vary depending
on the variable that is to be considered as independent variable and which the dependent
variable.
f. Kendall's tau-b,
g. Measures of associations are often useful when measuring a linear relationship however, when
there is no direct hypothesis linking one attribute to the other, a measure of association can still
be used to determine if the attributes are associated (Cox, 2011).
h. Yes, it is possible to have a significant relationship between attributes albeit having weak
association since despite a weak association, it is possible to find a causal relationship (Filho,
2013).
i. Yes, it is possible.
j. A measure of association is generally used to examine the degree to which two variables are
associated. However, it is possible that there is an association with no causality between the two
variables in such cases, the test of significance might not be appropriate.
Further, it is possible to have a statistically significant relationship but a weak association
or a strong association between variables but no statistical significance since, correlation
is influenced by sample size while statistical tests are not.
For example, there might be an association between Ice cream sales and sunglasses sold
but a statistical test might reveal that the sale of ice cream has no statistical influence on
the sale of sunglasses.
Q U E S T I O N 4
Solution
Sample 1 Sample 2 Difference
Sample
proportion 0.61 0.47 0.14
95% CI
(asymptotic) 0.5548 - 0.6652 0.4081 -
0.5319
0.0564 -
0.2236
z-value 3.3
P-value 0.001
Interpretation
Statistically
significant,
reject null
hypothesis that
sample proportions
are equal
n by pi n * pi >5, test ok
⊘ This is a preview!⊘
Do you want full access?
Subscribe today to unlock all pages.

Trusted by 1+ million students worldwide

From the results in the table above, we reject the null hypothesis and conclude that there
is a difference between whites and African Americans who have a positive attitude
towards the police
Solution
Using a normal population to the binomial calculation, we obtain:
Proportion of positive results = P = x/N = 0.610
Lower bound = P - (Zα*SEM) = 0.555
Upper bound = P + (Zα*SEM) = 0.665
Hence, the confidence interval for the proportion of Whites who have a positive attitude
towards the police is: 0.555≤x≤0.665
Solution
Hence, the confidence interval for the proportion of Whites who have a positive attitude
towards the police is: 0.555≤x≤0.665
Proportion of positive results = P = x/N = 0.472
Lower bound = P - (Zα*SEM) = 0.410
Upper bound = P + (Zα*SEM) = 0.534
Hence, the confidence interval for the proportion of Blacks who have a positive attitude
towards the police is: 0.410≤x≤0.534
References
Cox, D. (2011). The role of significance tests in hypothesis testing. Statistical analysis, 23-44.
Devore, J. L. (2011). Probability and Statistics for Engineering and the Sciences . Boston: MA.
Filho, D. F. (2013). When is statistical significance not significant? SciElo, 54-57.
Göktaş, A., & İşçi, Ö. (2011). A Comparison of the Most Commonly Used Measures of
Association for Doubly Ordered Square Contingency Tables via Simulation. Metodološki
zvezki, 8(1), 17-37.
Mahdavi Damghani, B. (2012). The Misleading Value of Measured Correlation. Wilmott., 64–73.
1 out of 4
Related Documents
Your All-in-One AI-Powered Toolkit for Academic Success.
+13062052269
info@desklib.com
Available 24*7 on WhatsApp / Email
Unlock your academic potential
Copyright © 2020–2026 A2Z Services. All Rights Reserved. Developed and managed by ZUCOL.


