Crime Data Analysis and Prevention Methods: ITD101 Assignment 1
VerifiedAdded on  2023/01/20
|10
|1499
|98
Project
AI Summary
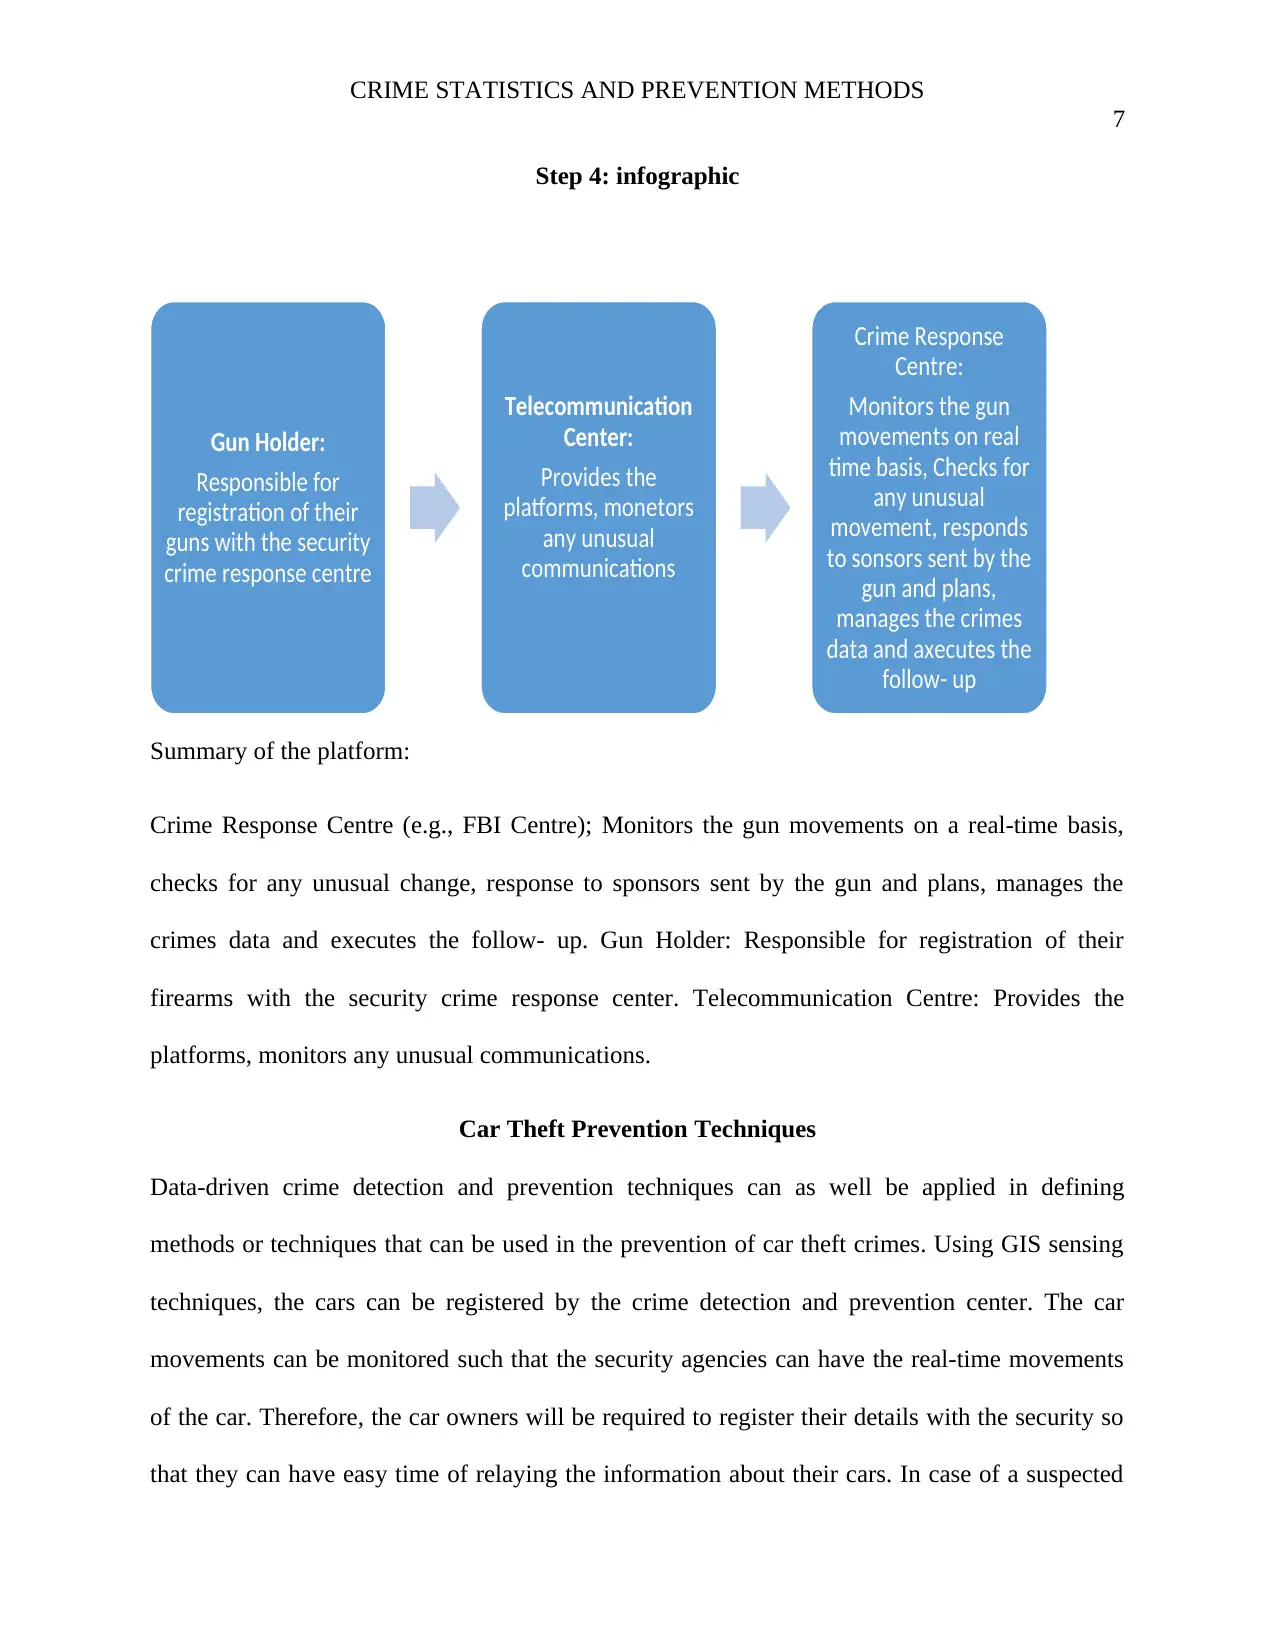
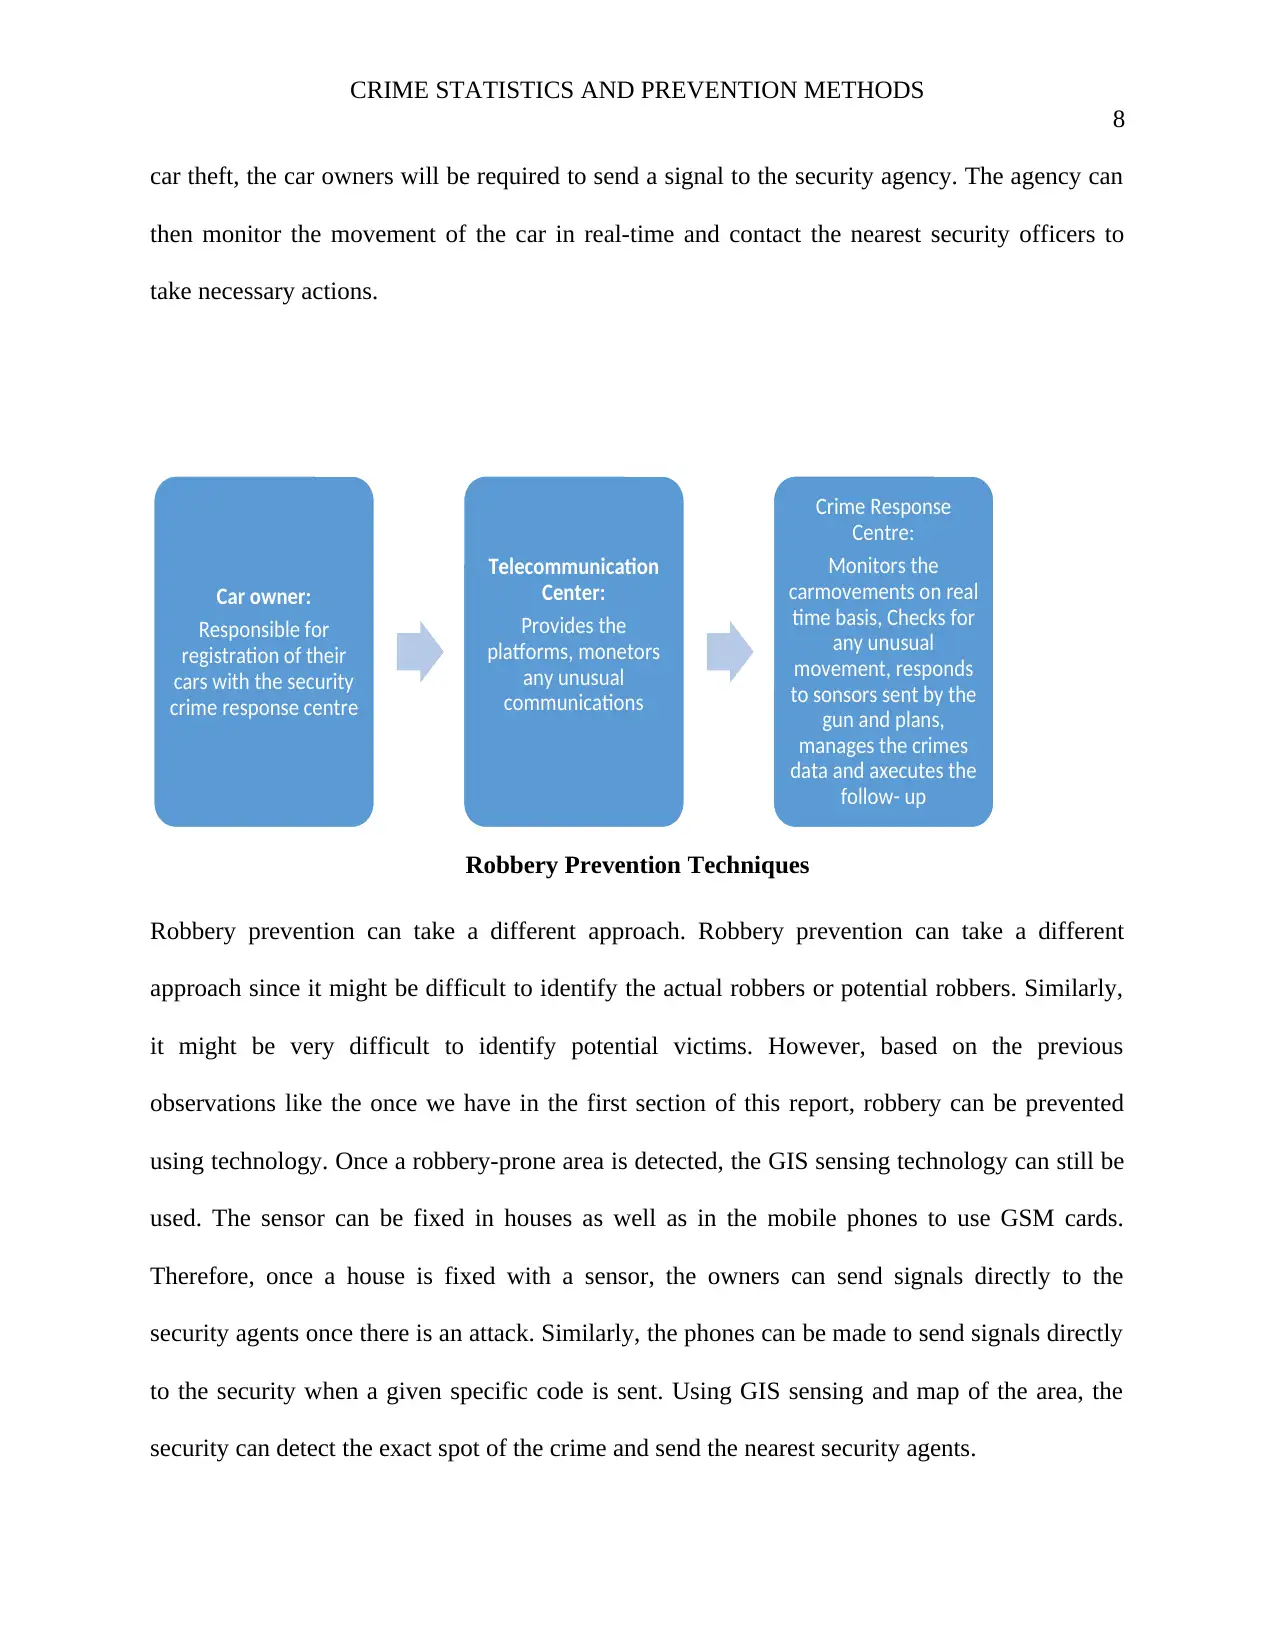
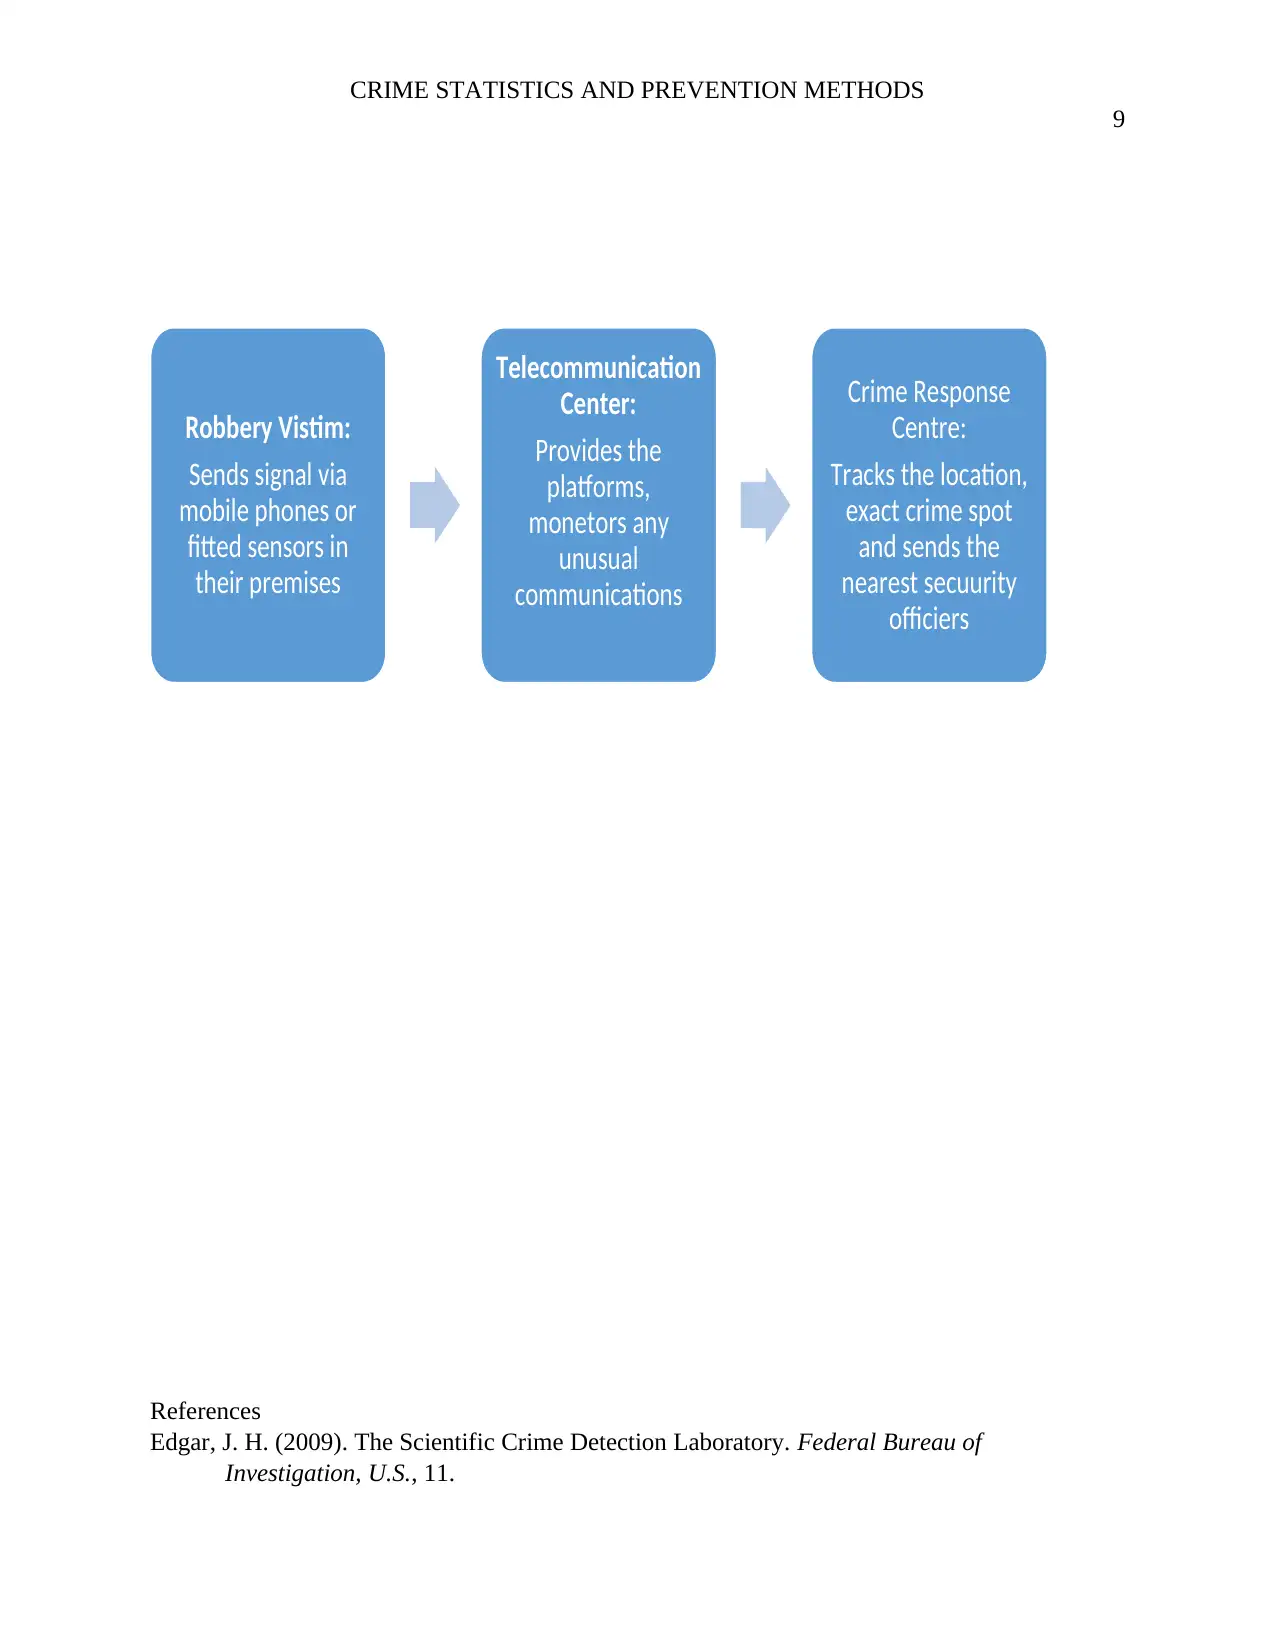
This assignment presents an infographic analyzing crime statistics across multiple cities using various data visualization techniques like line graphs, scatter plots, and 3D maps. The analysis reveals trends in theft, robbery, assault, and burglary, comparing crime rates across different locations. The assignment then proposes an innovative computer-based crime prevention technique, emphasizing a data-driven approach. This technique involves registering firearms and cars into a central database, utilizing remote sensing and GIS techniques to monitor their movements and detect unusual activities. The proposed system aims to provide real-time crime detection, enabling prompt responses from security agencies. The infographic summarizes the platform, outlining roles and responsibilities for gun holders, telecommunication centers, and crime response centers. The assignment also suggests techniques for car theft and robbery prevention, highlighting the use of sensors and mobile phone-based signaling to alert security agencies, thereby aiming to improve public safety through technology.

Running Head: CRIME STATISTICS AND PREVENTION METHODS
1
INFOGRAPHIC ABOUT CRIME STATISTICS AND PREVENTION METHODS USING
TECHNOLOGY
ITD101 Semester 1, 2019
Assignment 1
Students Name:
Institutions Name:
1
INFOGRAPHIC ABOUT CRIME STATISTICS AND PREVENTION METHODS USING
TECHNOLOGY
ITD101 Semester 1, 2019
Assignment 1
Students Name:
Institutions Name:
Secure Best Marks with AI Grader
Need help grading? Try our AI Grader for instant feedback on your assignments.

CRIME STATISTICS AND PREVENTION METHODS
2
Step 1: Interesting and creative ways to display this data using data visualization
techniques
Crime Analysis 1: A line Graph
2014
2015
2016
2017
2014
2015
2016
2017
SEATTLE,
WASHINGTO
N
SIMI VALLEY,
CALIFORNIA
0
2000
4000
6000
8000
10000
12000
14000
16000
18000
Sum of Assault
Linear (Sum of Assault)
Sum of Robbery
Sum of Burglary
Sum of Theft
Year/City
crime

CRIME STATISTICS AND PREVENTION METHODS
3
Crime Analysis 2: Scatter Plot
2013.5 2014 2014.5 2015 2015.5 2016 2016.5 2017 2017.5
0
200
400
600
800
1,000
1,200
1,400
A Scatterof Robbery and Assult
Robbery Linear (Robbery)
Assault Linear (Assault)
Axis Title
Axis Title
3
Crime Analysis 2: Scatter Plot
2013.5 2014 2014.5 2015 2015.5 2016 2016.5 2017 2017.5
0
200
400
600
800
1,000
1,200
1,400
A Scatterof Robbery and Assult
Robbery Linear (Robbery)
Assault Linear (Assault)
Axis Title
Axis Title

CRIME STATISTICS AND PREVENTION METHODS
4
Analysis 3: 3D Map
Step2: Explanation of the Data portrayed
The line graph demonstrates that the crime that is highly practiced across the cities is theft.
Burglary is the second highest practiced crime. A comparison of theft and burglary revealed that
theft is more rampant than burglary across the cities. Therefore, we can say that the level of theft
is higher than that of burglary because some burglary cases involve theft while others do not.
The line graph also provides a comparison of two cities, Washinton and Carlilfornia. The line
graph reveales that the frequency of crimes (both burglary and theft) are higher in Washinton
Secure Best Marks with AI Grader
Need help grading? Try our AI Grader for instant feedback on your assignments.

CRIME STATISTICS AND PREVENTION METHODS
5
than in Carlifornia. Therefore, the data demonstrates that it might be safer to be in Washington
than in carlifornia.
The scatter plot provides a comparison of robbery and assault across the cities over the years.
The scatter reveals that there is a general trend of increase in the number of robbery and assult
across the years across the cities. For all the years, the cases of assault are higher than the cases
of robbery. Therefore, we could conclude that the major crime is assault but some come in hand
with robbery. Thus, to reduce the instances of the crimes, it is better to focus on minimizing the
cases of assault.
The 3D map provides a comparison of all the crimes across all the cities. Along with the map, a
bar graph and pie charts have been generated. The map demonstrates that the city with the
combined highest crime rate is Washington followed by Virginia. On the other hand, the safest
city with the least instances of all forms of crimes is California. Similar, the highest practiced
crimes are assault and burglary. On the other hand, the least practiced crimes are theft and
robbery.
Step 3: a new and innovative computer-based crime prevention technique for the crimes
Crime detection and prevention in the modern world can best achieve through data-driven action
(Edgar, 2009). Data-driven methods of crime detection can work in the modern days due to the
huge amounts of data that is available as well as the presence of super computers that are capable
of handling complex tasks. The study by (Prabakaran & Mitra, 2018) further points out that data
mining is an important area that can revolutionize several fields such as healthcare, agriculture,
market basket analysis, education, manufacturing, engineering, and crime investigations.

CRIME STATISTICS AND PREVENTION METHODS
6
Therefore, the new computer-based crime prevention technique for crimes that I will suggest is
based on crime data (data-driven crime prevention technique).
The best innovative way to prevent crimes through technology is by first identifying the hotspots
of crimes as we have done i.e. in Washington. Secondly, two approaches can be taken: One,
register all the guns into a central database and monitor their movements through programming
and remote sensing technique. Therefore, the security will be able to know and trace all the gun
movements, and they can as well track the gun holders in real time. Using remote sensing, the
guns should be programmed in such a way that anytime a trigger is pulled; a signal is sent to the
security immediately. The security can then take action by visiting the place immediately or first
contacting the gun holder via a phone. Two, the guns can be programmed in such a way that
anytime a trigger is pulled, a message is sent to the security agencies for record and follow- up
purposes. Therefore, the security will be at a point of knowing real-time hot- spots of crime and
necessary actions can be taken without relying on data of past years.

CRIME STATISTICS AND PREVENTION METHODS
7
Step 4: infographic
Summary of the platform:
Crime Response Centre (e.g., FBI Centre); Monitors the gun movements on a real-time basis,
checks for any unusual change, response to sponsors sent by the gun and plans, manages the
crimes data and executes the follow- up. Gun Holder: Responsible for registration of their
firearms with the security crime response center. Telecommunication Centre: Provides the
platforms, monitors any unusual communications.
Car Theft Prevention Techniques
Data-driven crime detection and prevention techniques can as well be applied in defining
methods or techniques that can be used in the prevention of car theft crimes. Using GIS sensing
techniques, the cars can be registered by the crime detection and prevention center. The car
movements can be monitored such that the security agencies can have the real-time movements
of the car. Therefore, the car owners will be required to register their details with the security so
that they can have easy time of relaying the information about their cars. In case of a suspected
Gun Holder:
Responsible for
registration of their
guns with the security
crime response centre
Telecommunication
Center:
Provides the
platforms, monetors
any unusual
communications
Crime Response
Centre:
Monitors the gun
movements on real
time basis, Checks for
any unusual
movement, responds
to sonsors sent by the
gun and plans,
manages the crimes
data and axecutes the
follow- up
Paraphrase This Document
Need a fresh take? Get an instant paraphrase of this document with our AI Paraphraser

CRIME STATISTICS AND PREVENTION METHODS
8
car theft, the car owners will be required to send a signal to the security agency. The agency can
then monitor the movement of the car in real-time and contact the nearest security officers to
take necessary actions.
Robbery Prevention Techniques
Robbery prevention can take a different approach. Robbery prevention can take a different
approach since it might be difficult to identify the actual robbers or potential robbers. Similarly,
it might be very difficult to identify potential victims. However, based on the previous
observations like the once we have in the first section of this report, robbery can be prevented
using technology. Once a robbery-prone area is detected, the GIS sensing technology can still be
used. The sensor can be fixed in houses as well as in the mobile phones to use GSM cards.
Therefore, once a house is fixed with a sensor, the owners can send signals directly to the
security agents once there is an attack. Similarly, the phones can be made to send signals directly
to the security when a given specific code is sent. Using GIS sensing and map of the area, the
security can detect the exact spot of the crime and send the nearest security agents.
Car owner:
Responsible for
registration of their
cars with the security
crime response centre
Telecommunication
Center:
Provides the
platforms, monetors
any unusual
communications
Crime Response
Centre:
Monitors the
carmovements on real
time basis, Checks for
any unusual
movement, responds
to sonsors sent by the
gun and plans,
manages the crimes
data and axecutes the
follow- up

CRIME STATISTICS AND PREVENTION METHODS
9
References
Edgar, J. H. (2009). The Scientific Crime Detection Laboratory. Federal Bureau of
Investigation, U.S., 11.
Robbery Vistim:
Sends signal via
mobile phones or
fitted sensors in
their premises
Telecommunication
Center:
Provides the
platforms,
monetors any
unusual
communications
Crime Response
Centre:
Tracks the location,
exact crime spot
and sends the
nearest secuurity
officiers

CRIME STATISTICS AND PREVENTION METHODS
10
Prabakaran, S., & Mitra, S. (2018). Survey of Analysis of Crime Detection Techniques Using
Data Mining and Machine Learning. Journal of Physics, 1-5.
10
Prabakaran, S., & Mitra, S. (2018). Survey of Analysis of Crime Detection Techniques Using
Data Mining and Machine Learning. Journal of Physics, 1-5.
1 out of 10

Your All-in-One AI-Powered Toolkit for Academic Success.
 +13062052269
info@desklib.com
Available 24*7 on WhatsApp / Email
Unlock your academic potential
© 2024  |  Zucol Services PVT LTD  |  All rights reserved.