Predicting Credit Card Balance: A CRISP-DM Data Mining Approach

Verified

Added on  2023/05/30

|19
|984
|153
Project
AI Summary
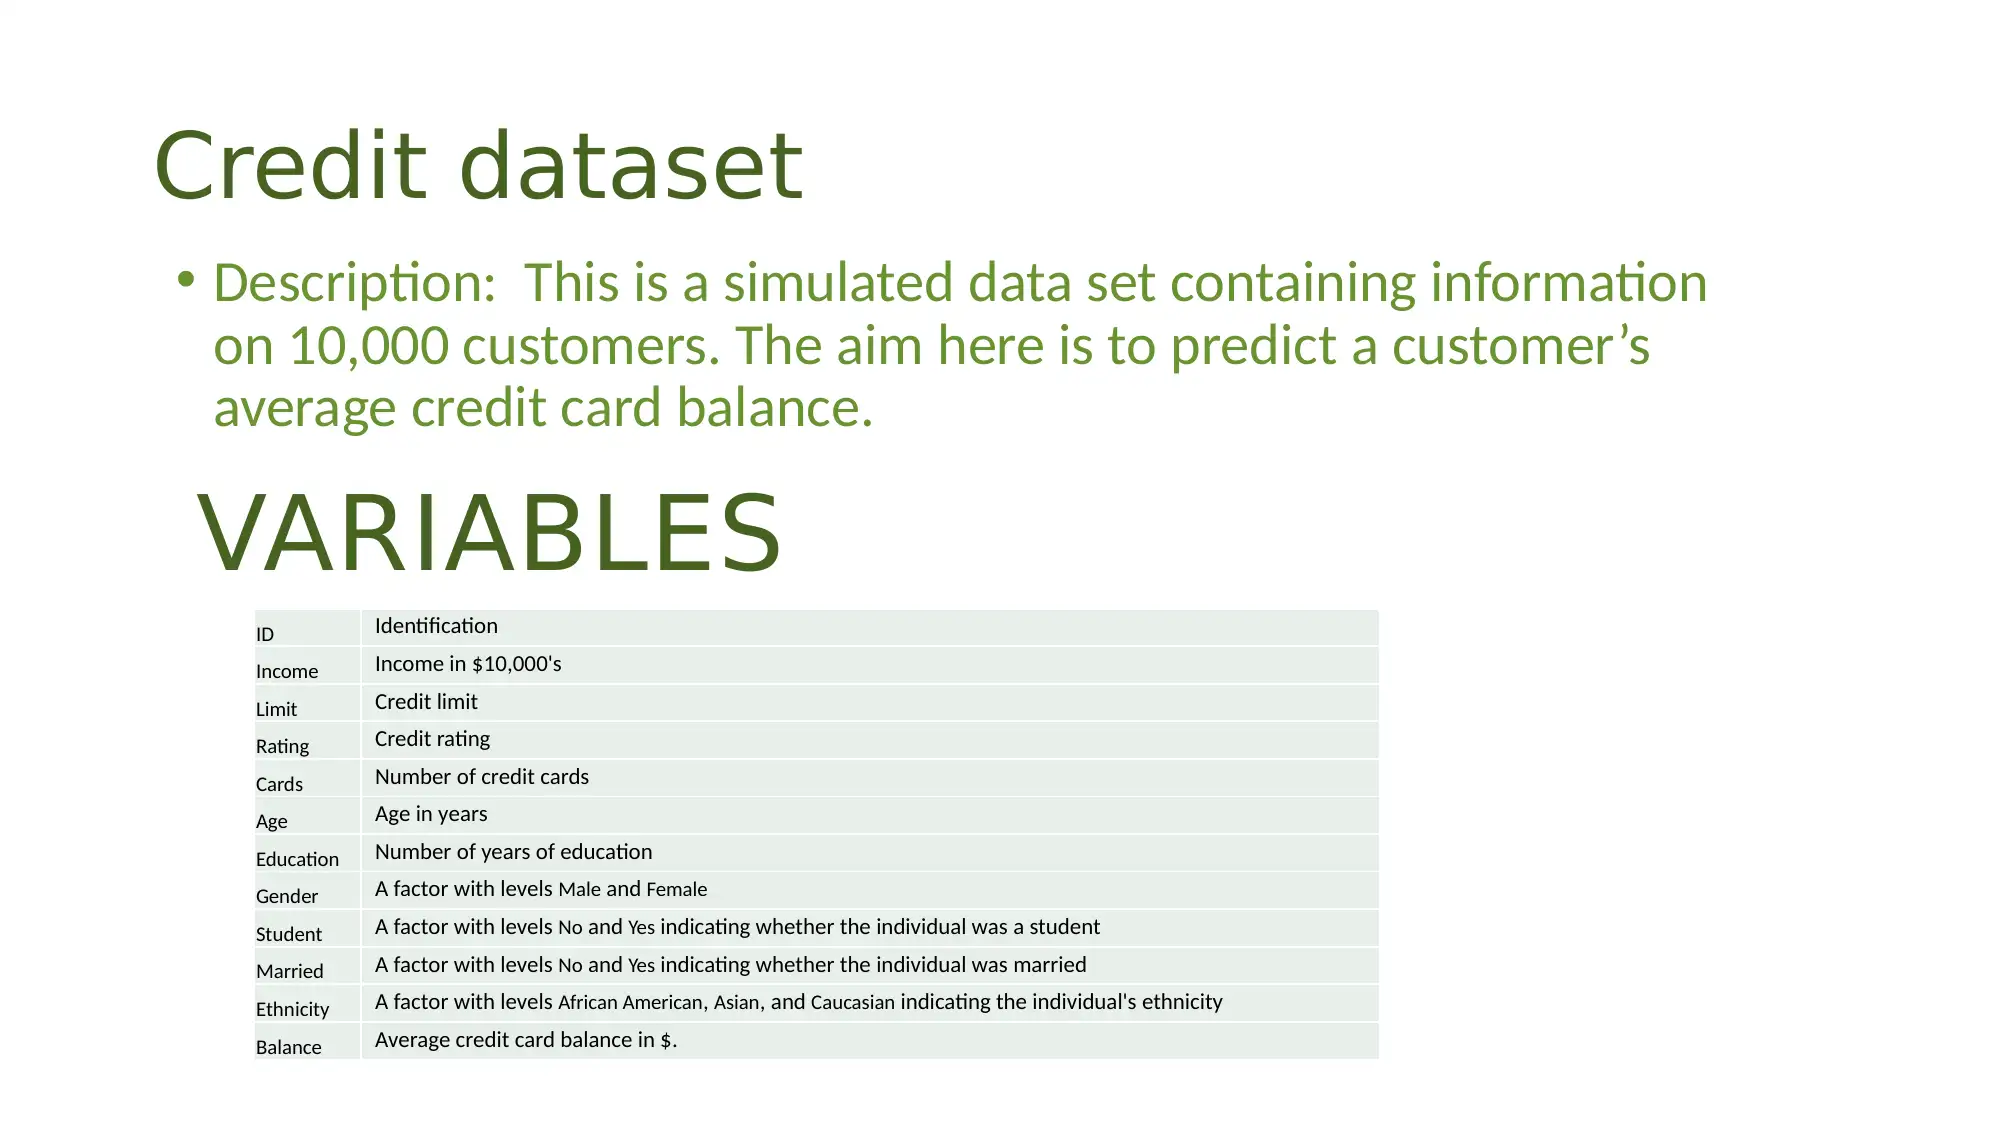
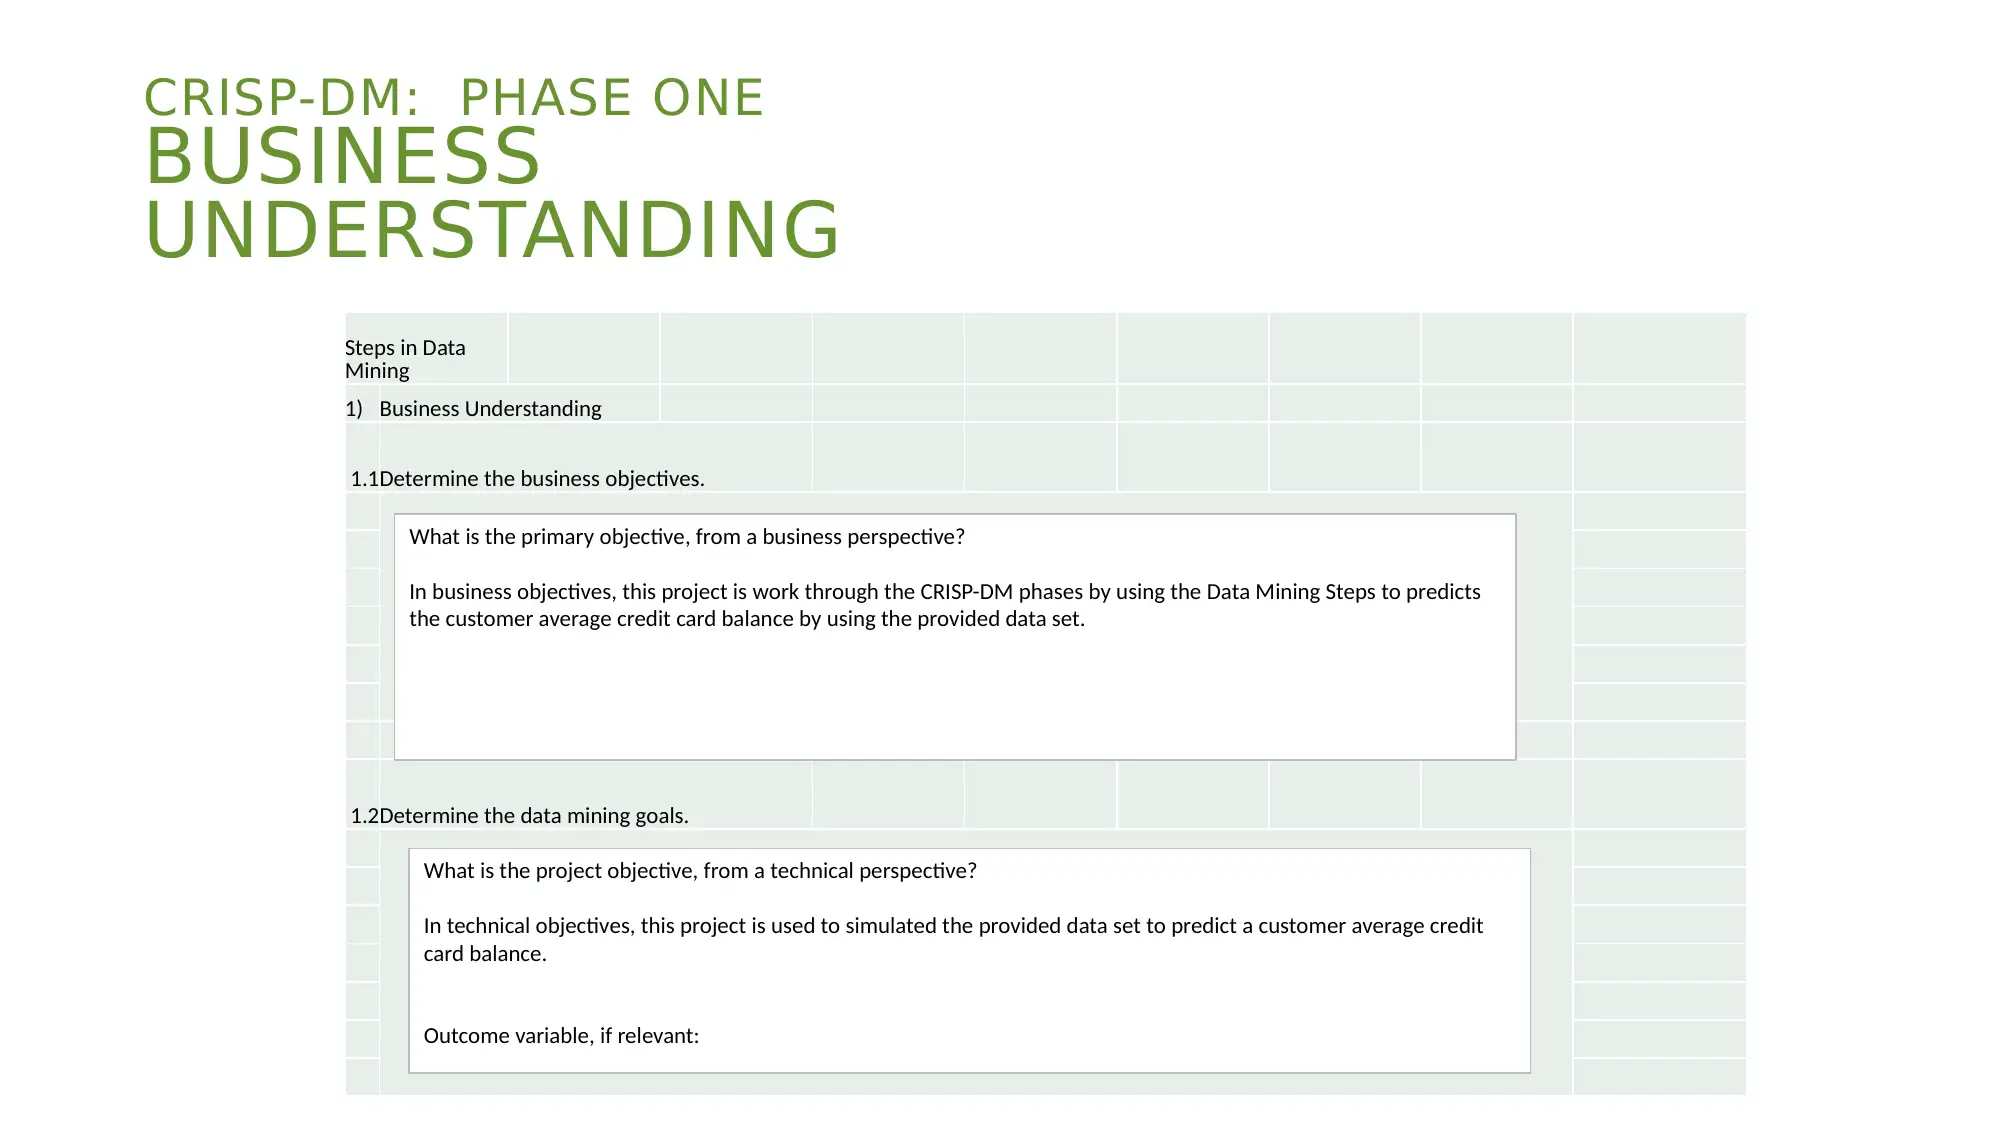
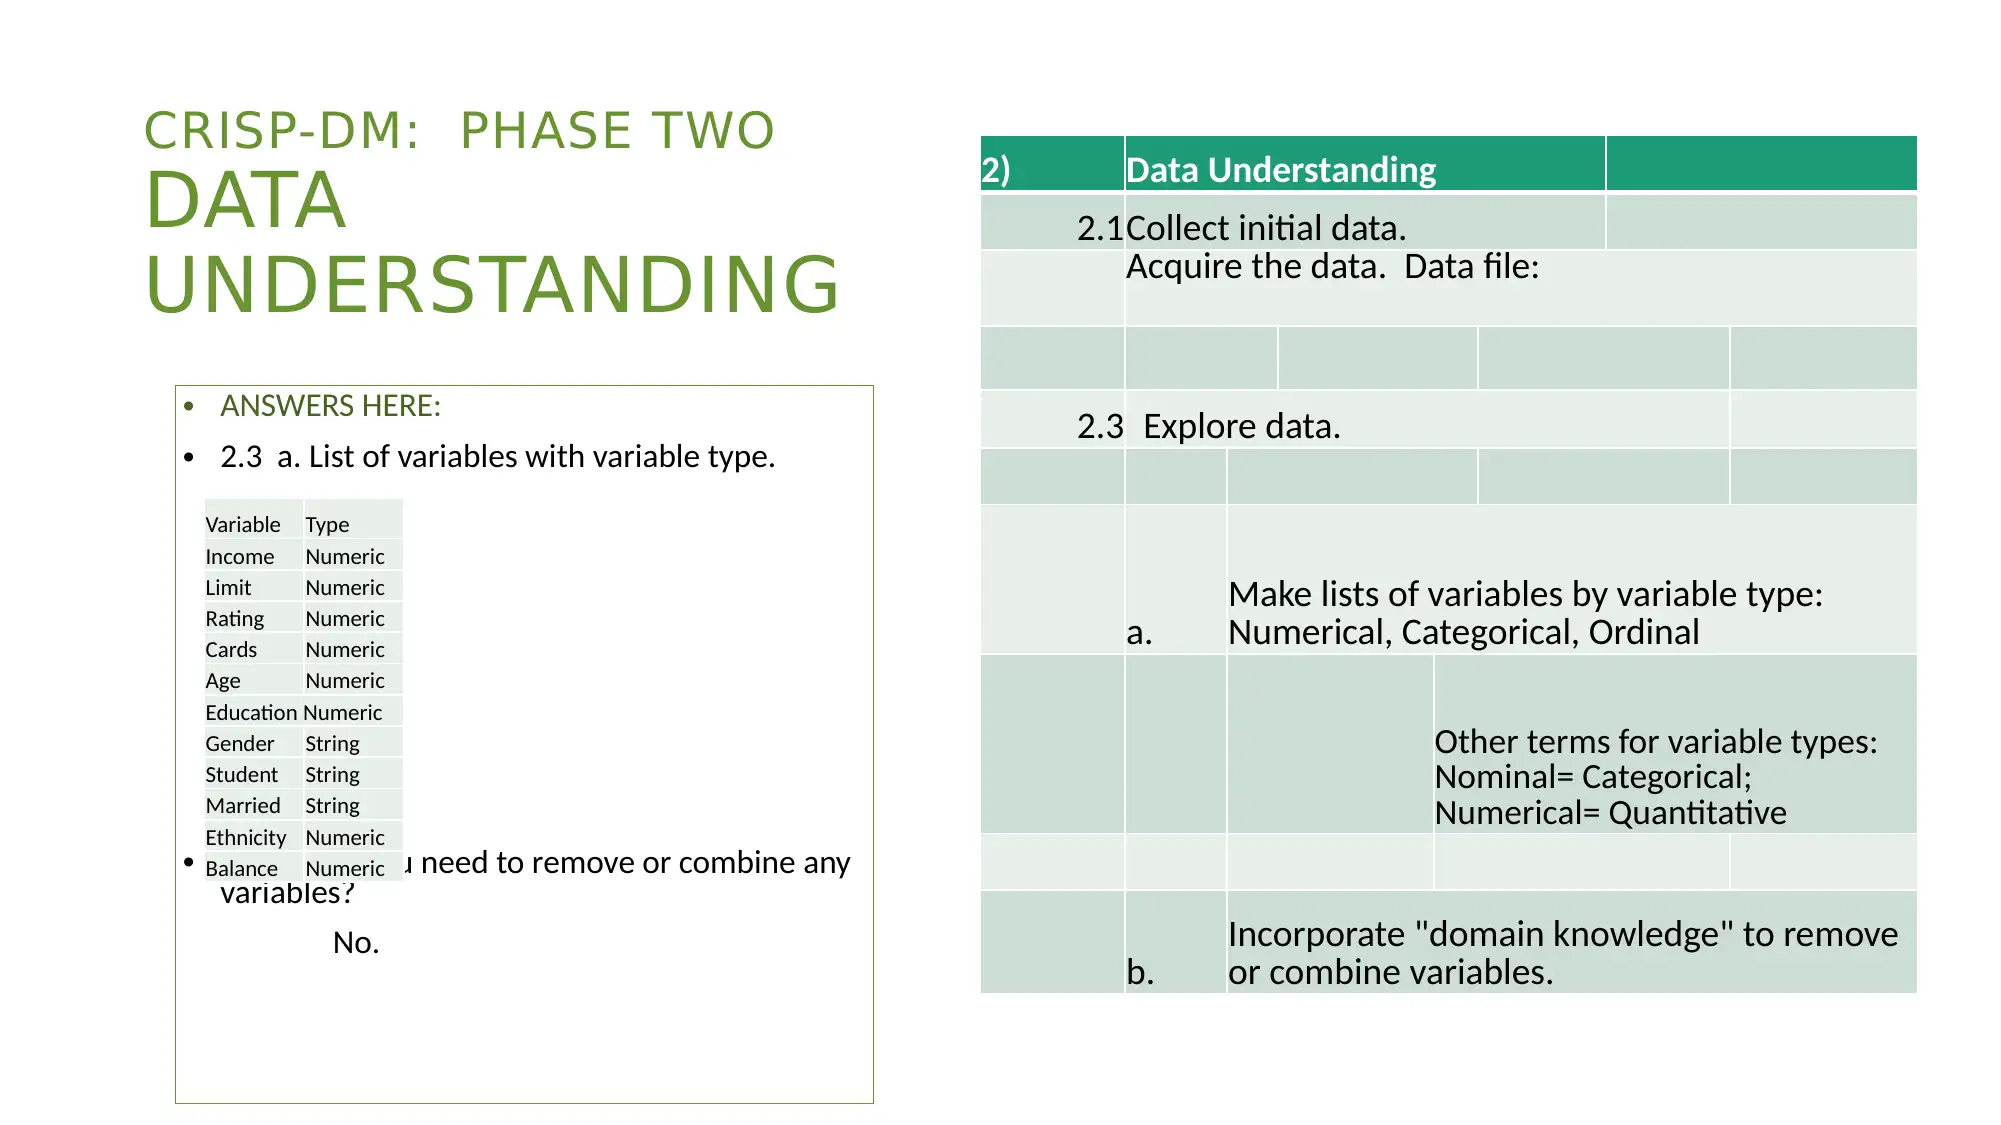
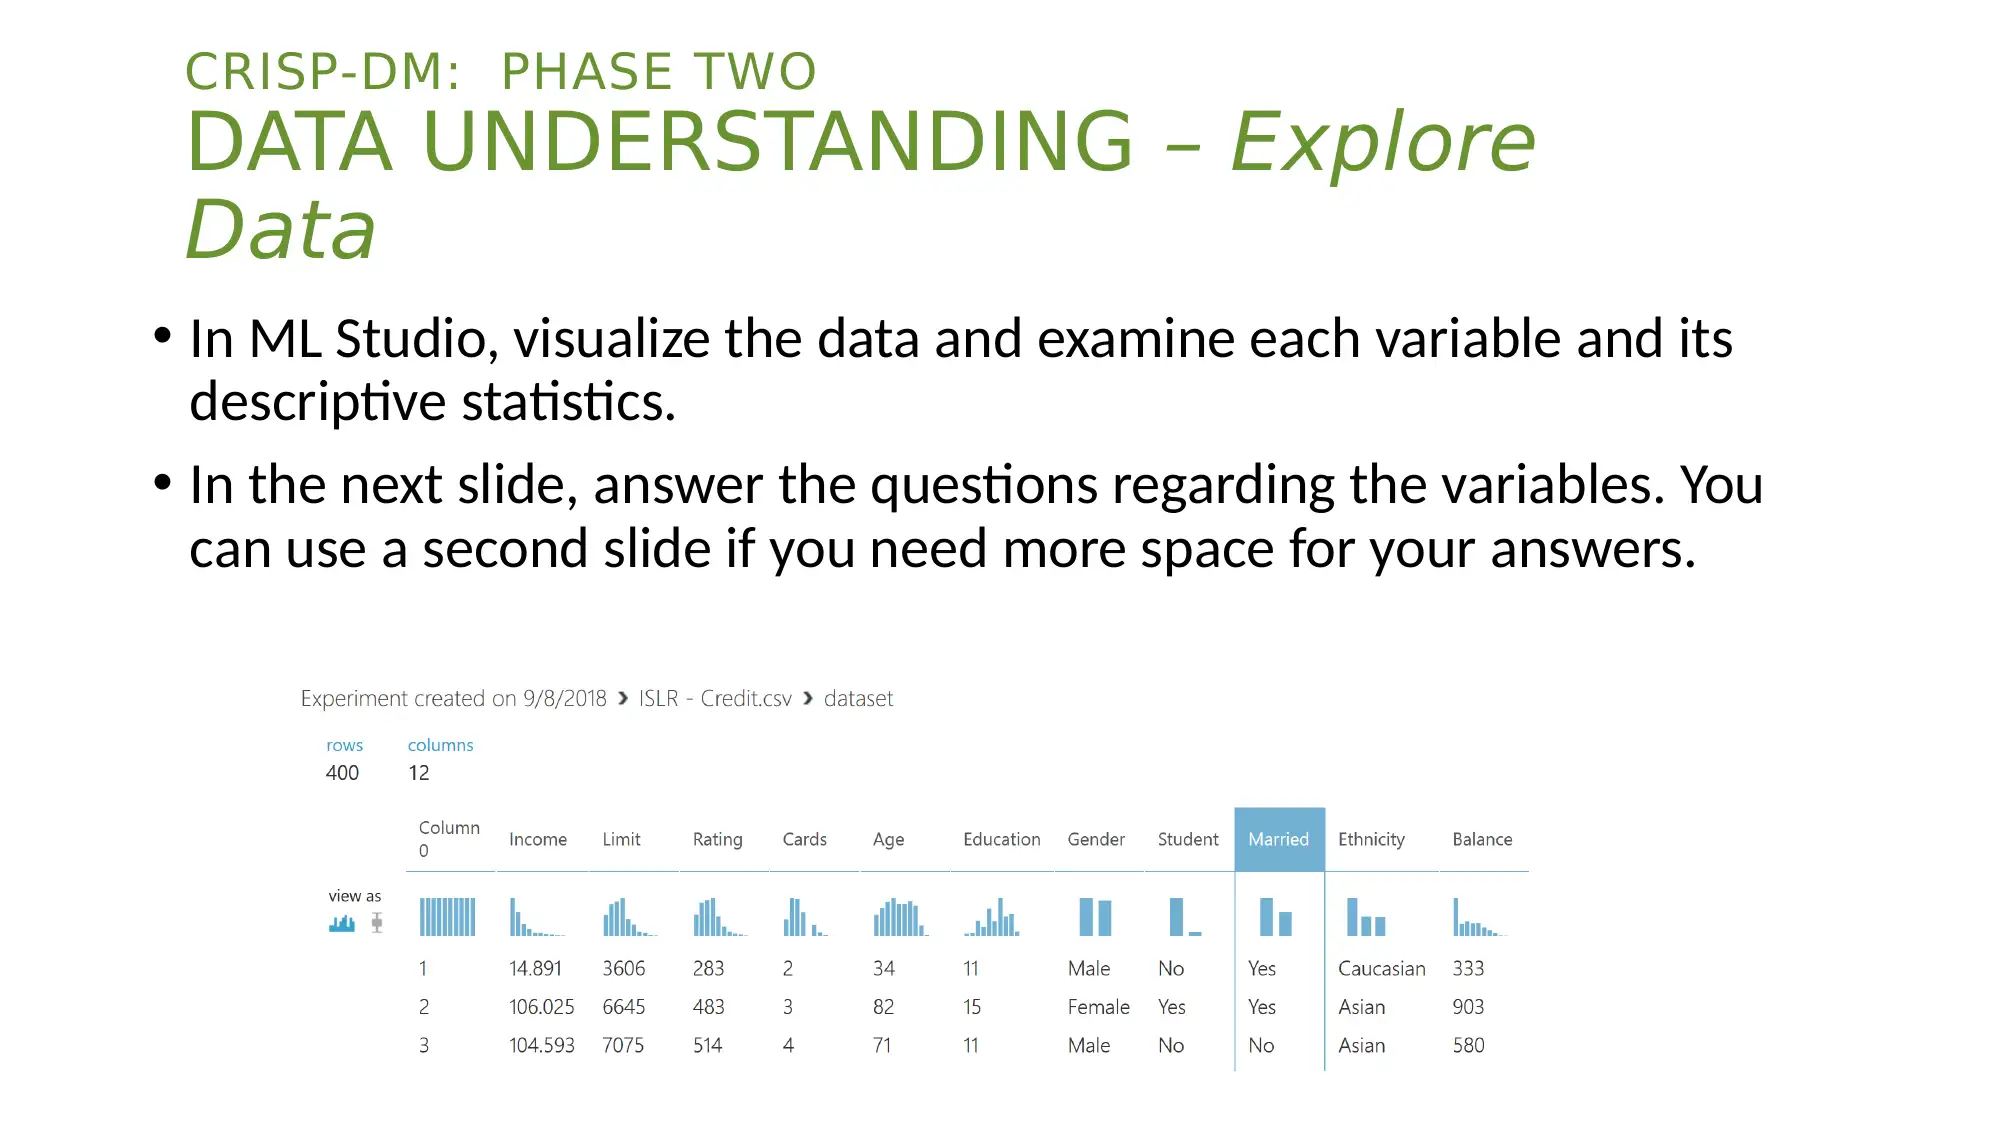
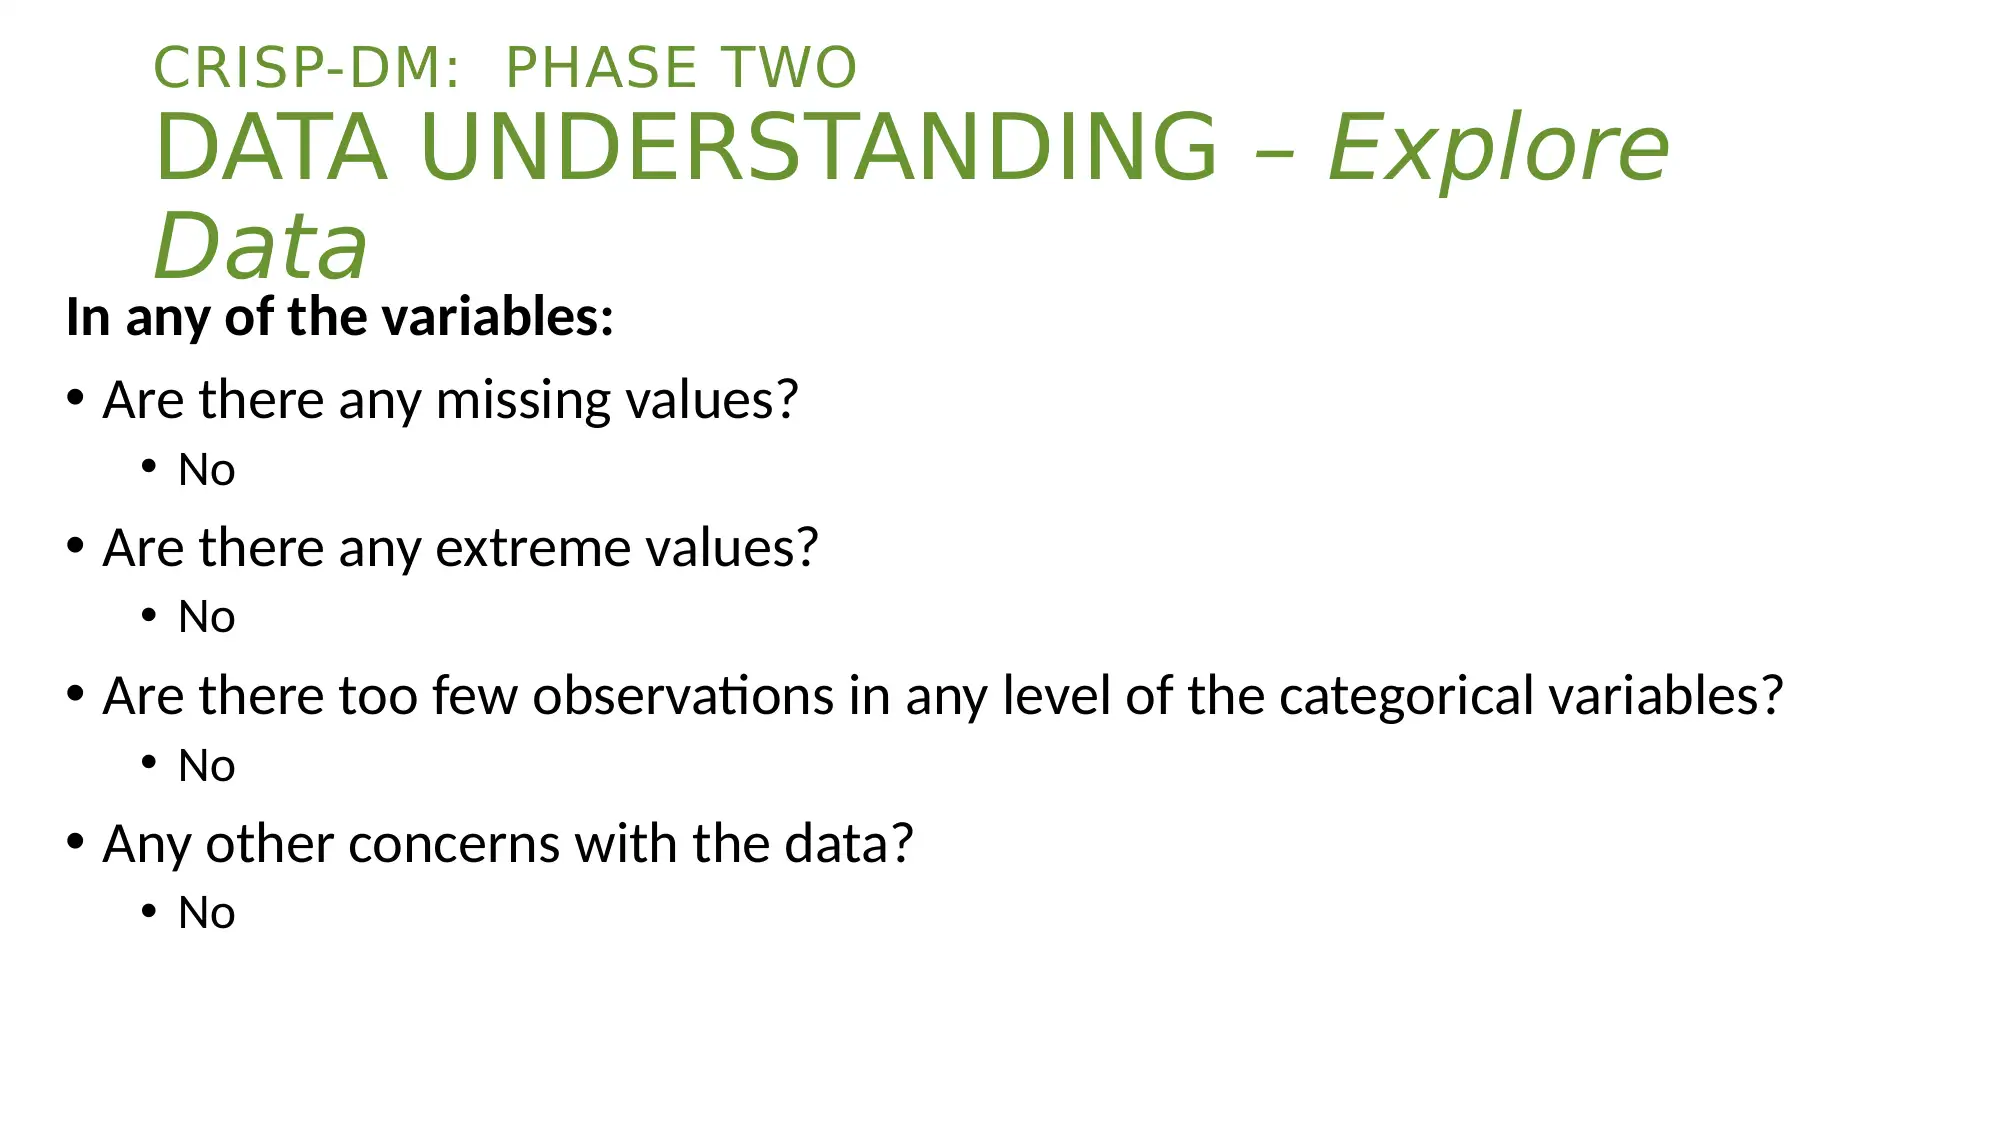
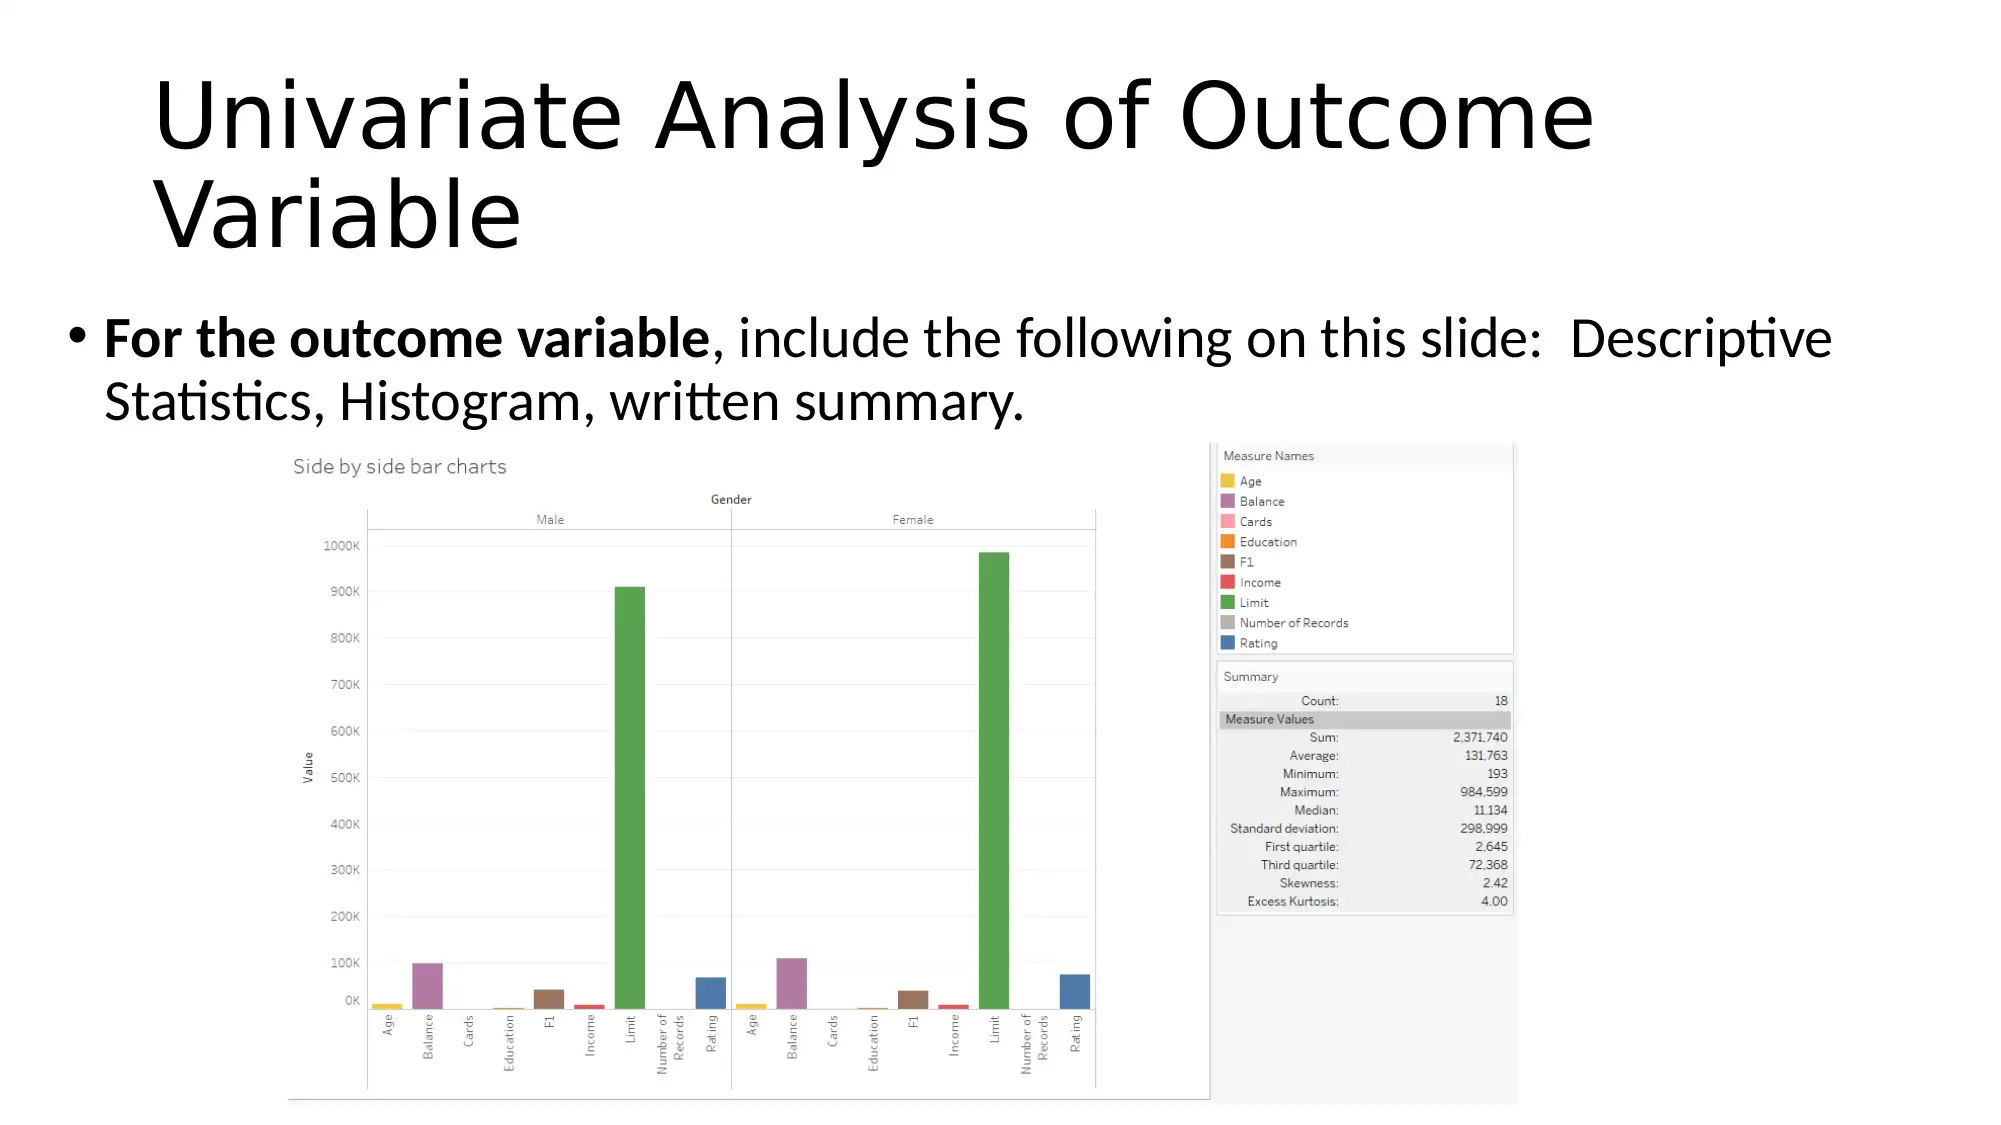
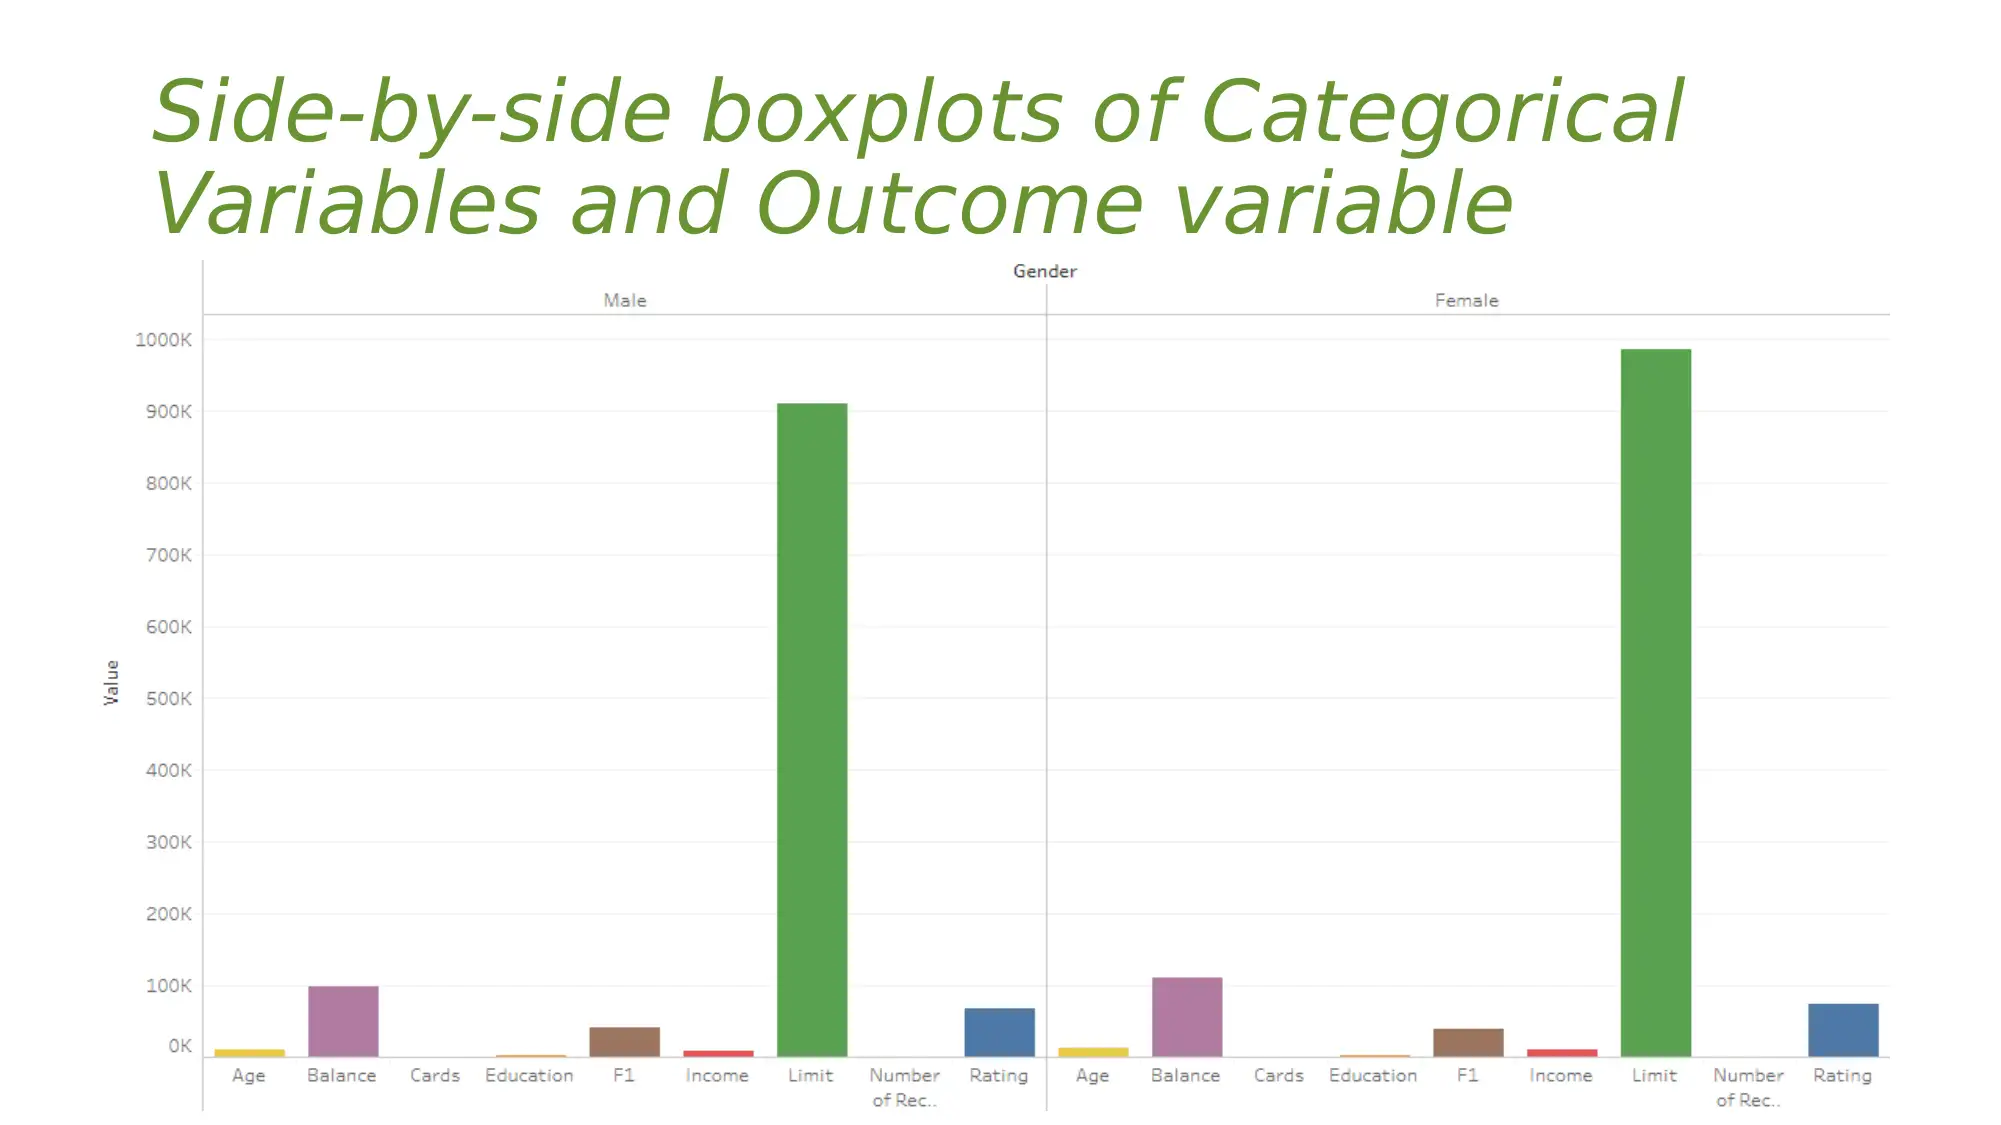
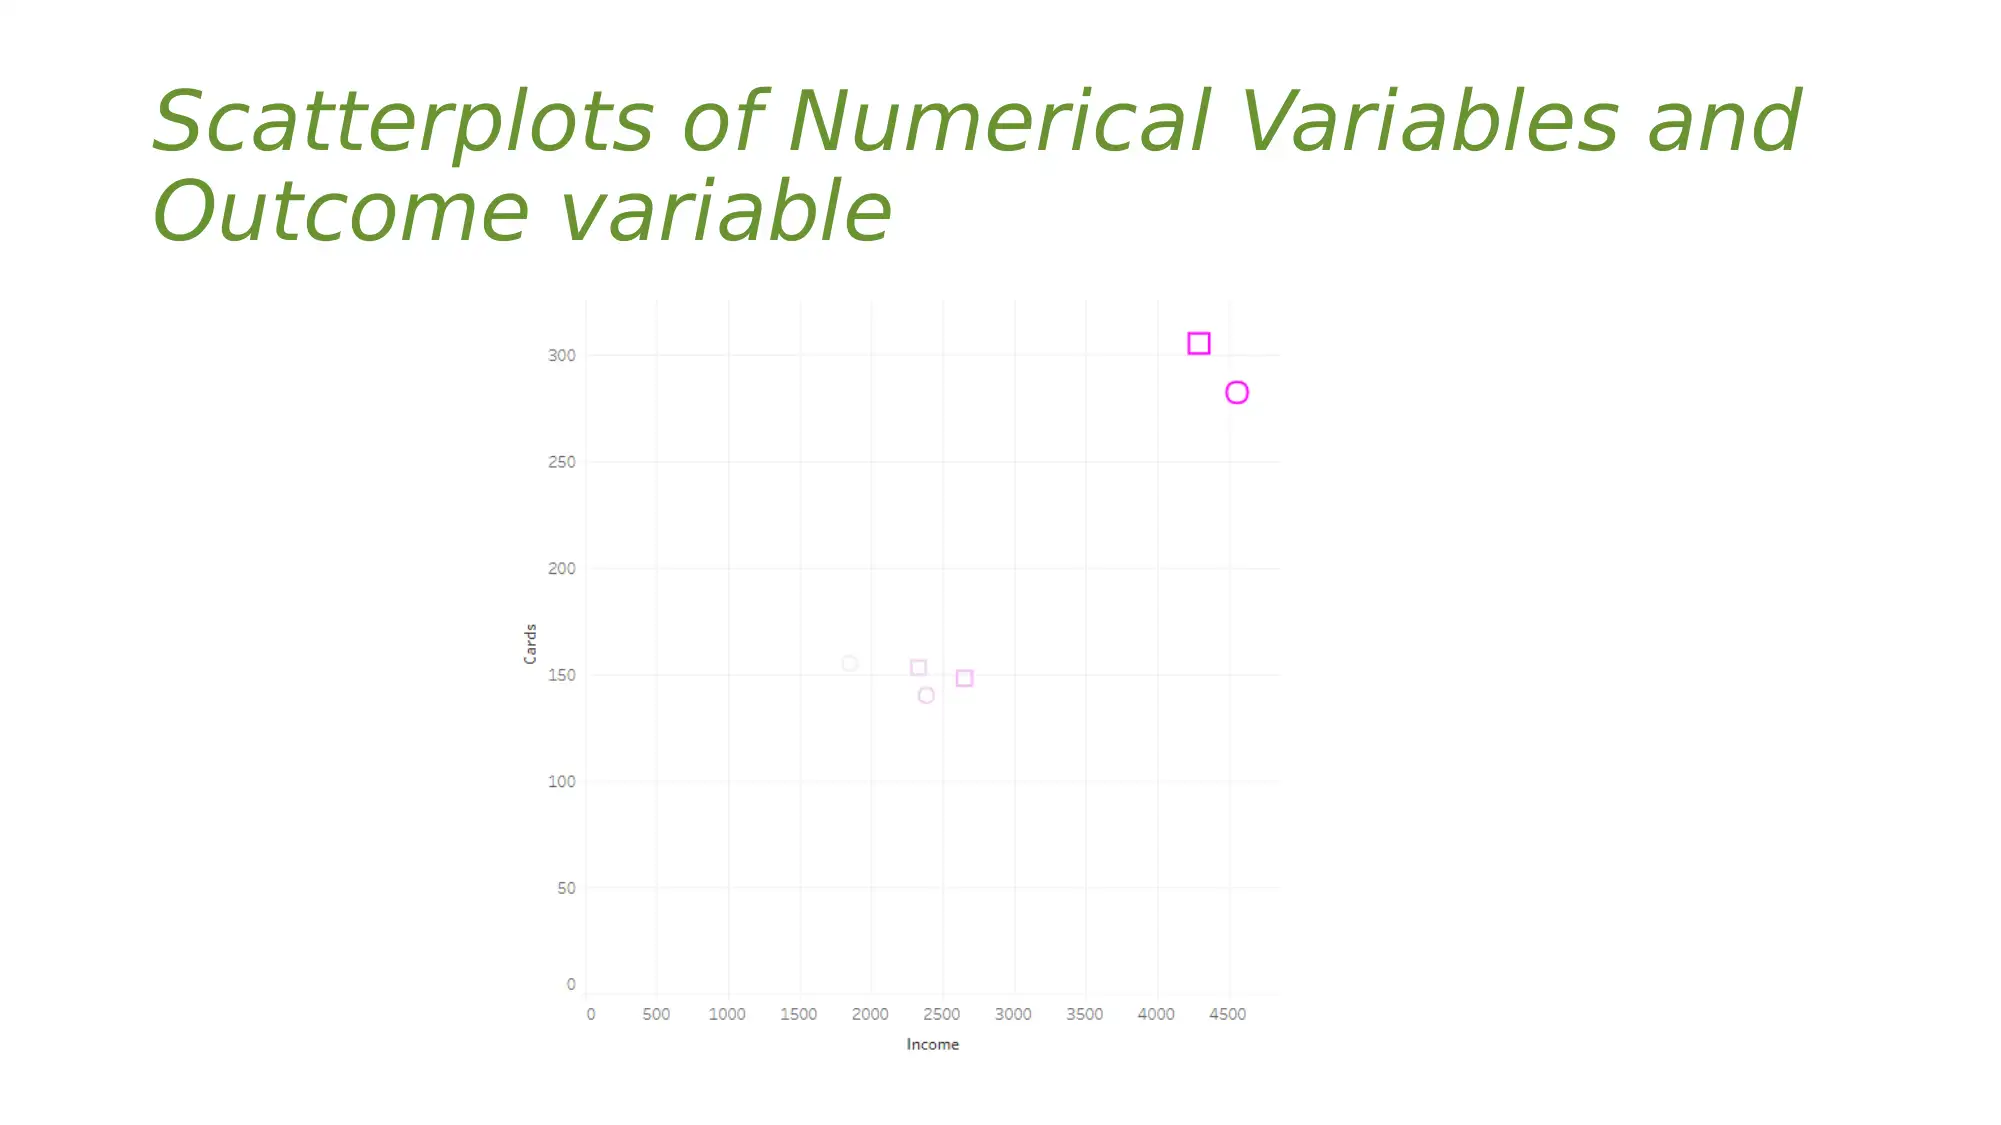
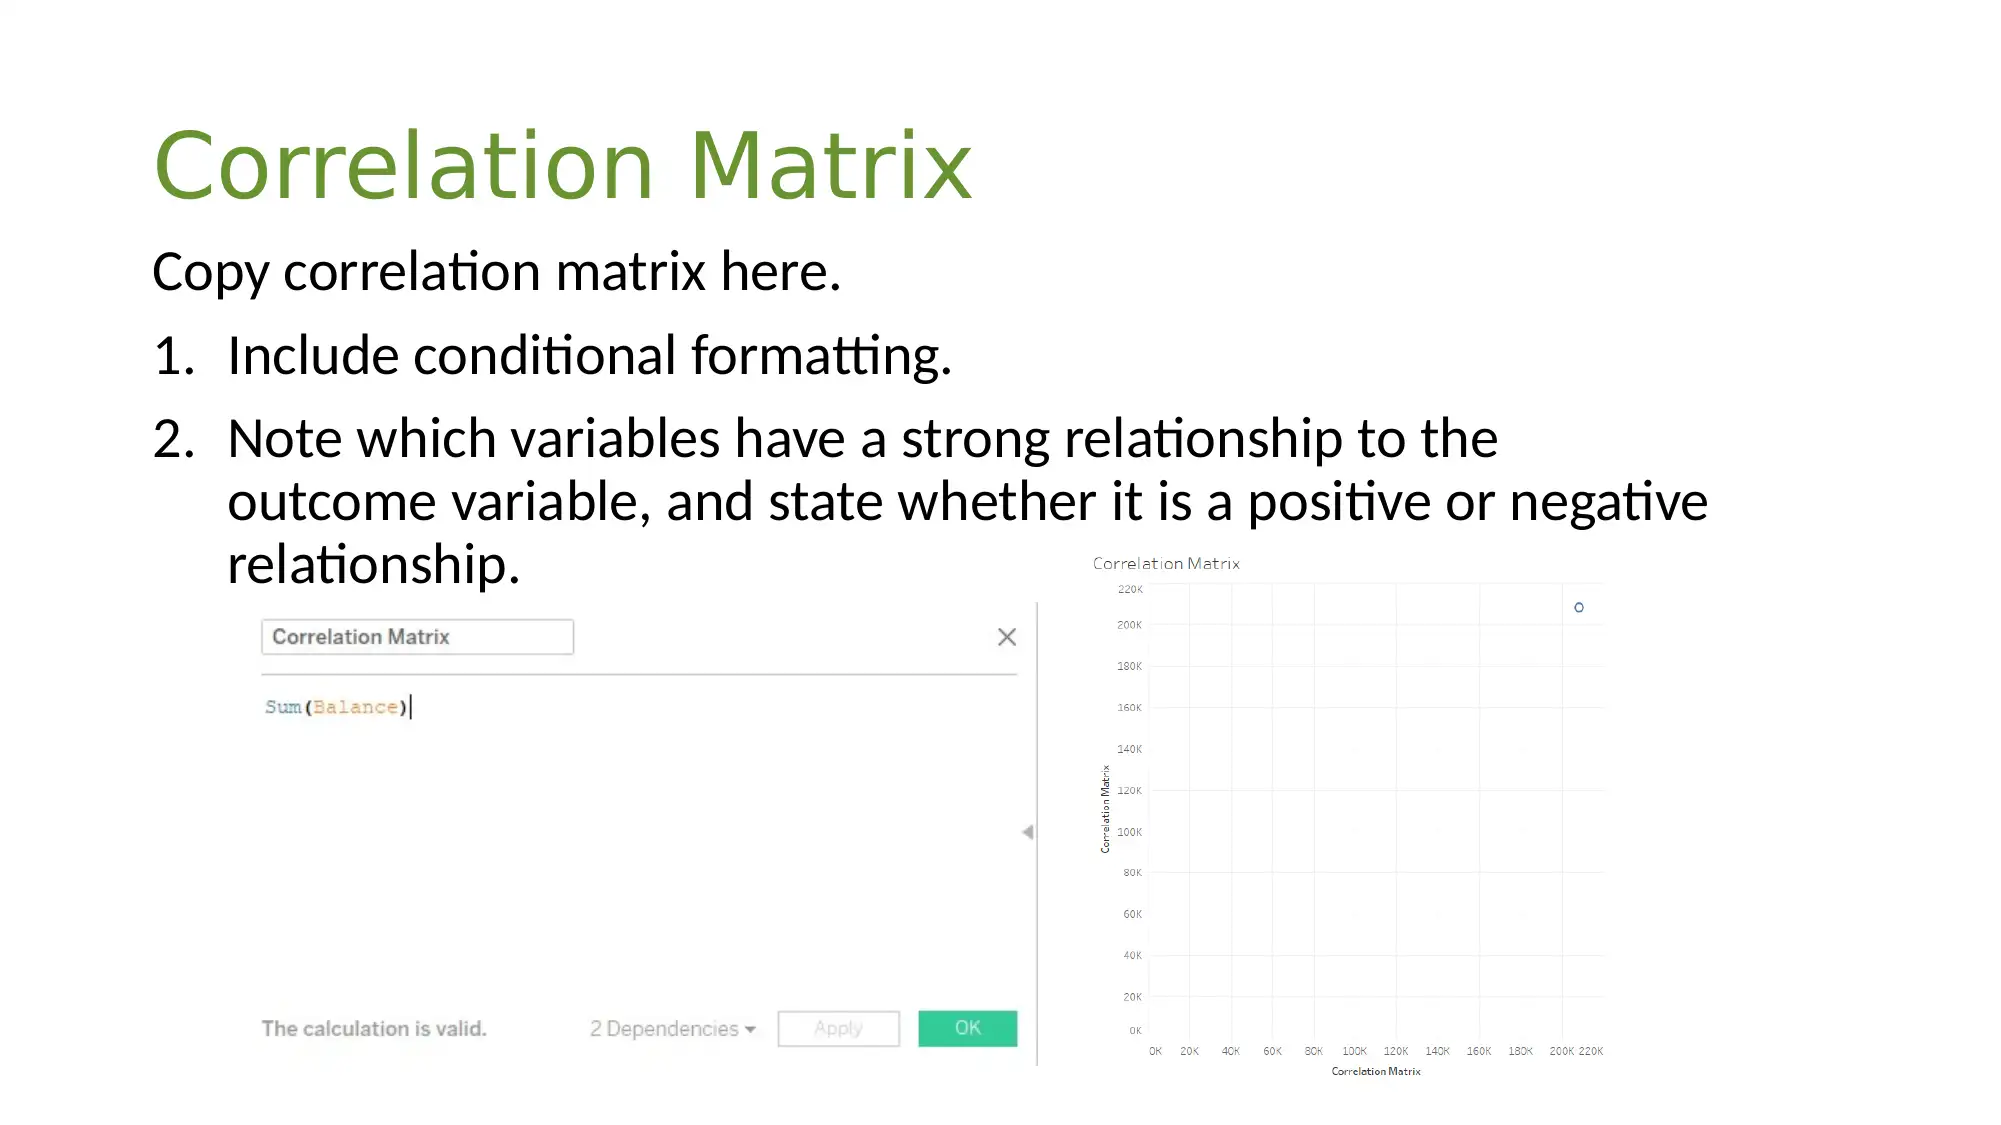
This project demonstrates the application of the CRISP-DM methodology to predict credit card balances using a simulated dataset of 10,000 customers. The project covers the initial phases of CRISP-DM, including Business Understanding, which defines the objectives from both business and technical perspectives, and Data Understanding, which involves data collection, exploration, and analysis of variable types, missing values, and extreme values. The analysis includes univariate analysis of the outcome variable and bivariate analysis of categorical and numerical variables using boxplots and scatterplots, respectively. A correlation matrix is used to identify variables with a strong relationship to the outcome variable. Finally, the project includes Model Building, where four different regression models are run in ML Studio, and the best model is selected based on the evaluation outputs, with the linear regression model being recommended for its suitability when the relationship between covariates and the response variable is linear. The regression equation for the selected model is also provided.
tabler-icon-diamond-filled.svg

Contribute Materials

Your contribution can guide someone’s learning journey. Share your documents today.
Document Page
Assignment 4A.3
tabler-icon-diamond-filled.svg

Secure Best Marks with AI Grader

Need help grading? Try our AI Grader for instant feedback on your assignments.
Document Page
Overview
In this assignment, you will work through the CRISP-DM phases and apply what you
have learned in the previous lessons.Begin
Using the Data Mining Steps, you will perform the tasks of Phases 1, 2, and 4: Business
Understanding, Data Understanding, and Model BuildingPerform
Follow the slides, recording your answers in the slides as you move through the stack.Answers
This assignment will be worth 100 points in the Assignments portion of your final gradePoints
Document Page
Credit dataset
Description: This is a simulated data set containing information
on 10,000 customers. The aim here is to predict a customer’s
average credit card balance.
VARIABLES
ID Identification
Income Income in $10,000's
Limit Credit limit
Rating Credit rating
Cards Number of credit cards
Age Age in years
Education Number of years of education
Gender A factor with levels Male and Female
Student A factor with levels No and Yes indicating whether the individual was a student
Married A factor with levels No and Yes indicating whether the individual was married
Ethnicity A factor with levels African American, Asian, and Caucasian indicating the individual's ethnicity
Balance Average credit card balance in $.
Document Page
Steps in Data
Mining
1) Business Understanding
1.1Determine the business objectives.
1.2Determine the data mining goals.
What is the primary objective, from a business perspective?
In business objectives, this project is work through the CRISP-DM phases by using the Data Mining Steps to predicts
the customer average credit card balance by using the provided data set.
What is the project objective, from a technical perspective?
In technical objectives, this project is used to simulated the provided data set to predict a customer average credit
card balance.
Outcome variable, if relevant:
CRISP-DM: PHASE ONE
BUSINESS
UNDERSTANDING
tabler-icon-diamond-filled.svg

Secure Best Marks with AI Grader

Need help grading? Try our AI Grader for instant feedback on your assignments.
Document Page
CRISP-DM: PHASE TWO
DATA
UNDERSTANDING
ANSWERS HERE:
2.3 a. List of variables with variable type.
2.3 b. Do you need to remove or combine any
variables?
No.
2) Data Understanding
2.1Collect initial data.
Acquire the data. Data file:
2.3 Explore data.
a.
Make lists of variables by variable type:
Numerical, Categorical, Ordinal
Other terms for variable types:
Nominal= Categorical;
Numerical= Quantitative
b.
Incorporate "domain knowledge" to remove
or combine variables.
Variable Type
Income Numeric
Limit Numeric
Rating Numeric
Cards Numeric
Age Numeric
Education Numeric
Gender String
Student String
Married String
Ethnicity Numeric
Balance Numeric
Document Page
CRISP-DM: PHASE TWO
DATA UNDERSTANDING – Explore
Data
In ML Studio, visualize the data and examine each variable and its
descriptive statistics.
In the next slide, answer the questions regarding the variables. You
can use a second slide if you need more space for your answers.
Document Page
In any of the variables:
Are there any missing values?
No
Are there any extreme values?
No
Are there too few observations in any level of the categorical variables?
No
Any other concerns with the data?
No
CRISP-DM: PHASE TWO
DATA UNDERSTANDING – Explore
Data
tabler-icon-diamond-filled.svg

Paraphrase This Document

Need a fresh take? Get an instant paraphrase of this document with our AI Paraphraser
Document Page
Univariate Analysis of Outcome
Variable
For the outcome variable, include the following on this slide: Descriptive
Statistics, Histogram, written summary.
Document Page
Insert slides below this slide to do the instructions given below. More
than one graph can be on a slide.
For each categorical variable: Create side-by-side boxplots of each
categorical variable with the outcome variable.
For each numerical variable: Create a scatterplot of each numerical
variable with the outcome variable.
CRISP-DM: PHASE TWO
DATA UNDERSTANDING – Explore Data
Document Page
Side-by-side boxplots of Categorical
Variables and Outcome variable
tabler-icon-diamond-filled.svg

Secure Best Marks with AI Grader

Need help grading? Try our AI Grader for instant feedback on your assignments.
Document Page
Scatterplots of Numerical Variables and
Outcome variable
Document Page
Correlation Matrix
Copy correlation matrix here.
1. Include conditional formatting.
2. Note which variables have a strong relationship to the
outcome variable, and state whether it is a positive or negative
relationship.
Document Page
Which variables do you suggest
might be useful in predicting mpg?
Based on your bivariate analysis, give your answer to the above
question here. What is your reasoning for each of the selected
variables?
Predicting the credit card balance by using balance variables.
The balance variable is most useful to predict the credit card balance.
tabler-icon-diamond-filled.svg

Paraphrase This Document

Need a fresh take? Get an instant paraphrase of this document with our AI Paraphraser
Document Page
Using the variables you suggested for building a regression model to
predict Balance, run four different regression models in ML Studio.
For each model, give the “Train Model” block output and the
“Evaluate Model” block output. Put two models on each slide.
CRISP-DM: PHASE 4
MODELING
Document Page
CRISP-DM: PHASE 4
MODELING: Model 1 output
Document Page
CRISP-DM: PHASE 4
MODELING: Model 2 output
tabler-icon-diamond-filled.svg

Secure Best Marks with AI Grader

Need help grading? Try our AI Grader for instant feedback on your assignments.
Document Page
CRISP-DM: PHASE 4
MODELING: Model 3output
Document Page
CRISP-DM: PHASE 4
MODELING: Model 4 output
Document Page
Which is the best model and why do you recommend this one?
Based on ML studio simulation, the linear regression model is best model compared to
other model. The Linear regression is great when the relationship to between covariates and
response variable is known to be linear. It focus from statistical modeling and to data analysis and
pre-processing. It is great for learning to play with data without worrying about the intricate details
of the model.
Write out the regression equation of the model you selected.
Linear regression of the model question is Y = a + bX, where X is the explanatory variable and Y is the
dependent variable.
CRISP-DM: PHASE 4
MODELING
chevron_up_icon
1 out of 19
circle_padding
hide_on_mobile
zoom_out_icon
logo.png

Your All-in-One AI-Powered Toolkit for Academic Success.

Available 24*7 on WhatsApp / Email

[object Object]