DAT7003: Critical Analysis of Data Design in Survey Research
VerifiedAdded on 2022/11/25
|11
|2291
|84
Essay
AI Summary
This essay provides a critical analysis of a survey conducted by Schoettle and Sivak (2014) on public opinion regarding autonomous and self-driving cars in the USA, UK, and Australia. The essay examines the survey's components, structure, and positive features, such as the use of an online tool (SurveyMonkey) and the Likert scale. It also discusses the limitations of the study, including the number of incomplete responses, the absence of open-ended questions, the non-interactive nature of the online survey, and the focus on only positive aspects of the technology. The essay concludes that the quality of a research study heavily depends on the types of information collected and the methods adopted for its analysis and that while the survey method used was effective in some aspects, it also had limitations. The study highlights the impact of cultural differences on public opinion and suggests that the inclusion of qualitative data, through methods like personal interviews, could provide more in-depth insights.

Running head: DATA DESIGN
Data Design
Name of the Student:
Name of the University:
Author note:
Data Design
Name of the Student:
Name of the University:
Author note:
Paraphrase This Document
Need a fresh take? Get an instant paraphrase of this document with our AI Paraphraser
1DATA DESIGN
Table of Contents
Introduction......................................................................................................................................2
Components and structure of the survey.........................................................................................3
Positive features of the survey.........................................................................................................4
Limitation of the research study......................................................................................................5
Conclusion.......................................................................................................................................6
References........................................................................................................................................7
Survey Questionnaire (Schoettle and Sivak 2014)..........................................................................8
2DATA DESIGN
Introduction
Collection and analysis of information have a substantial importance in the research
studies. The fundamental aspect of any information is the relevance of it in the desired research
study. Information collected to conduct the research activity is classified into primary and
secondary data. As explained by Sekaran and Bougie (2016), primary data is defined as the
information, which is obtained from the study field by the means of interviews, surveys, focus
groups, observation, feedback methods etc. On the other hand, secondary data is referred to the
information, which is gathered from genuine secondary sources and publications, such as, books,
journals, official websites of organizations, government publications and reports, online libraries,
and leading newspapers and magazines etc. Both the data types are very important and based on
the nature of the topic, the researcher decides which data type would be most suitable to get the
desired outcome.
There are various different methods for collecting first hand data, that is, primary data.
Among those, survey method is the most effective, credible and most commonly used process of
data collection. In the survey process of information collection, the researcher first chooses a
sample from the larger population using relevant probability or non-probability sampling
technique. A sample is a smaller subset of the larger population bearing the similar
characteristics (Peck, Olsen and Devore 2015). The sample is chosen to make estimates about the
particular features of the larger population in the context of the research issue (Bell, Bryman and
Harley 2018). The researchers use this method of data collection quite extensively due to the
reason that survey method is useful for creating data, which is case specific and it provides larger
control on the sample, being studied by the researcher. However, one major drawback of survey
⊘ This is a preview!⊘
Do you want full access?
Subscribe today to unlock all pages.
Trusted by 1+ million students worldwide
3DATA DESIGN
method is the scope of sampling error, which may lead to a generalized conclusion of the
research issue. Thus, this essay will present a critical discussion on a real survey conducted by
other scholars and evaluate the effectiveness of the survey in conducting the study and also
determine the overall implication for the study. The survey, that will be used for critical analysis
in this essay, was undertaken by Schoettle and Sivak (2014) to investigate the public opinion on
the autonomous and self-driving cars in three countries, namely, Australia, the UK and the USA.
In this critical analysis of the structure of the survey and the underlying logics for the chosen
methods in the study, the researcher would focus on the efficiency of the selected data collection
process to reach the conclusion and would present appropriate recommendation on the choice of
this specific tool for the purpose of forthcoming research.
Components and structure of the survey
The survey that will be considered in this essay consists of a detailed quantitative analysis
of the primary data collected from people belonging to three countries, Australia, UK, and USA.
The key aim of the authors was to investigate and examine the opinion of people in regards to the
autonomous and self-driving cars. The authors chose these three countries due to the reasons that
the people of these nations speak English and the autonomous cars have been launched there,
hence, they had awareness and knowledge on the autonomous cars (Schoettle and Sivak 2014).
The researchers conducted the survey using online tool, SurveyMonkey. The
questionnaire consists of two segments, demographic and non-demographic. The segment
containing demographic questions aimed at evaluating the socio-economic profiles of the survey
respondents. Gender, age, highest education level, current employment level and vehicle type
used by the participants were asked in the demographic part of the survey. These factors gave an
Paraphrase This Document
Need a fresh take? Get an instant paraphrase of this document with our AI Paraphraser
4DATA DESIGN
overview of the age, gender and socio-economic background of the survey respondents, as well
as reliability of the information (Nardi 2018). The segment containing non-demographic
questions aimed at examining the specifics of the research topic, that is, opinion of the people in
regards to the autonomous vehicles. Along with that, the survey questions also aimed at
evaluating the thoughts of the survey respondents regarding the usage of advanced technology.
Likert scale, which is a replicable scale used for converting the survey responses into numeric
values, have been used for collecting the answers of the survey participants.
Positive features of the survey
The positive features of the survey are quite a few. Firstly, the researchers chose the
respondents from three different developed countries and hence, it was assumed that the
differences in cultures might affect the public opinion in relation to the research issue. Although
all the three countries have English speaking population, yet, there are differences in cultures.
Thus, the approach of the study was cross-cultural, which might have affected the outcome of the
study. The researchers had experiences of public opinion on the research topic, hence, wanted to
expand the scope of the topic, and thus, conducted a multi-country research study.
Furthermore, usage of online survey tool, that is, SurveyMonkey, was beneficial to
ensure that respondents were above the age of 18. This tool was useful to automatically eliminate
any participant below 18 years, which is the legal age for obtaining a driving license in all the
three countries. Hence, by using this tool the researchers ensured that only participants above the
legal age of driving could provide their responses. That made the responses more credible and
reliable.
5DATA DESIGN
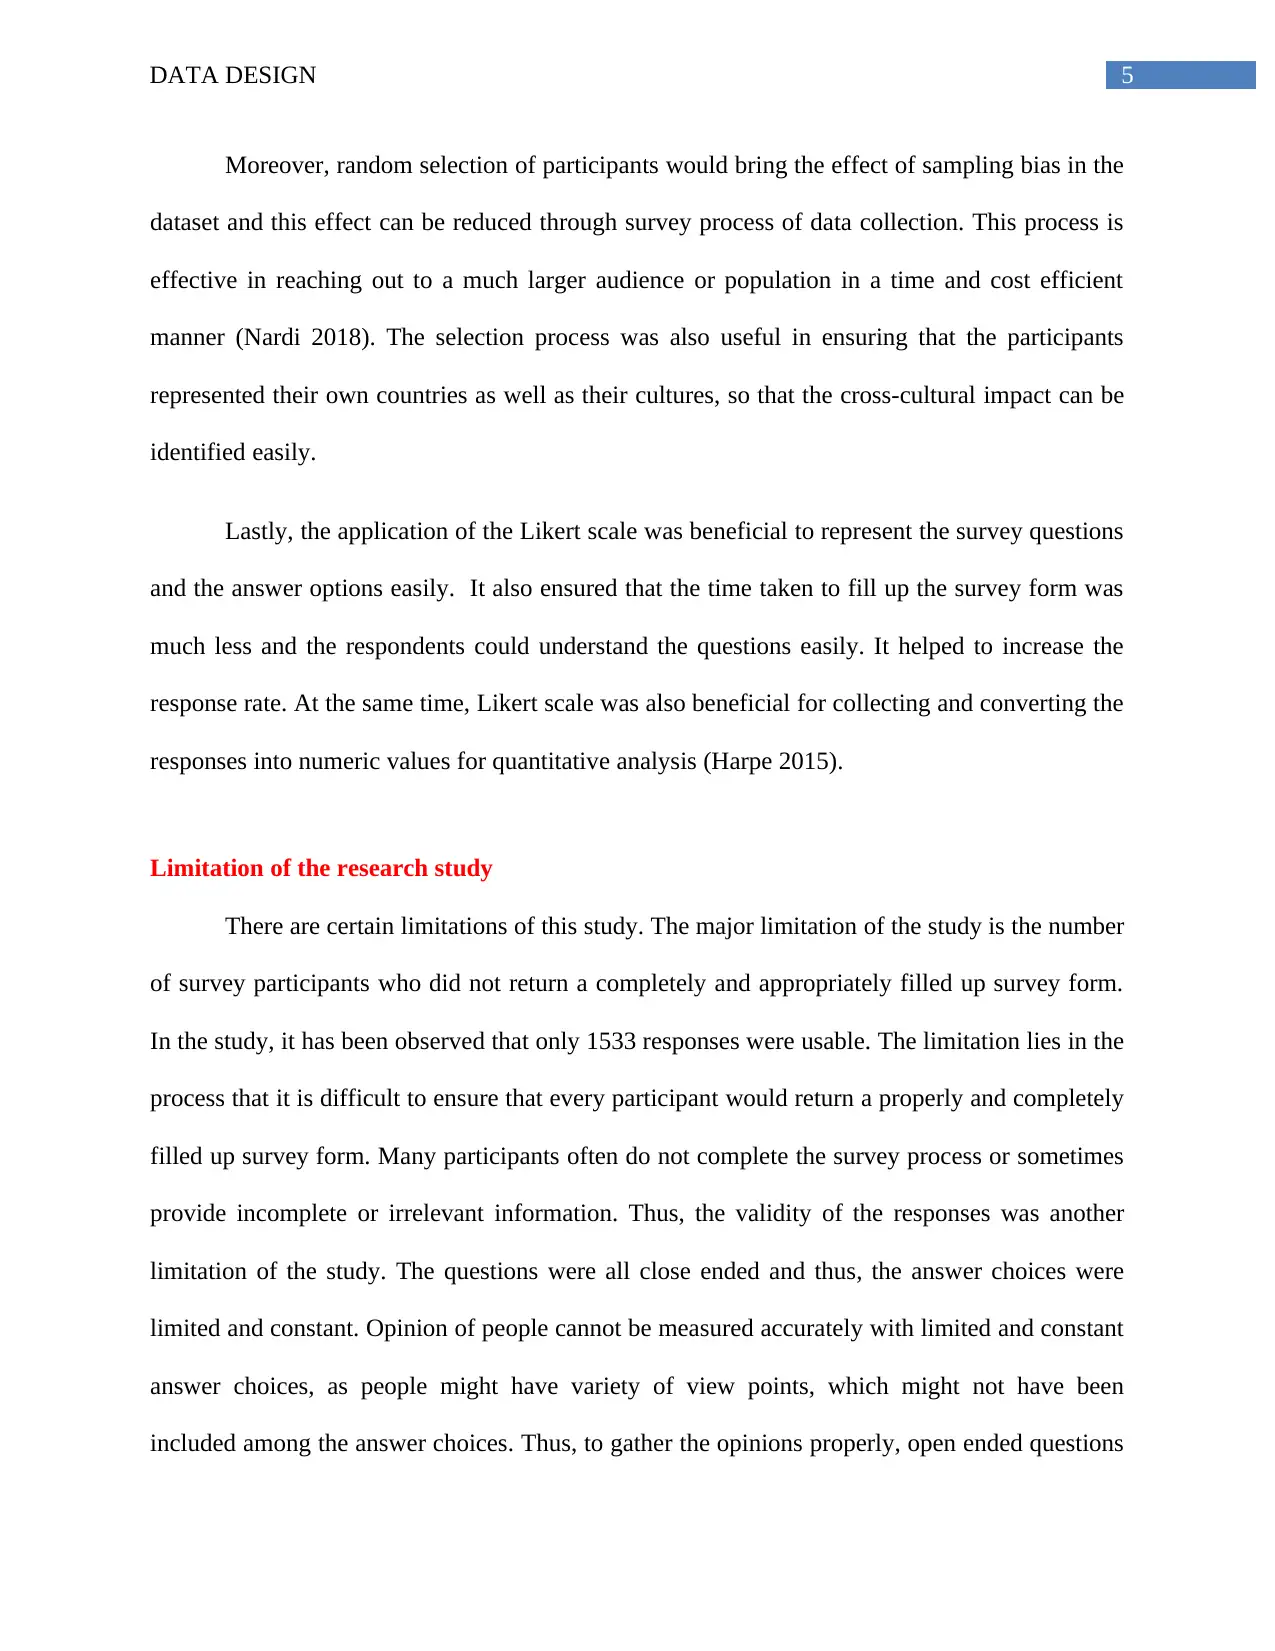
Moreover, random selection of participants would bring the effect of sampling bias in the
dataset and this effect can be reduced through survey process of data collection. This process is
effective in reaching out to a much larger audience or population in a time and cost efficient
manner (Nardi 2018). The selection process was also useful in ensuring that the participants
represented their own countries as well as their cultures, so that the cross-cultural impact can be
identified easily.
Lastly, the application of the Likert scale was beneficial to represent the survey questions
and the answer options easily. It also ensured that the time taken to fill up the survey form was
much less and the respondents could understand the questions easily. It helped to increase the
response rate. At the same time, Likert scale was also beneficial for collecting and converting the
responses into numeric values for quantitative analysis (Harpe 2015).
Limitation of the research study
There are certain limitations of this study. The major limitation of the study is the number
of survey participants who did not return a completely and appropriately filled up survey form.
In the study, it has been observed that only 1533 responses were usable. The limitation lies in the
process that it is difficult to ensure that every participant would return a properly and completely
filled up survey form. Many participants often do not complete the survey process or sometimes
provide incomplete or irrelevant information. Thus, the validity of the responses was another
limitation of the study. The questions were all close ended and thus, the answer choices were
limited and constant. Opinion of people cannot be measured accurately with limited and constant
answer choices, as people might have variety of view points, which might not have been
included among the answer choices. Thus, to gather the opinions properly, open ended questions
⊘ This is a preview!⊘
Do you want full access?
Subscribe today to unlock all pages.
Trusted by 1+ million students worldwide
6DATA DESIGN
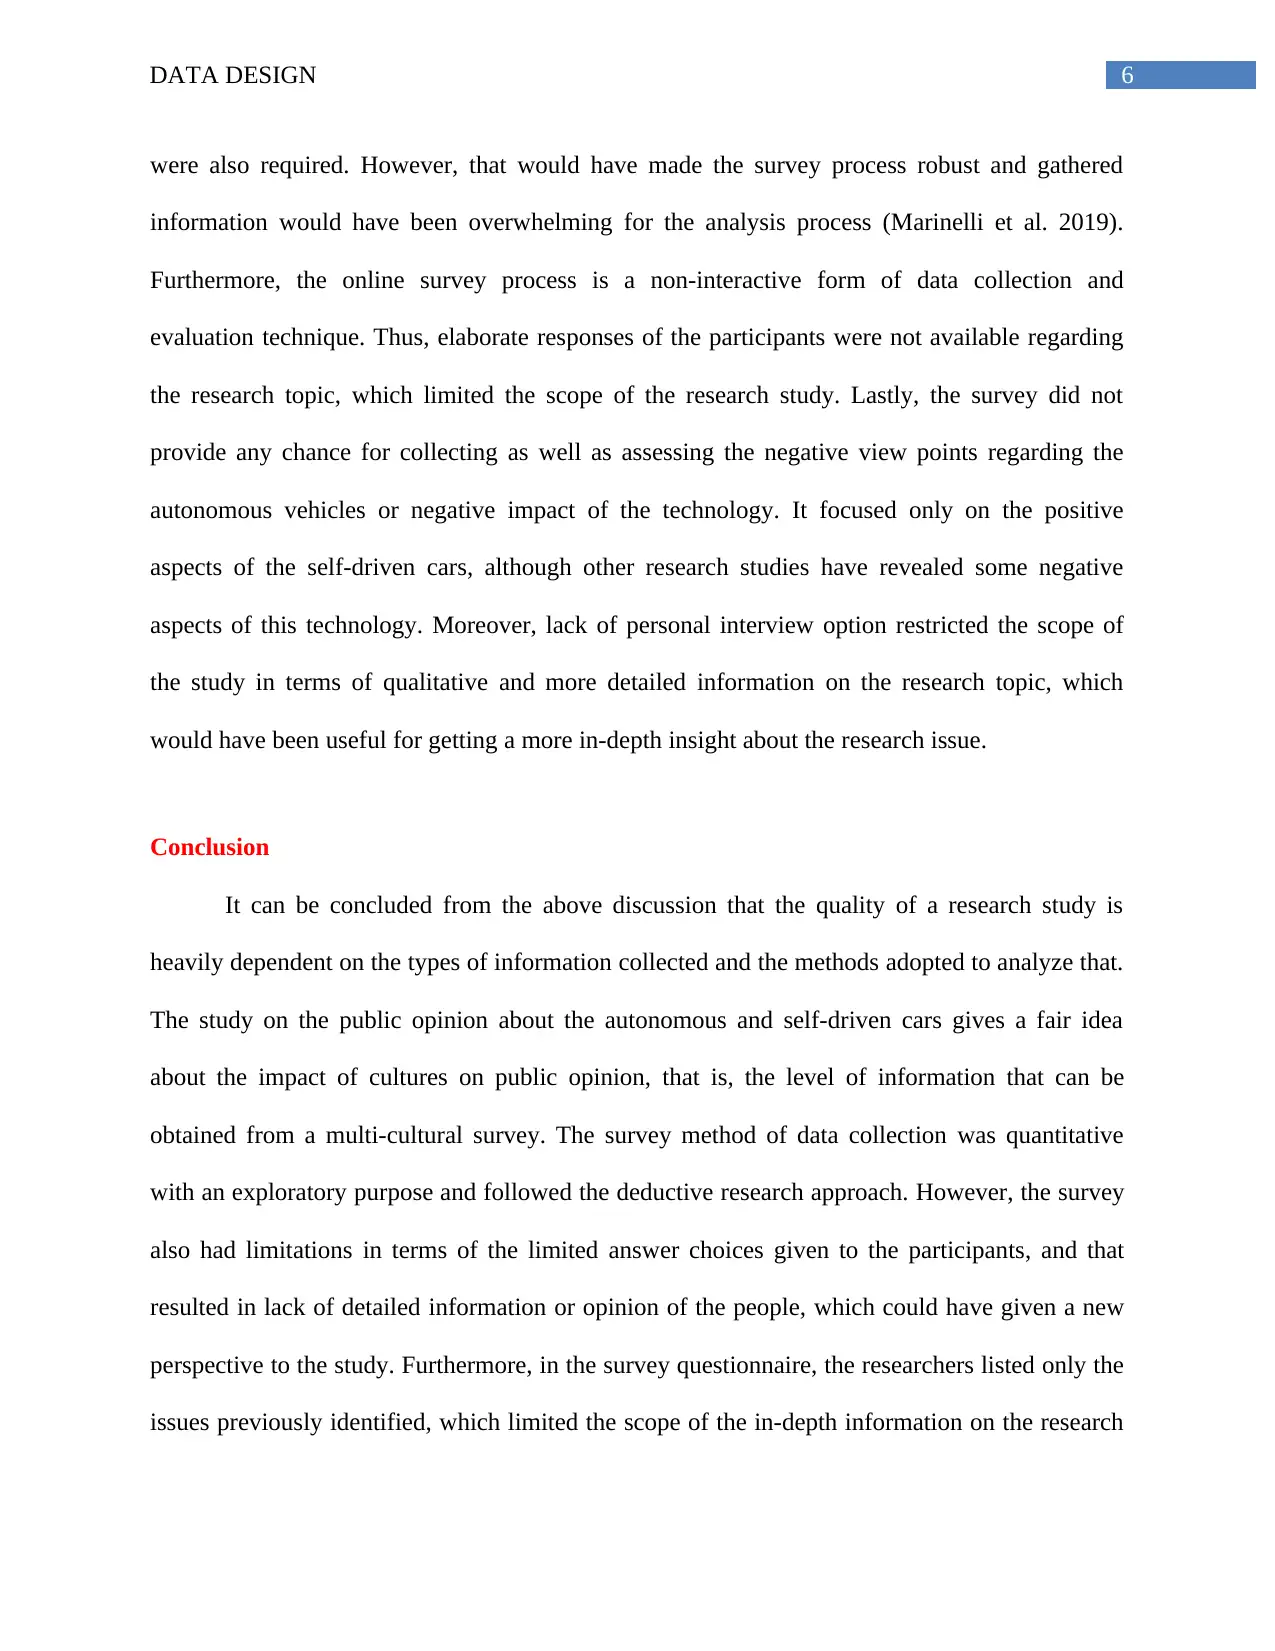
were also required. However, that would have made the survey process robust and gathered
information would have been overwhelming for the analysis process (Marinelli et al. 2019).
Furthermore, the online survey process is a non-interactive form of data collection and
evaluation technique. Thus, elaborate responses of the participants were not available regarding
the research topic, which limited the scope of the research study. Lastly, the survey did not
provide any chance for collecting as well as assessing the negative view points regarding the
autonomous vehicles or negative impact of the technology. It focused only on the positive
aspects of the self-driven cars, although other research studies have revealed some negative
aspects of this technology. Moreover, lack of personal interview option restricted the scope of
the study in terms of qualitative and more detailed information on the research topic, which
would have been useful for getting a more in-depth insight about the research issue.
Conclusion
It can be concluded from the above discussion that the quality of a research study is
heavily dependent on the types of information collected and the methods adopted to analyze that.
The study on the public opinion about the autonomous and self-driven cars gives a fair idea
about the impact of cultures on public opinion, that is, the level of information that can be
obtained from a multi-cultural survey. The survey method of data collection was quantitative
with an exploratory purpose and followed the deductive research approach. However, the survey
also had limitations in terms of the limited answer choices given to the participants, and that
resulted in lack of detailed information or opinion of the people, which could have given a new
perspective to the study. Furthermore, in the survey questionnaire, the researchers listed only the
issues previously identified, which limited the scope of the in-depth information on the research
Paraphrase This Document
Need a fresh take? Get an instant paraphrase of this document with our AI Paraphraser

7DATA DESIGN
topic. This issue could be overcome if qualitative data was also collected through personal
interviews.
topic. This issue could be overcome if qualitative data was also collected through personal
interviews.
8DATA DESIGN
References
Bell, E., Bryman, A. and Harley, B., 2018. Business research methods. Oxford university press.
Harpe, S.E., 2015. How to analyze Likert and other rating scale data. Currents in Pharmacy
Teaching and Learning, 7(6), pp.836-850.
Marinelli, J.P., Prummer, C.M., Link, M.J. and Carlson, M.L., 2019. Differentiating the General
Vestibular Schwannoma Patient Population, Tertiary Referral Center Cohorts, and the Acoustic
Neuroma Association Survey Respondents: A Response to the Benefits and Drawbacks of
Survey-Based Studies. Otology & Neurotology, 40(7), pp.980-982.
Nardi, P.M., 2018. Doing survey research: A guide to quantitative methods. Routledge.
Peck, R., Olsen, C. and Devore, J.L., 2015. Introduction to statistics and data analysis. Cengage
Learning.
Schoettle, B. and Sivak, M., 2014. A survey of public opinion about autonomous and self-driving
vehicles in the US, the UK, and Australia. University of Michigan, Ann Arbor, Transportation
Research Institute.
Sekaran, U. and Bougie, R., 2016. Research methods for business: A skill building approach.
John Wiley & Sons.
⊘ This is a preview!⊘
Do you want full access?
Subscribe today to unlock all pages.
Trusted by 1+ million students worldwide
9DATA DESIGN
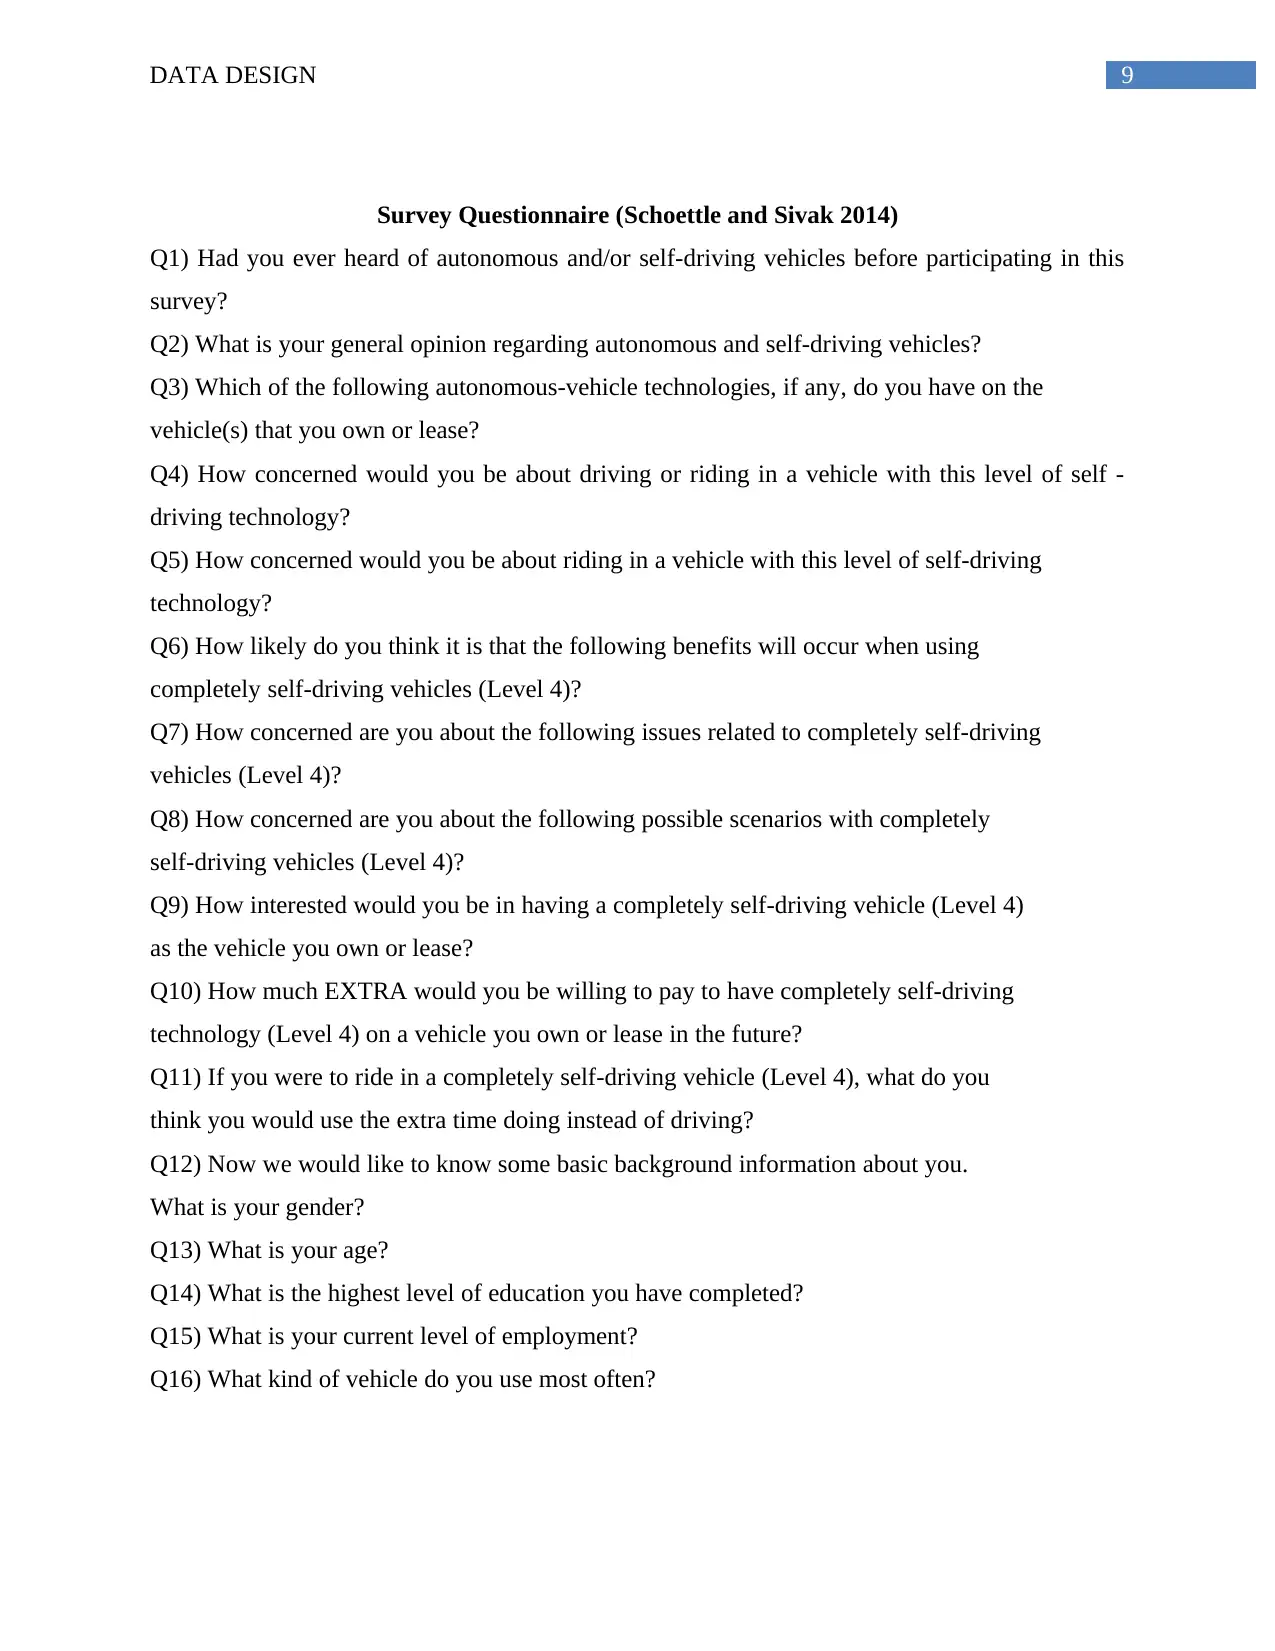
Survey Questionnaire (Schoettle and Sivak 2014)
Q1) Had you ever heard of autonomous and/or self-driving vehicles before participating in this
survey?
Q2) What is your general opinion regarding autonomous and self-driving vehicles?
Q3) Which of the following autonomous-vehicle technologies, if any, do you have on the
vehicle(s) that you own or lease?
Q4) How concerned would you be about driving or riding in a vehicle with this level of self -
driving technology?
Q5) How concerned would you be about riding in a vehicle with this level of self-driving
technology?
Q6) How likely do you think it is that the following benefits will occur when using
completely self-driving vehicles (Level 4)?
Q7) How concerned are you about the following issues related to completely self-driving
vehicles (Level 4)?
Q8) How concerned are you about the following possible scenarios with completely
self-driving vehicles (Level 4)?
Q9) How interested would you be in having a completely self-driving vehicle (Level 4)
as the vehicle you own or lease?
Q10) How much EXTRA would you be willing to pay to have completely self-driving
technology (Level 4) on a vehicle you own or lease in the future?
Q11) If you were to ride in a completely self-driving vehicle (Level 4), what do you
think you would use the extra time doing instead of driving?
Q12) Now we would like to know some basic background information about you.
What is your gender?
Q13) What is your age?
Q14) What is the highest level of education you have completed?
Q15) What is your current level of employment?
Q16) What kind of vehicle do you use most often?
Paraphrase This Document
Need a fresh take? Get an instant paraphrase of this document with our AI Paraphraser

10DATA DESIGN
1 out of 11
Related Documents


Your All-in-One AI-Powered Toolkit for Academic Success.
+13062052269
info@desklib.com
Available 24*7 on WhatsApp / Email
![[object Object]](/_next/static/media/star-bottom.7253800d.svg)
Unlock your academic potential
Copyright © 2020–2026 A2Z Services. All Rights Reserved. Developed and managed by ZUCOL.