Final Project: Critical Evaluation of Health Research Literature
VerifiedAdded on 2022/09/01
|18
|3475
|25
Project
AI Summary
This literature evaluation paper critically examines data analysis reports in health research, focusing on nonparametric tests, t-tests, and correlations. The paper includes an introduction to critical evaluation and its importance in healthcare, followed by in-depth analyses of three statistical methods: nonparametric tests, t-tests, and correlation. For each method, the paper discusses the research problem, data collection methods, variables used, sample size estimation, the appropriateness of the statistical test, and the data display. The paper also reviews the application of these methods in health research. The assignment is structured in APA style, adhering to the provided guidelines and course objectives, and demonstrates a comprehensive understanding of data analysis in the context of health science research. The data was collected using observation, manual data, and inpatient medical records.
Running head: LITERATURE EVALUATION 1
Literature Evaluation Paper
Name
Institutional Affiliation
Literature Evaluation Paper
Name
Institutional Affiliation
Paraphrase This Document
Need a fresh take? Get an instant paraphrase of this document with our AI Paraphraser
LITERATURE EVALUATION 2
Literature Evaluation Paper
Introduction
Critical evaluation is a process of examining research prudently and
systematically to evaluate its reliability, value, and relevance in a given setting.
Examination of health literature provides accurate medical information that is
supported by robust scientific proofs that aids and improves patient care. With the
raising load of scientific discoveries, it becomes difficult to keep abreast on the
current literature. Critical evaluation helps in distinguishing between the valuable
and flawed studies (Ding, 2012).Today’s health care firms are shifting away from
quantity/volume- based activities to quality/value- based activities, which entails
nurses and doctors to be more efficient and productive. This improves the health
practices, changing one‘s life style to a longer one with reduced chances of illness
and infections (Every-Palmer, 2014). Over years, healthcare statistics has become
more sophiscated due to large volumes of data available recently, along with the
fast advancement of technology which has led to discovery of new diseases. The
sector believes that through critical data evaluation, they can be able to manage
the huge health data, to enhance the improvement of the industry. Inaccurate
statistical technique may result in wrong conclusion which lead to unethical
exercise. Critical health evaluation led to a better decision needed to improve
one’s health care (Gosall, 2012).
Review of Data Analysis
Non- parametric Test Paper
LITERATURE EVALUATION 3
Parametric tests can sometimes lead to wrong results if the expectations of
normality are not attained, and the mean of the sample is not normally distributed.
In such case distribution- free method (Non-parametric test) is used, as it does not
involve the normality assumption. The non-parametric techniques includes,
Spearman rank order, Friedman test, Kolmogorov-Smirnov test, Mann-Whitney
U-test ,Jonckheere test, Kruskal-Wallistest and Wilcoxon sign rank test (Gratton,
2010).Non parametric tests are applied when, data doesn’t follow any probability
distribution, data with limit of detection, data with outliers and one with ordinal
ranks or values.
Research problem
The study questions helps to cover the historical literature of health
evaluation. For the essence literature assessment both primary and secondary
research problems were articulated for the suitable lead of the study (Straus,
2011). They includes:
Primary question:
1) What is the effects of critical evaluation to the existing health research?
Secondary question:
2) How this effects differentiates the inferential statistics and descriptive statistics
concepts?
3) Was the hypothesis testing appropriate for the decision making?
Data Collection
The data was collected with the help of three research assistants from the
hospital through three methods, which includes;
⊘ This is a preview!⊘
Do you want full access?
Subscribe today to unlock all pages.
Trusted by 1+ million students worldwide
LITERATURE EVALUATION 4
1) Observation of the data manual. The data manual was obtained from the
available records such as nursing handovers, paper-based ward transfer/discharge
records, paper-based inpatient remedial records, and verbal information from the
staff members of the hospital. This method of data collection was the logical
approach projected in replicating how the available data would be gathered in a
large clinical experiments with inadequate resources.
2) Retrospective data extraction. Data was obtained by use of administrative
available data from electronic patient management system. The program permits
administrative aspect of inpatient incident to be securely followed within an
integrated database accessible by the staff members from different sites within the
same healthcare facilities.
3) Retrospective assessment of scanned records. Paper- based health records were
scanned by the medical record clerical staff and formed a centralized digital
records.
Variables
Variable is a character that differs from each of the individual member to
the other. The variables used is the ordinal data variable and nominal data
variables. This type of variable is associated with non- parametric data. Ordinal
measurements gives the quantifiable order of variable but does not indicate value
of positional difference. Ordinal scale in health research includes stress scale,
function scales, and pain scale .One can estimate someone with higher score of
pain, more functional and more stressed than another one with lower pain score,
Paraphrase This Document
Need a fresh take? Get an instant paraphrase of this document with our AI Paraphraser
LITERATURE EVALUATION 5
but not how much. The number of techniques used in testing the hypothesis of
different groups and variable relationship relies on the ranking order.
Nominal data variables is consisted of two mutually exclusive category
with no implied order i.e. male or female, yes or no.Data is categorized and
counted and no numerical value is allocated to the variables. Without the order
and meaningful distance between nominal measurements thus, difficult to obtain
normal distribution. Descriptive health research make use of nominal scale when
collecting the statistical data targeting population.
Sample size estimation
Adequate sample size was estimated by use of small groups of individuals.
Small sample size increases the probability of errors and reduces resulting power.
According to Castellan and Siegel they suggest that when the sample size is small,
there is no alternative method to be used other than non-parametric test.But if it’s
very small it is not defined. The sample size of the research was estimated by use
of the three non-parametric methods which includes; Mann-Whitney, Wilcoxon
signed and Kruskal-Wallis test.
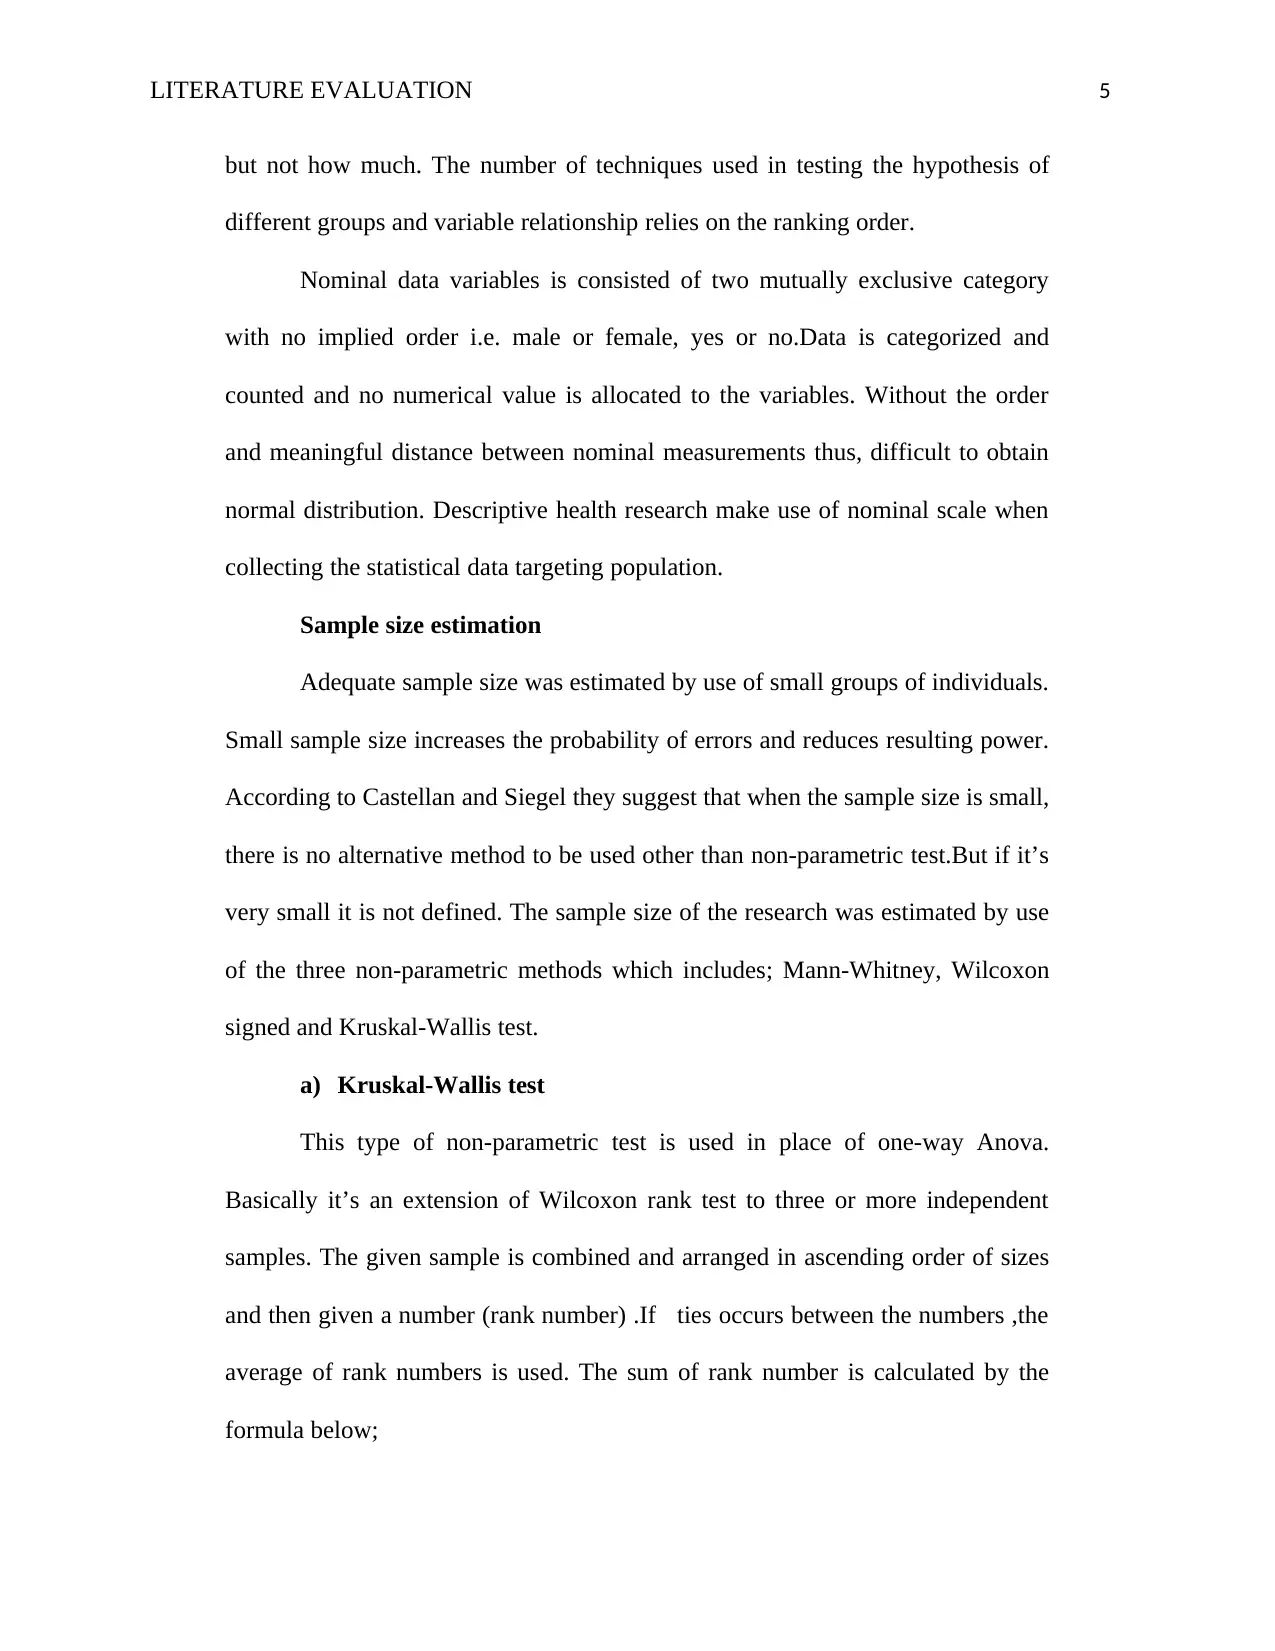
a) Kruskal-Wallis test
This type of non-parametric test is used in place of one-way Anova.
Basically it’s an extension of Wilcoxon rank test to three or more independent
samples. The given sample is combined and arranged in ascending order of sizes
and then given a number (rank number) .If ties occurs between the numbers ,the
average of rank numbers is used. The sum of rank number is calculated by the
formula below;
but not how much. The number of techniques used in testing the hypothesis of
different groups and variable relationship relies on the ranking order.
Nominal data variables is consisted of two mutually exclusive category
with no implied order i.e. male or female, yes or no.Data is categorized and
counted and no numerical value is allocated to the variables. Without the order
and meaningful distance between nominal measurements thus, difficult to obtain
normal distribution. Descriptive health research make use of nominal scale when
collecting the statistical data targeting population.
Sample size estimation
Adequate sample size was estimated by use of small groups of individuals.
Small sample size increases the probability of errors and reduces resulting power.
According to Castellan and Siegel they suggest that when the sample size is small,
there is no alternative method to be used other than non-parametric test.But if it’s
very small it is not defined. The sample size of the research was estimated by use
of the three non-parametric methods which includes; Mann-Whitney, Wilcoxon
signed and Kruskal-Wallis test.
a) Kruskal-Wallis test
This type of non-parametric test is used in place of one-way Anova.
Basically it’s an extension of Wilcoxon rank test to three or more independent
samples. The given sample is combined and arranged in ascending order of sizes
and then given a number (rank number) .If ties occurs between the numbers ,the
average of rank numbers is used. The sum of rank number is calculated by the
formula below;
LITERATURE EVALUATION 6
Where Rj - is therank ∑ of jth samples ,
nj - is the¿ combined sample.
Using X2 distribution with k −1 degree of freedom, when H goes beyond critical
value, the null hypothesis is rejected (equal mean) i.e. X2calculated¿ X2table null
hypothesis rejected (Brownstein, 2010).
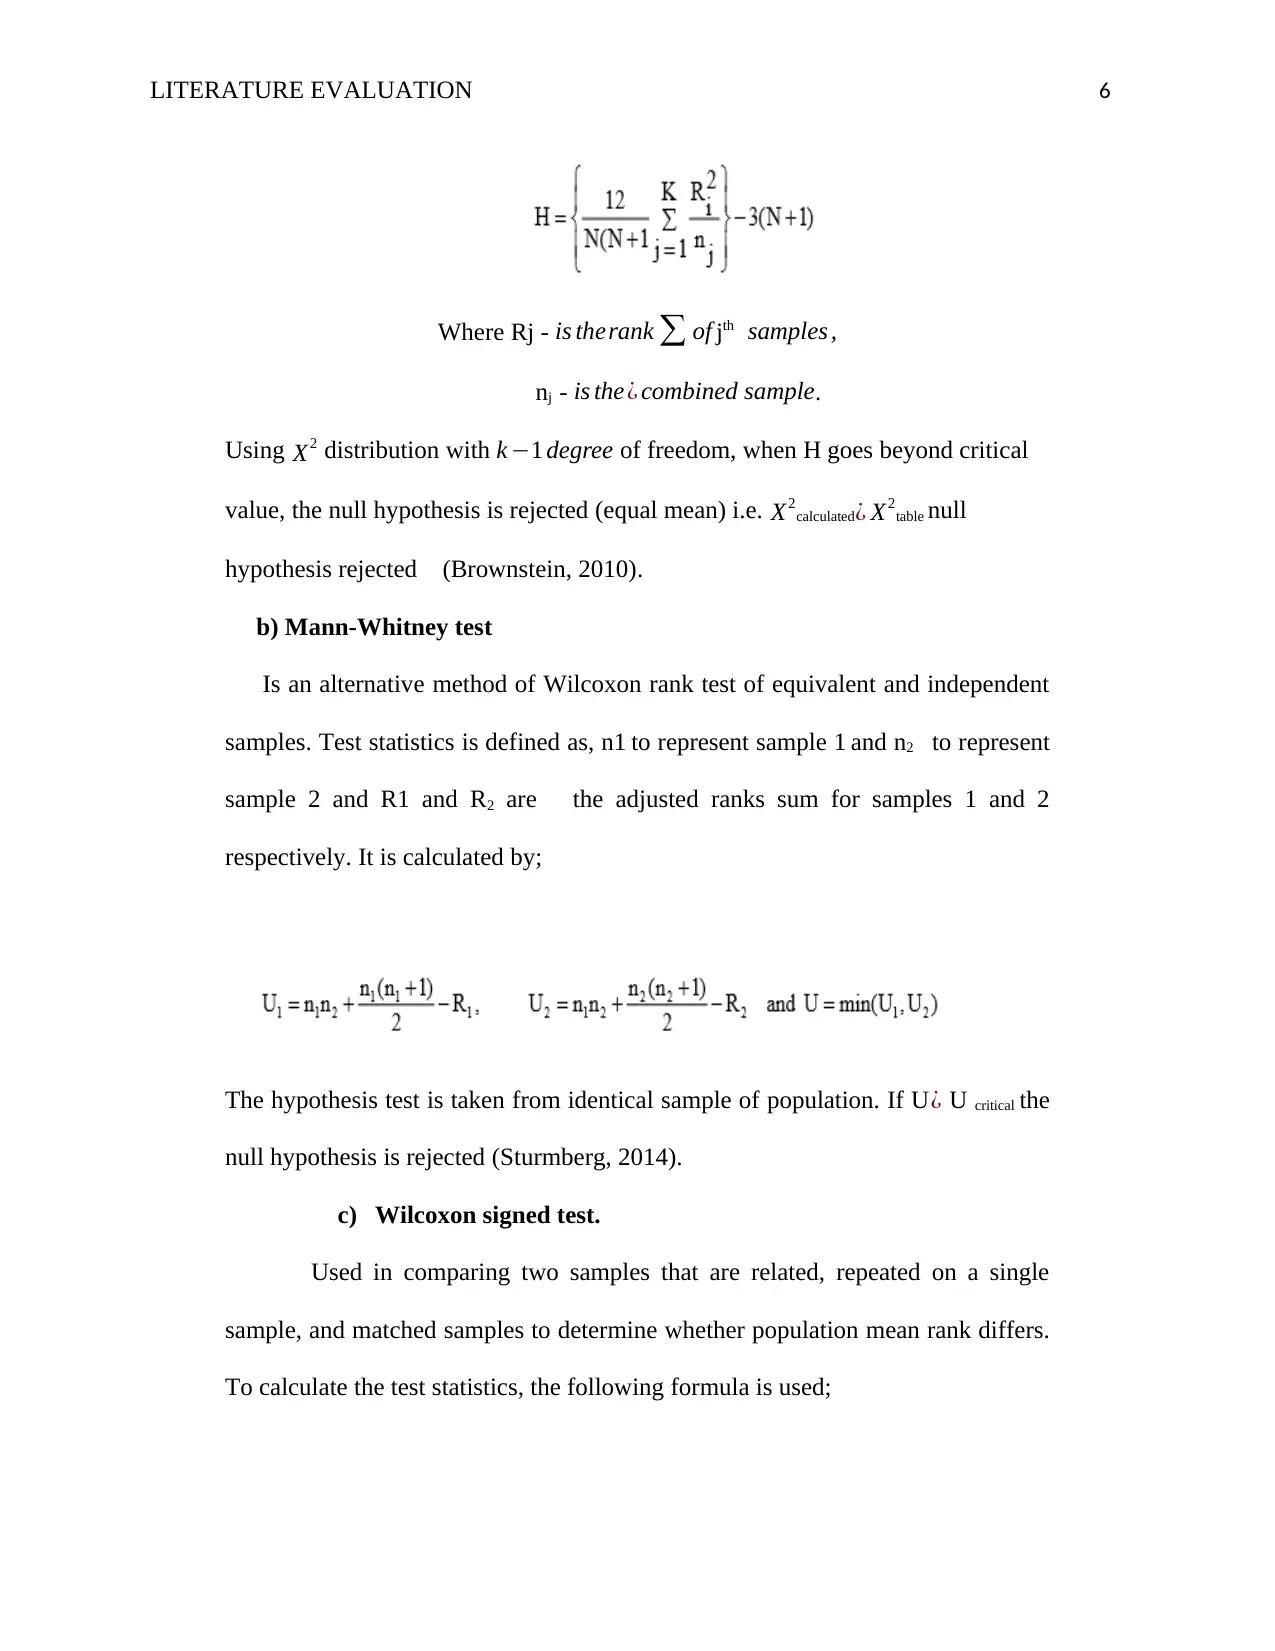
b) Mann-Whitney test
Is an alternative method of Wilcoxon rank test of equivalent and independent
samples. Test statistics is defined as, n1 to represent sample 1 and n2 to represent
sample 2 and R1 and R2 are the adjusted ranks sum for samples 1 and 2
respectively. It is calculated by;
The hypothesis test is taken from identical sample of population. If U¿ U critical the
null hypothesis is rejected (Sturmberg, 2014).
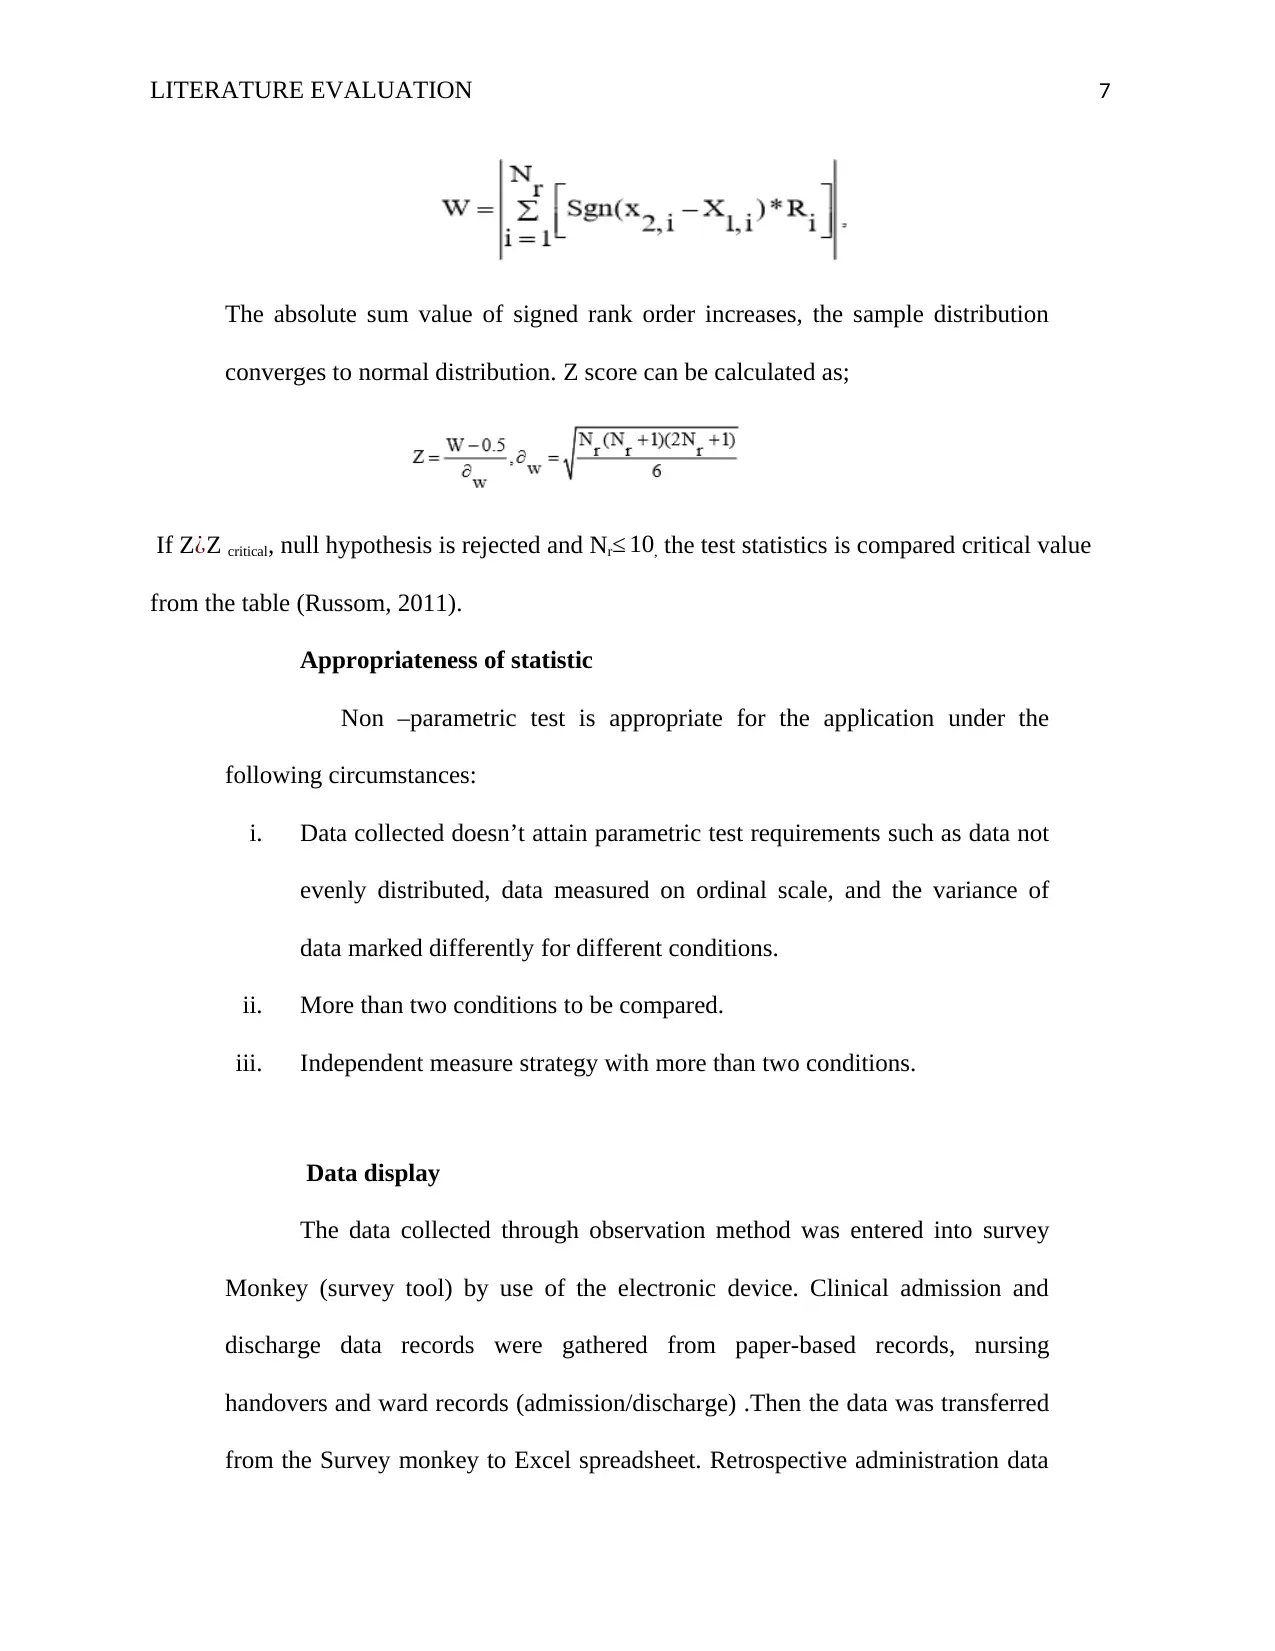
c) Wilcoxon signed test.
Used in comparing two samples that are related, repeated on a single
sample, and matched samples to determine whether population mean rank differs.
To calculate the test statistics, the following formula is used;
Where Rj - is therank ∑ of jth samples ,
nj - is the¿ combined sample.
Using X2 distribution with k −1 degree of freedom, when H goes beyond critical
value, the null hypothesis is rejected (equal mean) i.e. X2calculated¿ X2table null
hypothesis rejected (Brownstein, 2010).
b) Mann-Whitney test
Is an alternative method of Wilcoxon rank test of equivalent and independent
samples. Test statistics is defined as, n1 to represent sample 1 and n2 to represent
sample 2 and R1 and R2 are the adjusted ranks sum for samples 1 and 2
respectively. It is calculated by;
The hypothesis test is taken from identical sample of population. If U¿ U critical the
null hypothesis is rejected (Sturmberg, 2014).
c) Wilcoxon signed test.
Used in comparing two samples that are related, repeated on a single
sample, and matched samples to determine whether population mean rank differs.
To calculate the test statistics, the following formula is used;
⊘ This is a preview!⊘
Do you want full access?
Subscribe today to unlock all pages.
Trusted by 1+ million students worldwide
LITERATURE EVALUATION 7
The absolute sum value of signed rank order increases, the sample distribution
converges to normal distribution. Z score can be calculated as;
If Z¿Z critical, null hypothesis is rejected and Nr≤ 10, the test statistics is compared critical value
from the table (Russom, 2011).
Appropriateness of statistic
Non –parametric test is appropriate for the application under the
following circumstances:
i. Data collected doesn’t attain parametric test requirements such as data not
evenly distributed, data measured on ordinal scale, and the variance of
data marked differently for different conditions.
ii. More than two conditions to be compared.
iii. Independent measure strategy with more than two conditions.
Data display
The data collected through observation method was entered into survey
Monkey (survey tool) by use of the electronic device. Clinical admission and
discharge data records were gathered from paper-based records, nursing
handovers and ward records (admission/discharge) .Then the data was transferred
from the Survey monkey to Excel spreadsheet. Retrospective administration data
Paraphrase This Document
Need a fresh take? Get an instant paraphrase of this document with our AI Paraphraser
LITERATURE EVALUATION 8
extracted was transferred into a separate spreadsheet of Microsoft excel to ensure
full inpatient data is captured. Reliability analysis was performed to control the
consistency of data collected (Willig, 2013).
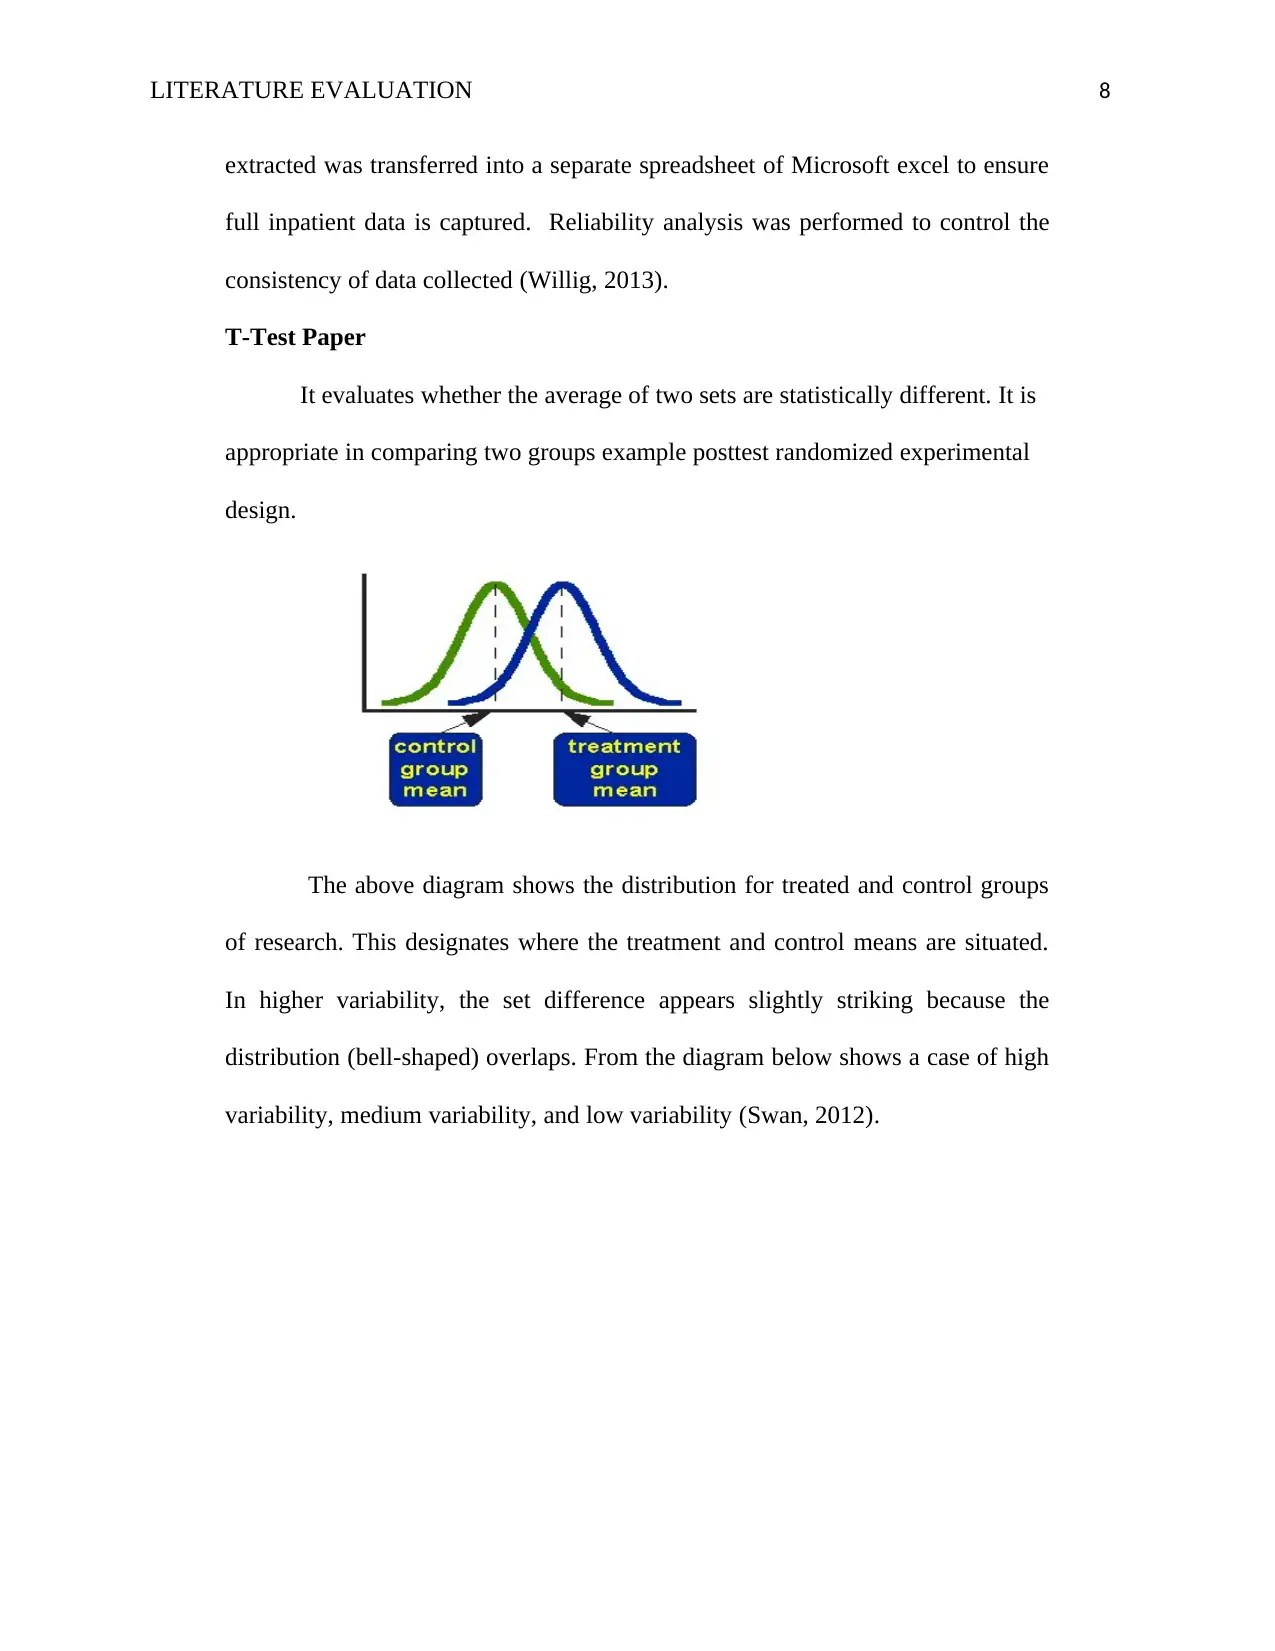
T-Test Paper
It evaluates whether the average of two sets are statistically different. It is
appropriate in comparing two groups example posttest randomized experimental
design.
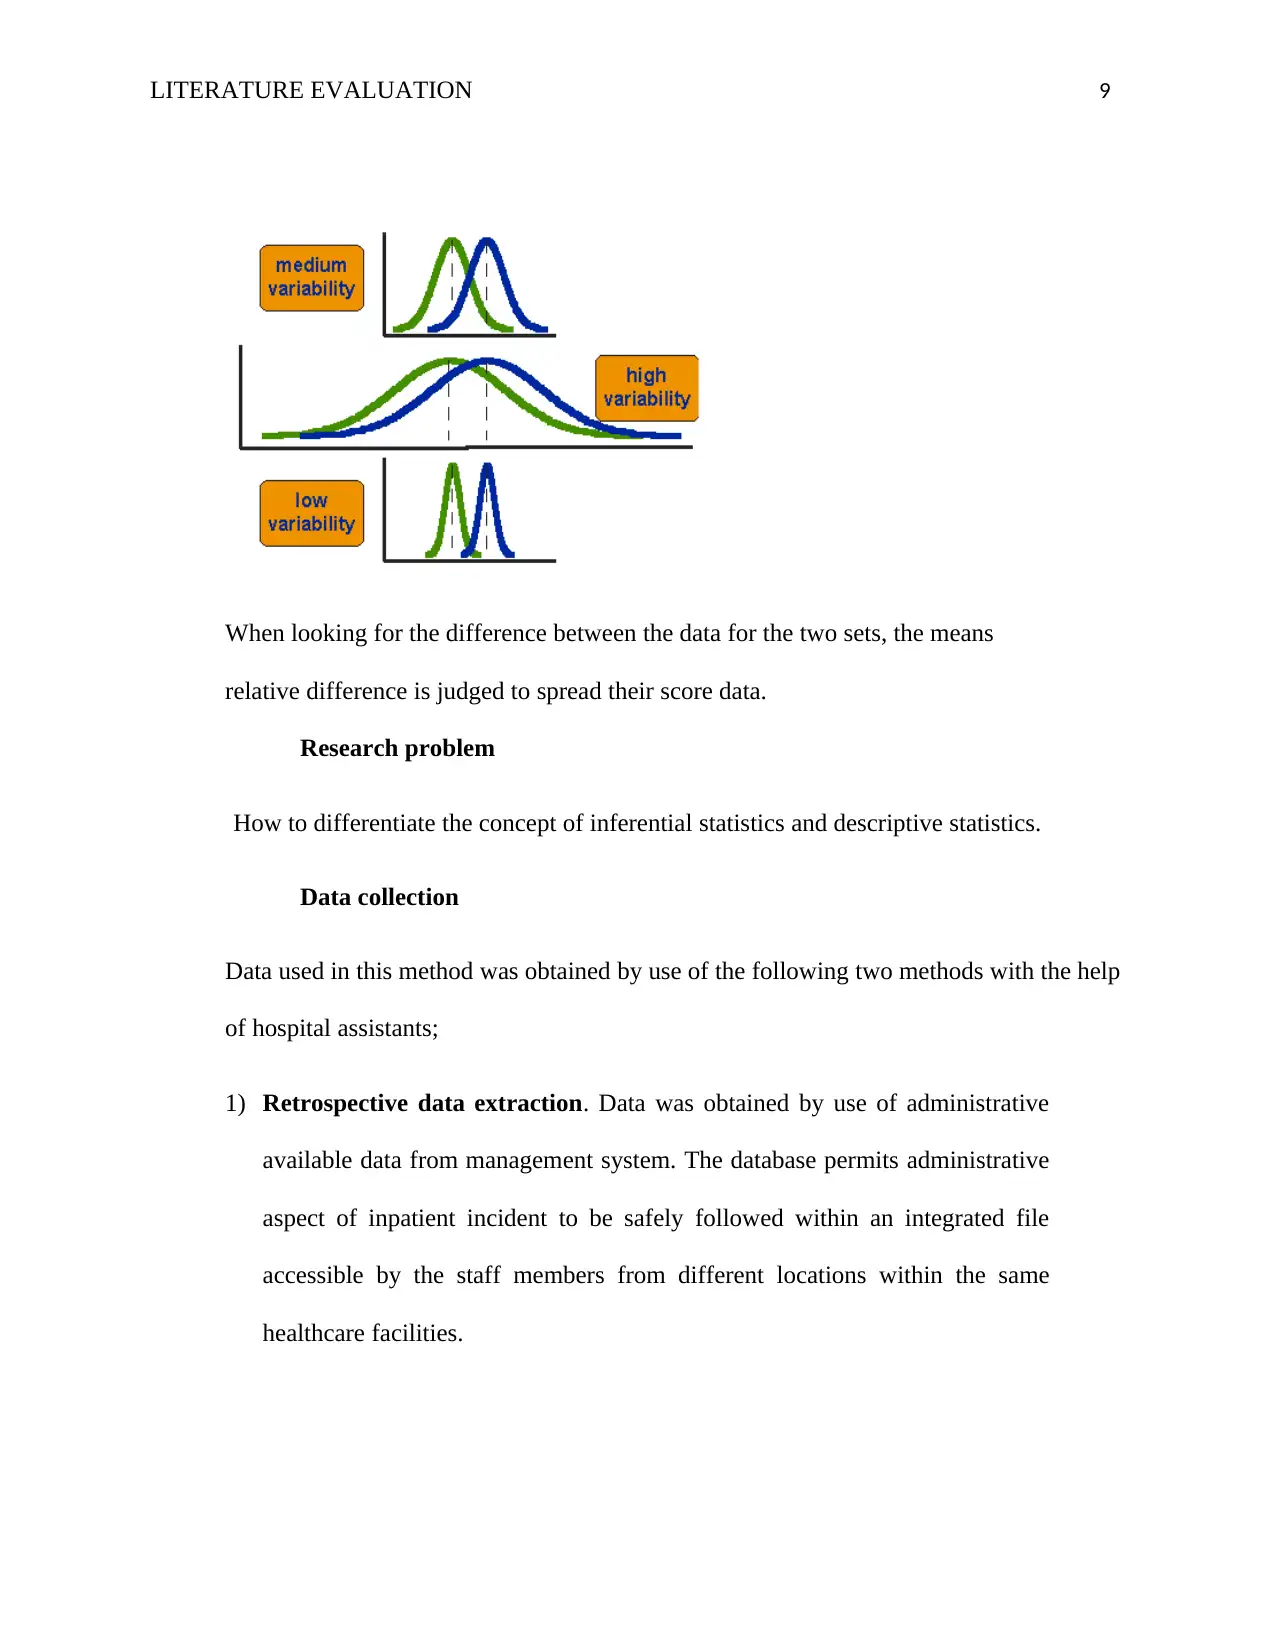
The above diagram shows the distribution for treated and control groups
of research. This designates where the treatment and control means are situated.
In higher variability, the set difference appears slightly striking because the
distribution (bell-shaped) overlaps. From the diagram below shows a case of high
variability, medium variability, and low variability (Swan, 2012).
extracted was transferred into a separate spreadsheet of Microsoft excel to ensure
full inpatient data is captured. Reliability analysis was performed to control the
consistency of data collected (Willig, 2013).
T-Test Paper
It evaluates whether the average of two sets are statistically different. It is
appropriate in comparing two groups example posttest randomized experimental
design.
The above diagram shows the distribution for treated and control groups
of research. This designates where the treatment and control means are situated.
In higher variability, the set difference appears slightly striking because the
distribution (bell-shaped) overlaps. From the diagram below shows a case of high
variability, medium variability, and low variability (Swan, 2012).
LITERATURE EVALUATION 9
When looking for the difference between the data for the two sets, the means
relative difference is judged to spread their score data.
Research problem
How to differentiate the concept of inferential statistics and descriptive statistics.
Data collection
Data used in this method was obtained by use of the following two methods with the help
of hospital assistants;
1) Retrospective data extraction. Data was obtained by use of administrative
available data from management system. The database permits administrative
aspect of inpatient incident to be safely followed within an integrated file
accessible by the staff members from different locations within the same
healthcare facilities.
⊘ This is a preview!⊘
Do you want full access?
Subscribe today to unlock all pages.
Trusted by 1+ million students worldwide
LITERATURE EVALUATION 10
2) Retrospective assessment of scanned records. Paper- based health records
were scanned by the medical record clerical staff forming a centralized digital
records.
Variables
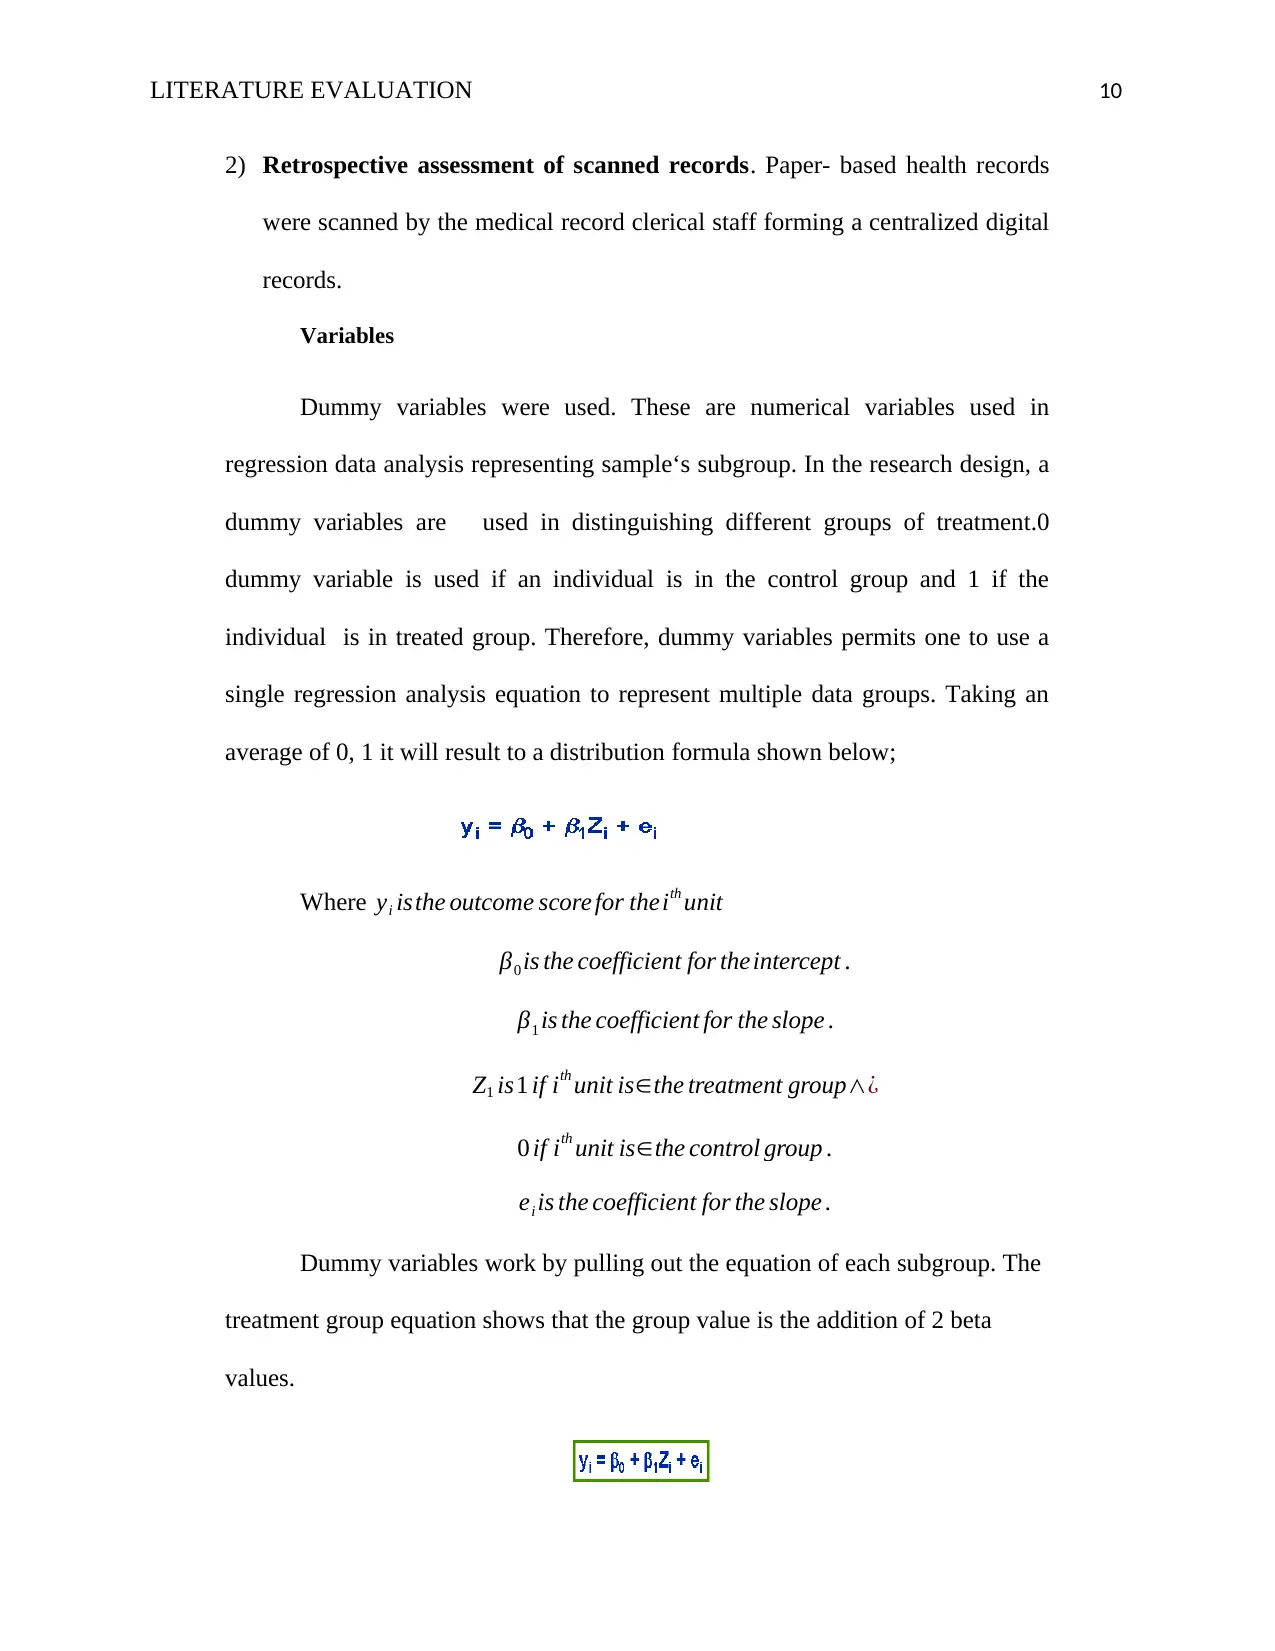
Dummy variables were used. These are numerical variables used in
regression data analysis representing sample‘s subgroup. In the research design, a
dummy variables are used in distinguishing different groups of treatment.0
dummy variable is used if an individual is in the control group and 1 if the
individual is in treated group. Therefore, dummy variables permits one to use a
single regression analysis equation to represent multiple data groups. Taking an
average of 0, 1 it will result to a distribution formula shown below;
Where yi isthe outcome score for theith unit
β0 is the coefficient for theintercept .
β1 is the coefficient for the slope .
Z1 is1 if ith unit is∈the treatment group∧¿
0 if ith unit is∈the control group .
ei is the coefficient for the slope .
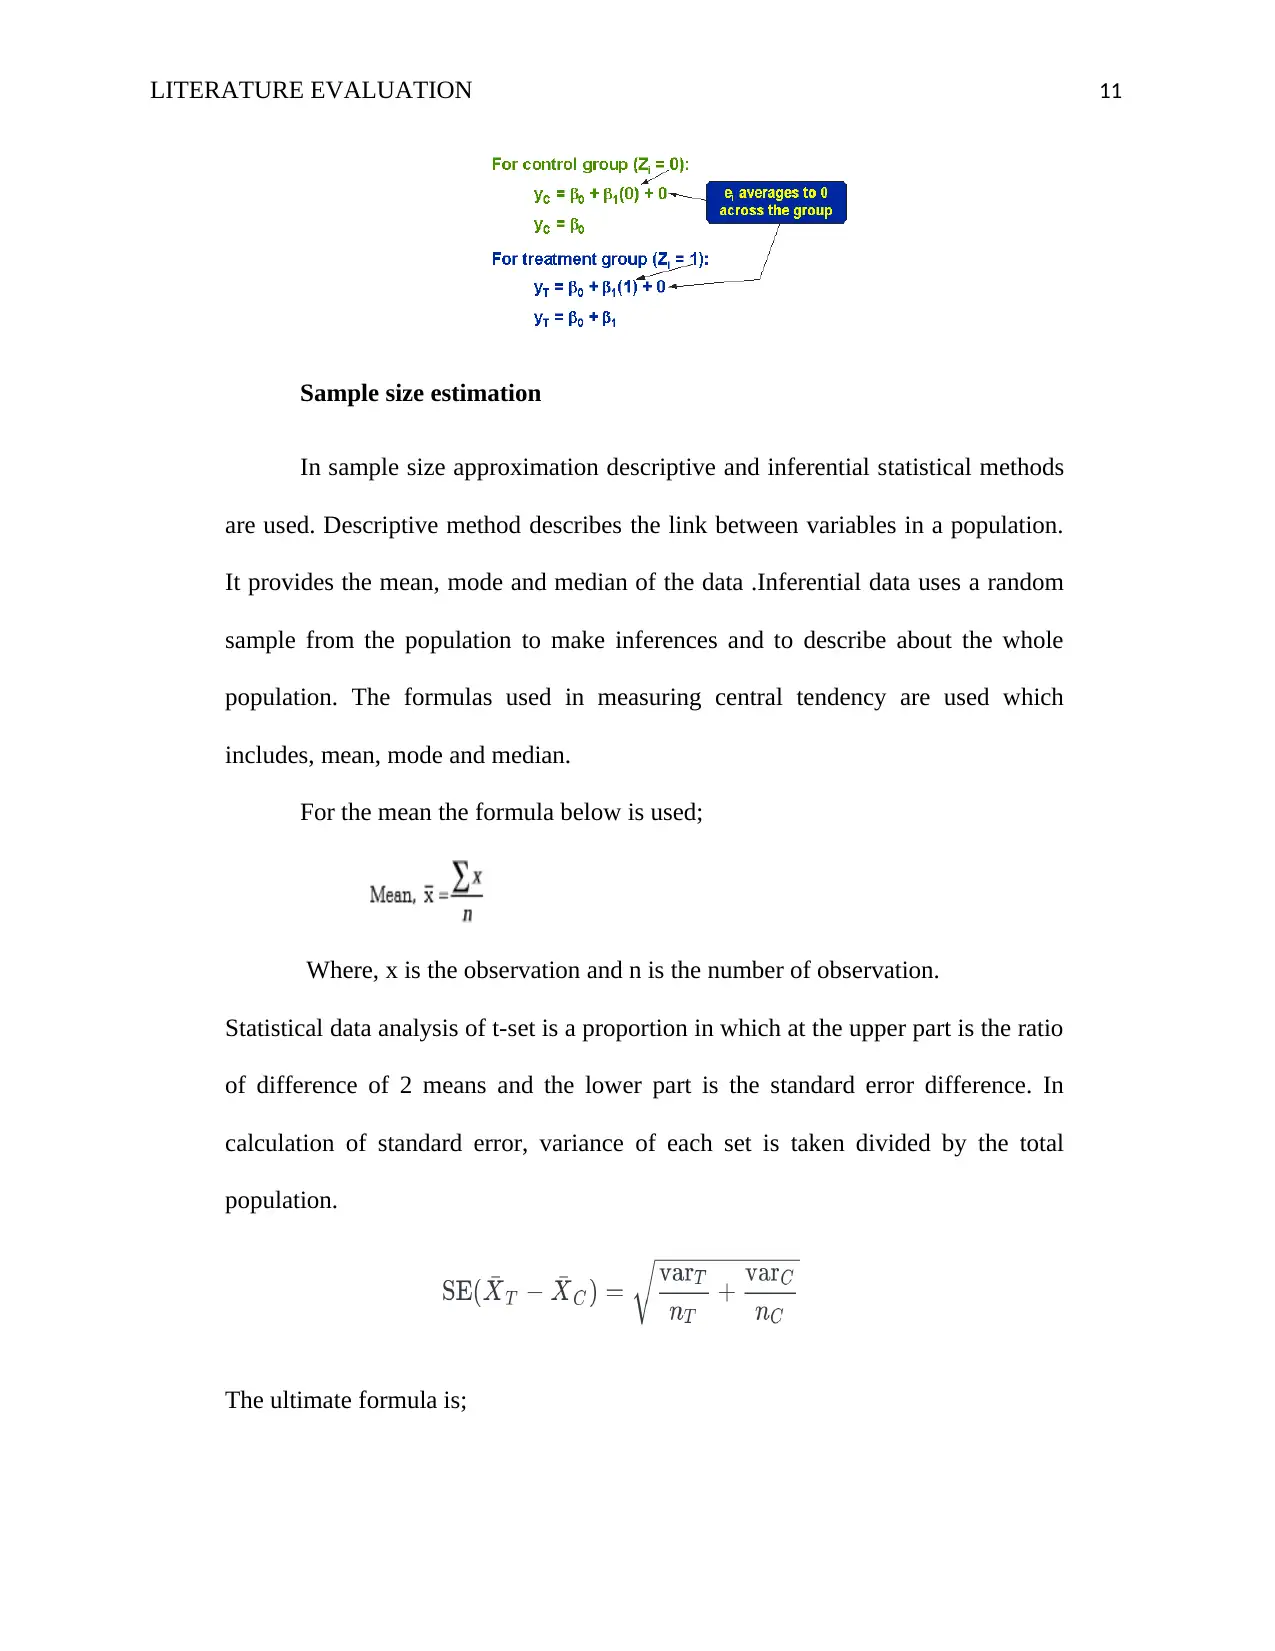
Dummy variables work by pulling out the equation of each subgroup. The
treatment group equation shows that the group value is the addition of 2 beta
values.
2) Retrospective assessment of scanned records. Paper- based health records
were scanned by the medical record clerical staff forming a centralized digital
records.
Variables
Dummy variables were used. These are numerical variables used in
regression data analysis representing sample‘s subgroup. In the research design, a
dummy variables are used in distinguishing different groups of treatment.0
dummy variable is used if an individual is in the control group and 1 if the
individual is in treated group. Therefore, dummy variables permits one to use a
single regression analysis equation to represent multiple data groups. Taking an
average of 0, 1 it will result to a distribution formula shown below;
Where yi isthe outcome score for theith unit
β0 is the coefficient for theintercept .
β1 is the coefficient for the slope .
Z1 is1 if ith unit is∈the treatment group∧¿
0 if ith unit is∈the control group .
ei is the coefficient for the slope .
Dummy variables work by pulling out the equation of each subgroup. The
treatment group equation shows that the group value is the addition of 2 beta
values.
Paraphrase This Document
Need a fresh take? Get an instant paraphrase of this document with our AI Paraphraser
LITERATURE EVALUATION 11
Sample size estimation
In sample size approximation descriptive and inferential statistical methods
are used. Descriptive method describes the link between variables in a population.
It provides the mean, mode and median of the data .Inferential data uses a random
sample from the population to make inferences and to describe about the whole
population. The formulas used in measuring central tendency are used which
includes, mean, mode and median.
For the mean the formula below is used;
Where, x is the observation and n is the number of observation.
Statistical data analysis of t-set is a proportion in which at the upper part is the ratio
of difference of 2 means and the lower part is the standard error difference. In
calculation of standard error, variance of each set is taken divided by the total
population.
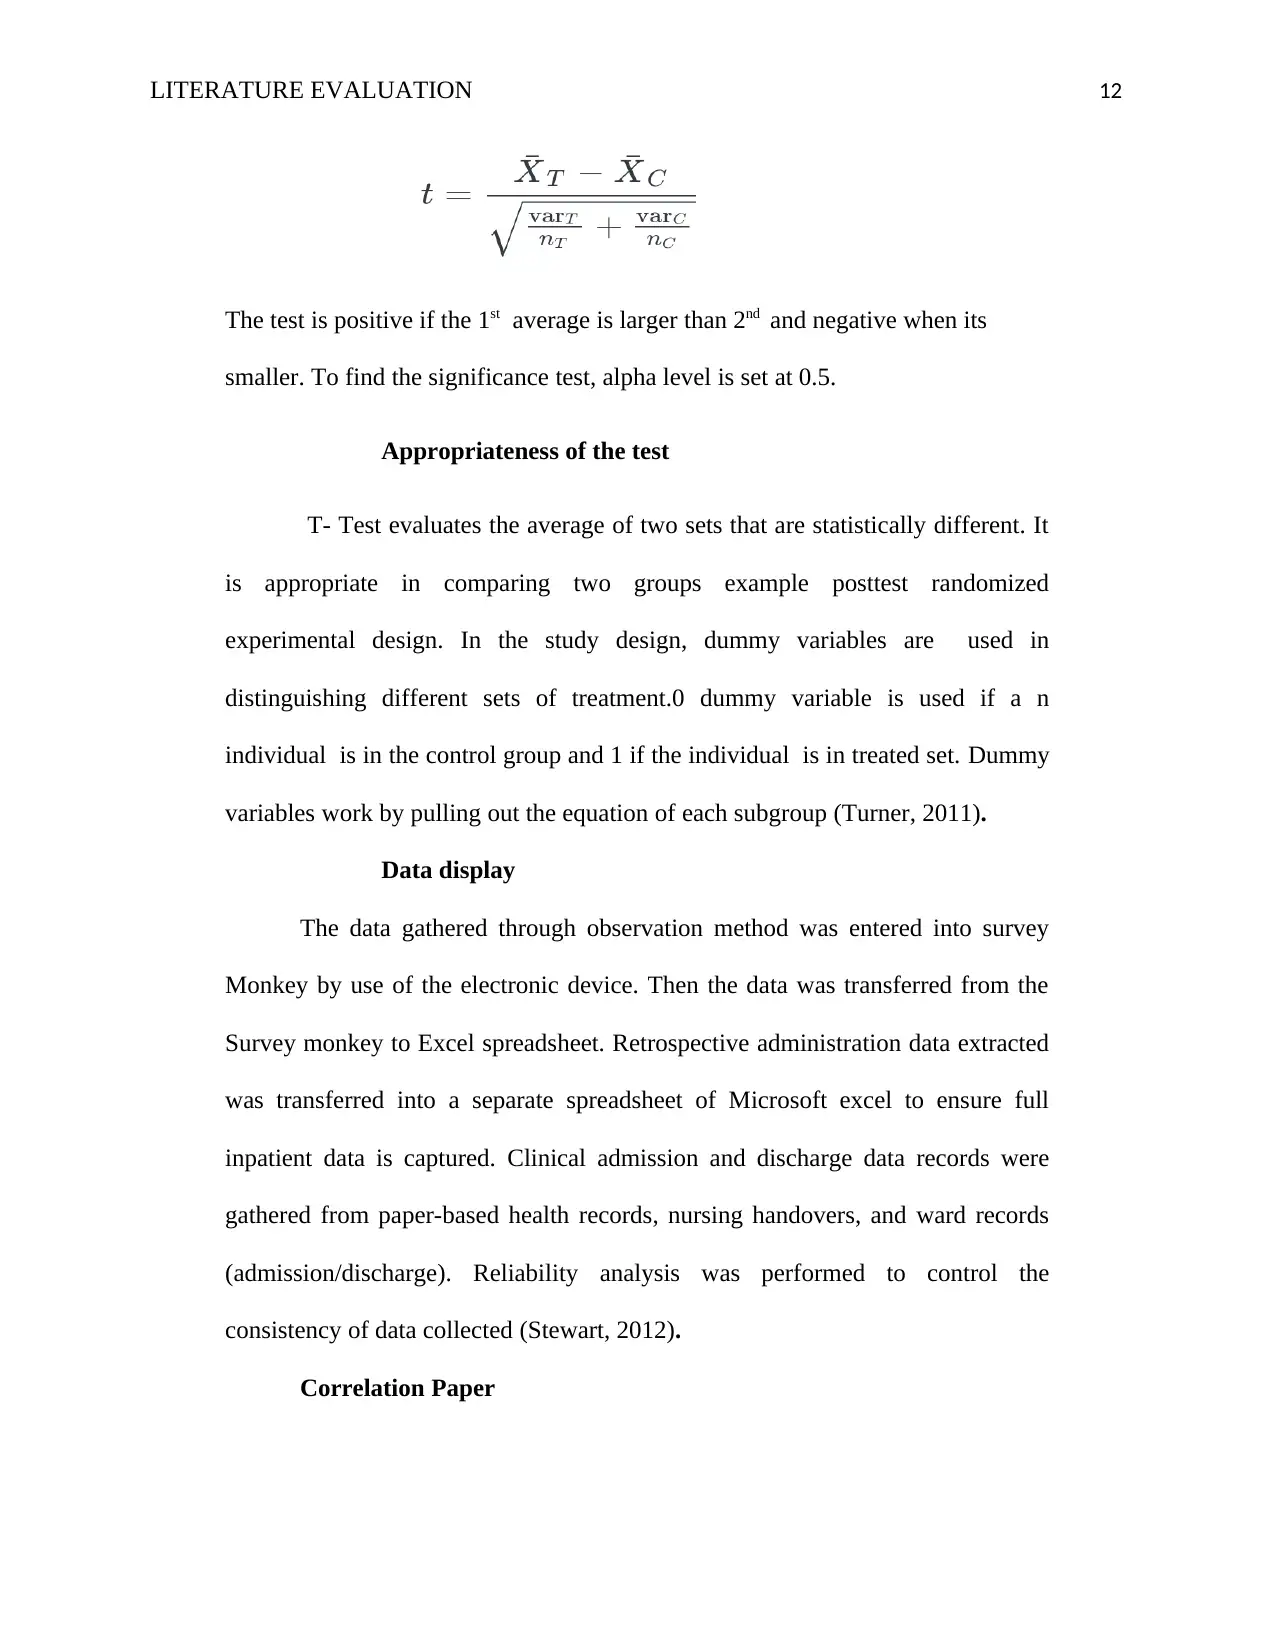
The ultimate formula is;
Sample size estimation
In sample size approximation descriptive and inferential statistical methods
are used. Descriptive method describes the link between variables in a population.
It provides the mean, mode and median of the data .Inferential data uses a random
sample from the population to make inferences and to describe about the whole
population. The formulas used in measuring central tendency are used which
includes, mean, mode and median.
For the mean the formula below is used;
Where, x is the observation and n is the number of observation.
Statistical data analysis of t-set is a proportion in which at the upper part is the ratio
of difference of 2 means and the lower part is the standard error difference. In
calculation of standard error, variance of each set is taken divided by the total
population.
The ultimate formula is;
LITERATURE EVALUATION 12
The test is positive if the 1st average is larger than 2nd and negative when its
smaller. To find the significance test, alpha level is set at 0.5.
Appropriateness of the test
T- Test evaluates the average of two sets that are statistically different. It
is appropriate in comparing two groups example posttest randomized
experimental design. In the study design, dummy variables are used in
distinguishing different sets of treatment.0 dummy variable is used if a n
individual is in the control group and 1 if the individual is in treated set. Dummy
variables work by pulling out the equation of each subgroup (Turner, 2011).
Data display
The data gathered through observation method was entered into survey
Monkey by use of the electronic device. Then the data was transferred from the
Survey monkey to Excel spreadsheet. Retrospective administration data extracted
was transferred into a separate spreadsheet of Microsoft excel to ensure full
inpatient data is captured. Clinical admission and discharge data records were
gathered from paper-based health records, nursing handovers, and ward records
(admission/discharge). Reliability analysis was performed to control the
consistency of data collected (Stewart, 2012).
Correlation Paper
⊘ This is a preview!⊘
Do you want full access?
Subscribe today to unlock all pages.
Trusted by 1+ million students worldwide
1 out of 18
Related Documents


Your All-in-One AI-Powered Toolkit for Academic Success.
+13062052269
info@desklib.com
Available 24*7 on WhatsApp / Email
![[object Object]](/_next/static/media/star-bottom.7253800d.svg)
Unlock your academic potential
Copyright © 2020–2026 A2Z Services. All Rights Reserved. Developed and managed by ZUCOL.