A Cross-Cultural Study on Advertising Language: UK vs. China Analysis
VerifiedAdded on 2020/01/28
|23
|5445
|66
Report
AI Summary
This report presents a cross-cultural study comparing advertising language preferences between the United Kingdom and China, focusing on the impact of cultural dimensions on consumer responses to advertisements. The research utilizes Hofstede's cultural dimensions model to analyze differences in individualism, uncertainty avoidance, indulgence, power distance, masculinity, and long-term orientation. The study employs SPSS for statistical analysis, including independent t-tests, to determine the significance of findings related to Missguided's advertising language. The results reveal variations in consumer behavior and preferences between the two countries, highlighting the influence of cultural values on advertising effectiveness. The analysis includes respondent profiles, raw data findings, and mean score comparisons for each dimension, providing a comprehensive understanding of how cultural factors shape advertising strategies and consumer perceptions in a global context. The report concludes by emphasizing the importance of considering cultural nuances in marketing campaigns to resonate with target audiences effectively.
SPSS
Paraphrase This Document
Need a fresh take? Get an instant paraphrase of this document with our AI Paraphraser
TABLE OF CONTENTS
Chapter 4: Results and Discussion.......................................................................................................
4.1 Introduction............................................................................................................................1
4.2 Respondents Profiles..............................................................................................................1
4.3 Raw data findings (Find mean scores differences UK vs Chinese using Hofstede Model). .2
4.4 Independent T-Test to determine whether findings are statistically significant in line with
Hofstede’s research......................................................................................................................3
Mean Scores for identified Themes and Dimensions..................................................................4
4.4 Computing correlation between factors that affects the nationality....................................19
References..........................................................................................................................................
CHAPTER 4: RESULTS AND DISCUSSION
4.1 Introduction
Data analysis is one of the most significant sections of the study because it presents the
analysis of data which are collected through primary and secondary sources. According to the
present study, researcher focuses on analyzing the gathered information related to the differences
in response towards advertising language seen in Misguides adverts on social media platform: A
cross-cultural study between British and Chinese. Further, the result presented in this chapter are
the outcomes generated of the primary research questionnaire which was based on the questions
used on Hofstede’s cultural dimensions research. In this section, researcher concentrates on
respondent’s profile, as well as make use of statistical t-test by the means of SPSS against each
of the six cultural dimensions being investigated.
4.2 Respondents Profiles
Nationality Respondents %
China 40 53
UK 35 47
Residence Respondents %
China 33 44
UK 42 56
Age Respondents %
18-25 56 75
26-33 17 23
34-49 2 3
50+ 0 0
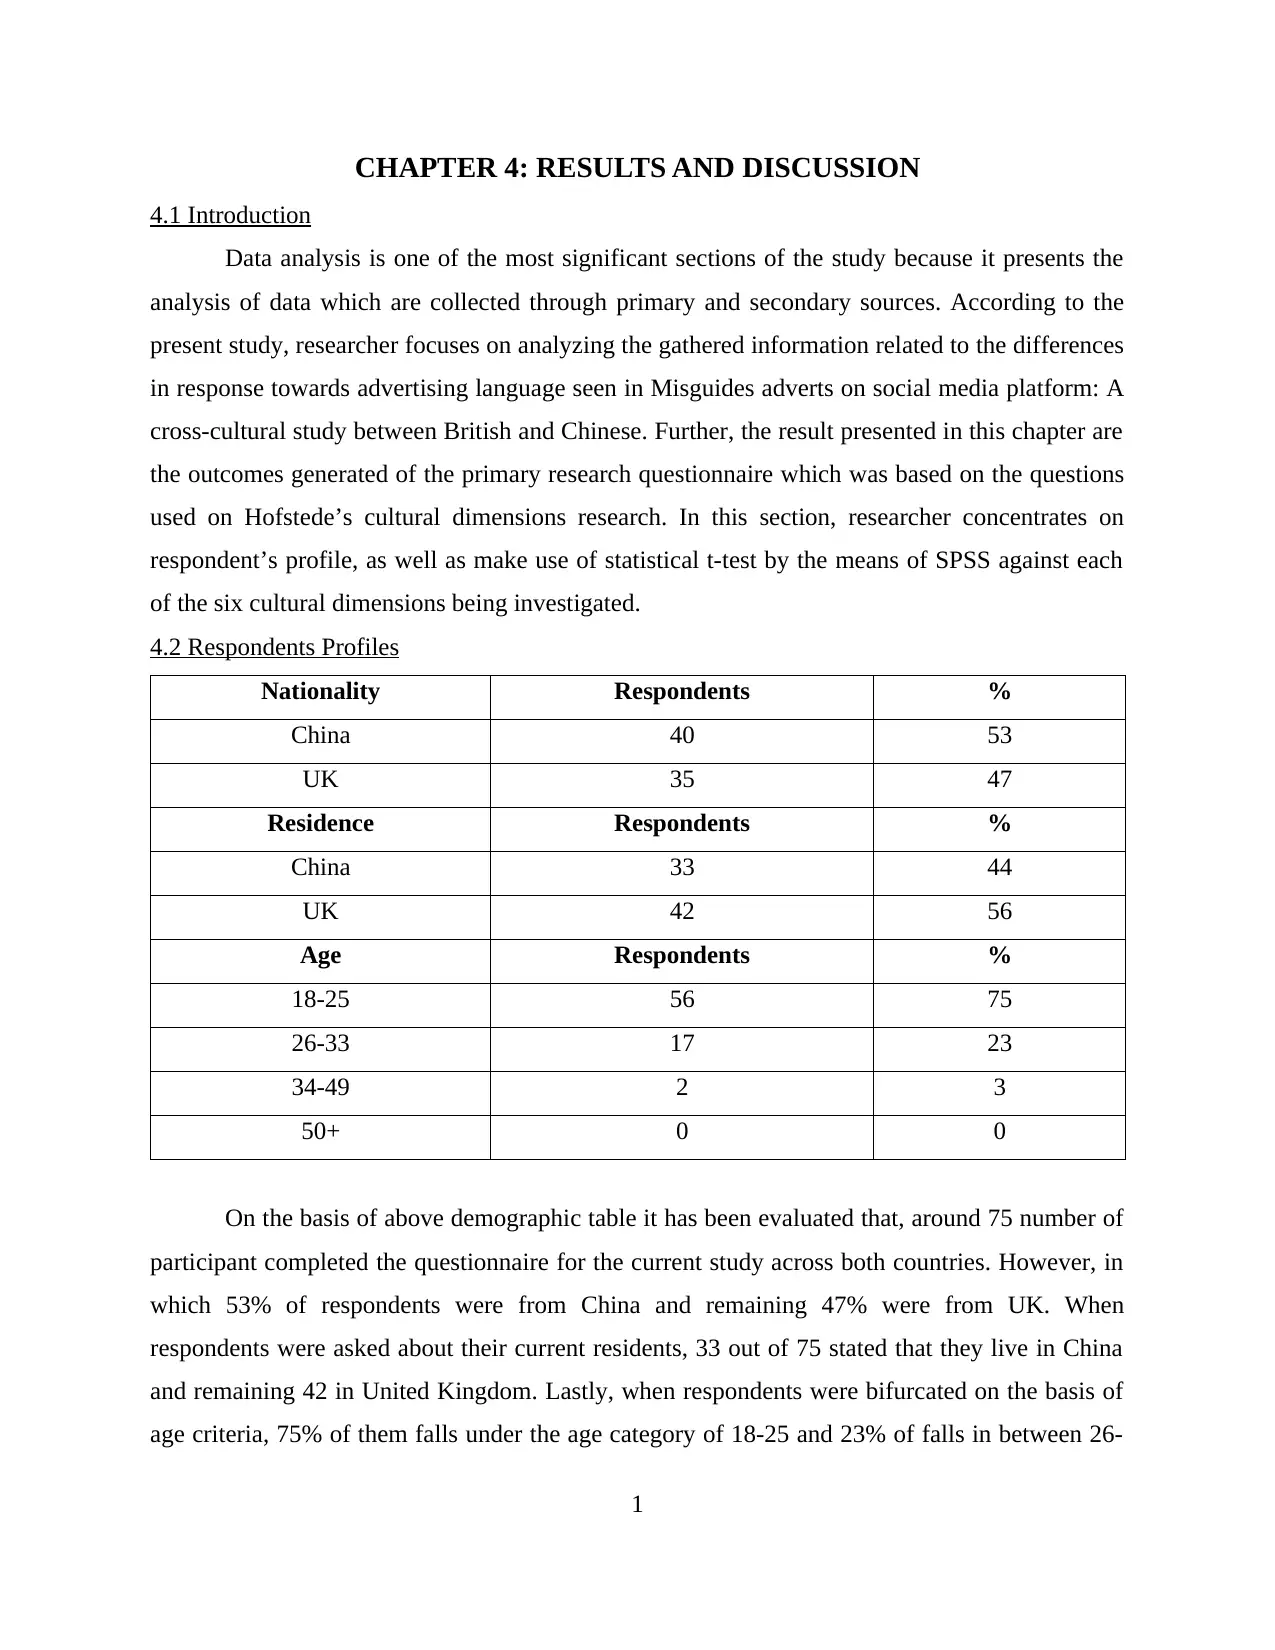
On the basis of above demographic table it has been evaluated that, around 75 number of
participant completed the questionnaire for the current study across both countries. However, in
which 53% of respondents were from China and remaining 47% were from UK. When
respondents were asked about their current residents, 33 out of 75 stated that they live in China
and remaining 42 in United Kingdom. Lastly, when respondents were bifurcated on the basis of
age criteria, 75% of them falls under the age category of 18-25 and 23% of falls in between 26-
1
4.1 Introduction
Data analysis is one of the most significant sections of the study because it presents the
analysis of data which are collected through primary and secondary sources. According to the
present study, researcher focuses on analyzing the gathered information related to the differences
in response towards advertising language seen in Misguides adverts on social media platform: A
cross-cultural study between British and Chinese. Further, the result presented in this chapter are
the outcomes generated of the primary research questionnaire which was based on the questions
used on Hofstede’s cultural dimensions research. In this section, researcher concentrates on
respondent’s profile, as well as make use of statistical t-test by the means of SPSS against each
of the six cultural dimensions being investigated.
4.2 Respondents Profiles
Nationality Respondents %
China 40 53
UK 35 47
Residence Respondents %
China 33 44
UK 42 56
Age Respondents %
18-25 56 75
26-33 17 23
34-49 2 3
50+ 0 0
On the basis of above demographic table it has been evaluated that, around 75 number of
participant completed the questionnaire for the current study across both countries. However, in
which 53% of respondents were from China and remaining 47% were from UK. When
respondents were asked about their current residents, 33 out of 75 stated that they live in China
and remaining 42 in United Kingdom. Lastly, when respondents were bifurcated on the basis of
age criteria, 75% of them falls under the age category of 18-25 and 23% of falls in between 26-
1
⊘ This is a preview!⊘
Do you want full access?
Subscribe today to unlock all pages.
Trusted by 1+ million students worldwide
33 and only 3% of people were from the age of 34-49 and lastly, there were no respondents who
are 50 plus in terms of their age.
4.3 Raw data findings (Find mean scores differences UK vs Chinese using Hofstede Model)
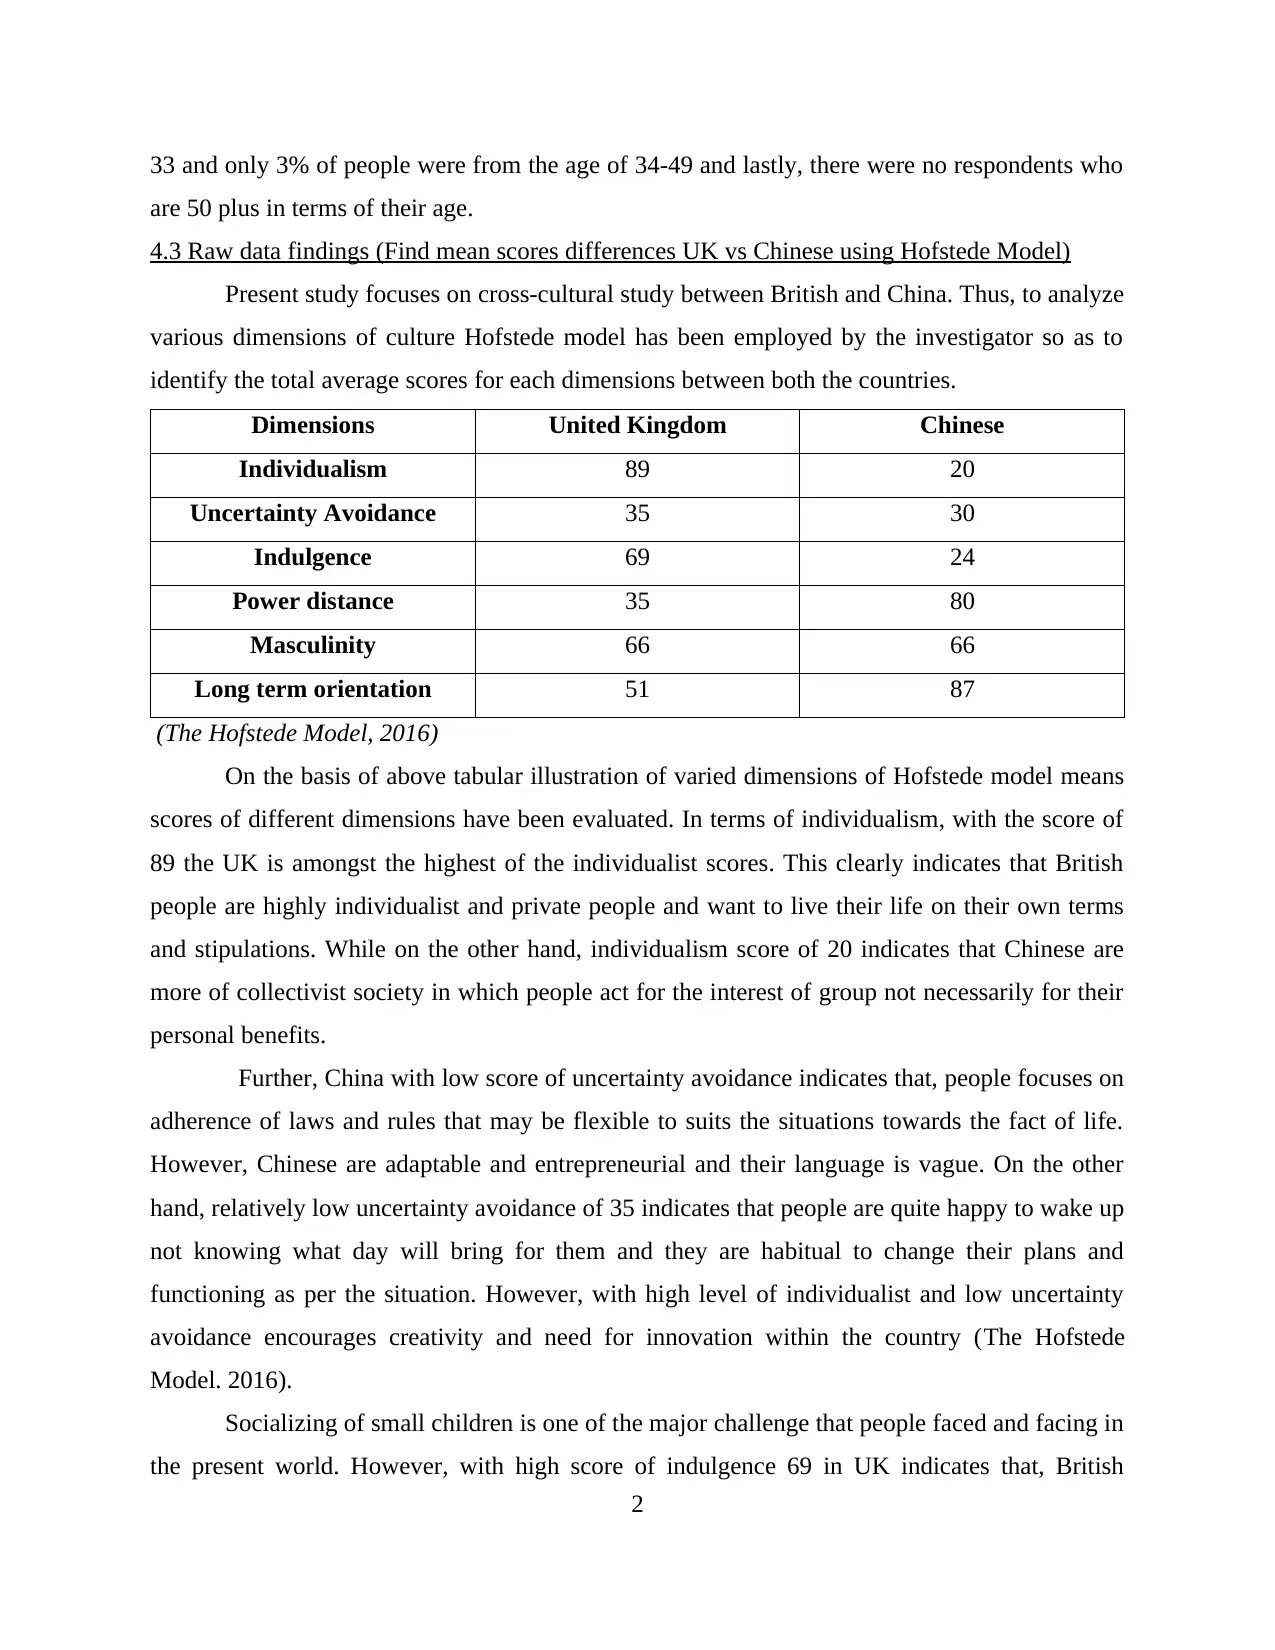
Present study focuses on cross-cultural study between British and China. Thus, to analyze
various dimensions of culture Hofstede model has been employed by the investigator so as to
identify the total average scores for each dimensions between both the countries.
Dimensions United Kingdom Chinese
Individualism 89 20
Uncertainty Avoidance 35 30
Indulgence 69 24
Power distance 35 80
Masculinity 66 66
Long term orientation 51 87
(The Hofstede Model, 2016)
On the basis of above tabular illustration of varied dimensions of Hofstede model means
scores of different dimensions have been evaluated. In terms of individualism, with the score of
89 the UK is amongst the highest of the individualist scores. This clearly indicates that British
people are highly individualist and private people and want to live their life on their own terms
and stipulations. While on the other hand, individualism score of 20 indicates that Chinese are
more of collectivist society in which people act for the interest of group not necessarily for their
personal benefits.
Further, China with low score of uncertainty avoidance indicates that, people focuses on
adherence of laws and rules that may be flexible to suits the situations towards the fact of life.
However, Chinese are adaptable and entrepreneurial and their language is vague. On the other
hand, relatively low uncertainty avoidance of 35 indicates that people are quite happy to wake up
not knowing what day will bring for them and they are habitual to change their plans and
functioning as per the situation. However, with high level of individualist and low uncertainty
avoidance encourages creativity and need for innovation within the country (The Hofstede
Model. 2016).
Socializing of small children is one of the major challenge that people faced and facing in
the present world. However, with high score of indulgence 69 in UK indicates that, British
2
are 50 plus in terms of their age.
4.3 Raw data findings (Find mean scores differences UK vs Chinese using Hofstede Model)
Present study focuses on cross-cultural study between British and China. Thus, to analyze
various dimensions of culture Hofstede model has been employed by the investigator so as to
identify the total average scores for each dimensions between both the countries.
Dimensions United Kingdom Chinese
Individualism 89 20
Uncertainty Avoidance 35 30
Indulgence 69 24
Power distance 35 80
Masculinity 66 66
Long term orientation 51 87
(The Hofstede Model, 2016)
On the basis of above tabular illustration of varied dimensions of Hofstede model means
scores of different dimensions have been evaluated. In terms of individualism, with the score of
89 the UK is amongst the highest of the individualist scores. This clearly indicates that British
people are highly individualist and private people and want to live their life on their own terms
and stipulations. While on the other hand, individualism score of 20 indicates that Chinese are
more of collectivist society in which people act for the interest of group not necessarily for their
personal benefits.
Further, China with low score of uncertainty avoidance indicates that, people focuses on
adherence of laws and rules that may be flexible to suits the situations towards the fact of life.
However, Chinese are adaptable and entrepreneurial and their language is vague. On the other
hand, relatively low uncertainty avoidance of 35 indicates that people are quite happy to wake up
not knowing what day will bring for them and they are habitual to change their plans and
functioning as per the situation. However, with high level of individualist and low uncertainty
avoidance encourages creativity and need for innovation within the country (The Hofstede
Model. 2016).
Socializing of small children is one of the major challenge that people faced and facing in
the present world. However, with high score of indulgence 69 in UK indicates that, British
2
Paraphrase This Document
Need a fresh take? Get an instant paraphrase of this document with our AI Paraphraser
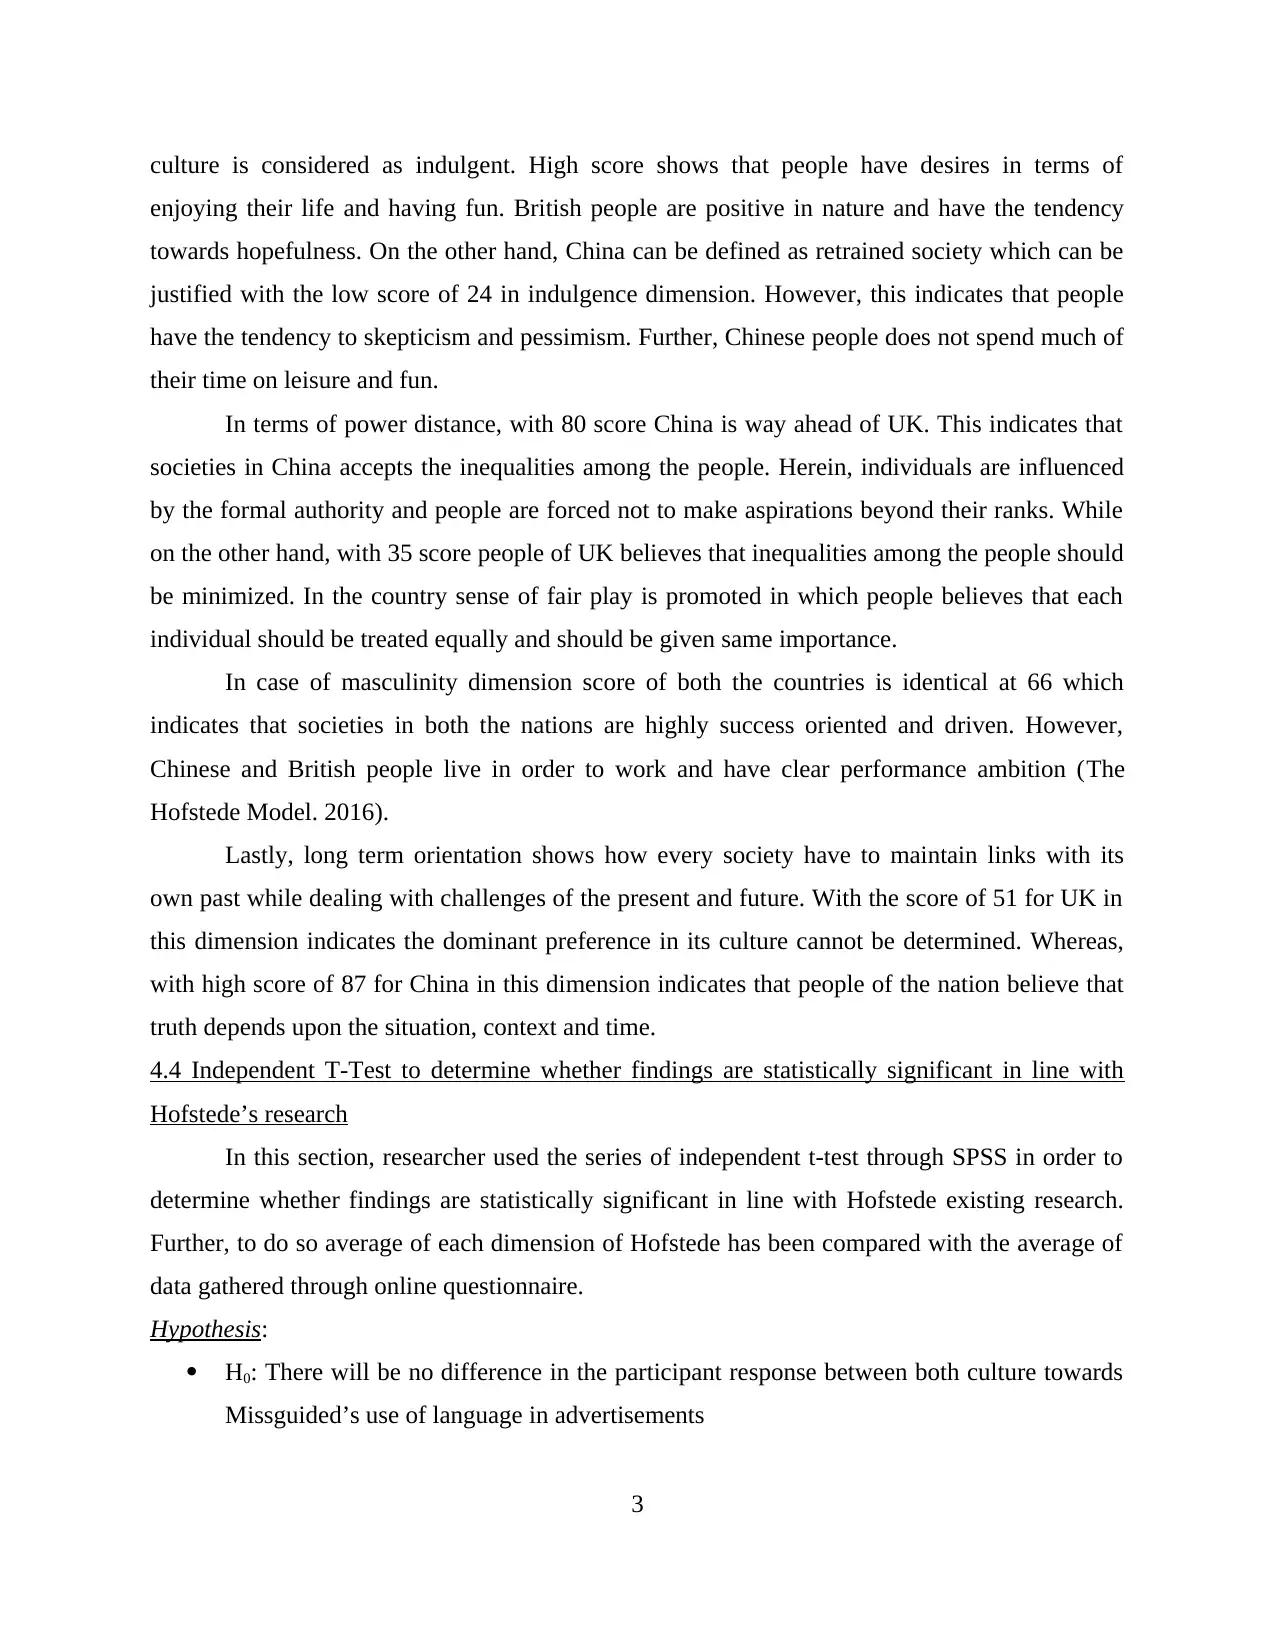
culture is considered as indulgent. High score shows that people have desires in terms of
enjoying their life and having fun. British people are positive in nature and have the tendency
towards hopefulness. On the other hand, China can be defined as retrained society which can be
justified with the low score of 24 in indulgence dimension. However, this indicates that people
have the tendency to skepticism and pessimism. Further, Chinese people does not spend much of
their time on leisure and fun.
In terms of power distance, with 80 score China is way ahead of UK. This indicates that
societies in China accepts the inequalities among the people. Herein, individuals are influenced
by the formal authority and people are forced not to make aspirations beyond their ranks. While
on the other hand, with 35 score people of UK believes that inequalities among the people should
be minimized. In the country sense of fair play is promoted in which people believes that each
individual should be treated equally and should be given same importance.
In case of masculinity dimension score of both the countries is identical at 66 which
indicates that societies in both the nations are highly success oriented and driven. However,
Chinese and British people live in order to work and have clear performance ambition (The
Hofstede Model. 2016).
Lastly, long term orientation shows how every society have to maintain links with its
own past while dealing with challenges of the present and future. With the score of 51 for UK in
this dimension indicates the dominant preference in its culture cannot be determined. Whereas,
with high score of 87 for China in this dimension indicates that people of the nation believe that
truth depends upon the situation, context and time.
4.4 Independent T-Test to determine whether findings are statistically significant in line with
Hofstede’s research
In this section, researcher used the series of independent t-test through SPSS in order to
determine whether findings are statistically significant in line with Hofstede existing research.
Further, to do so average of each dimension of Hofstede has been compared with the average of
data gathered through online questionnaire.
Hypothesis:
H0: There will be no difference in the participant response between both culture towards
Missguided’s use of language in advertisements
3
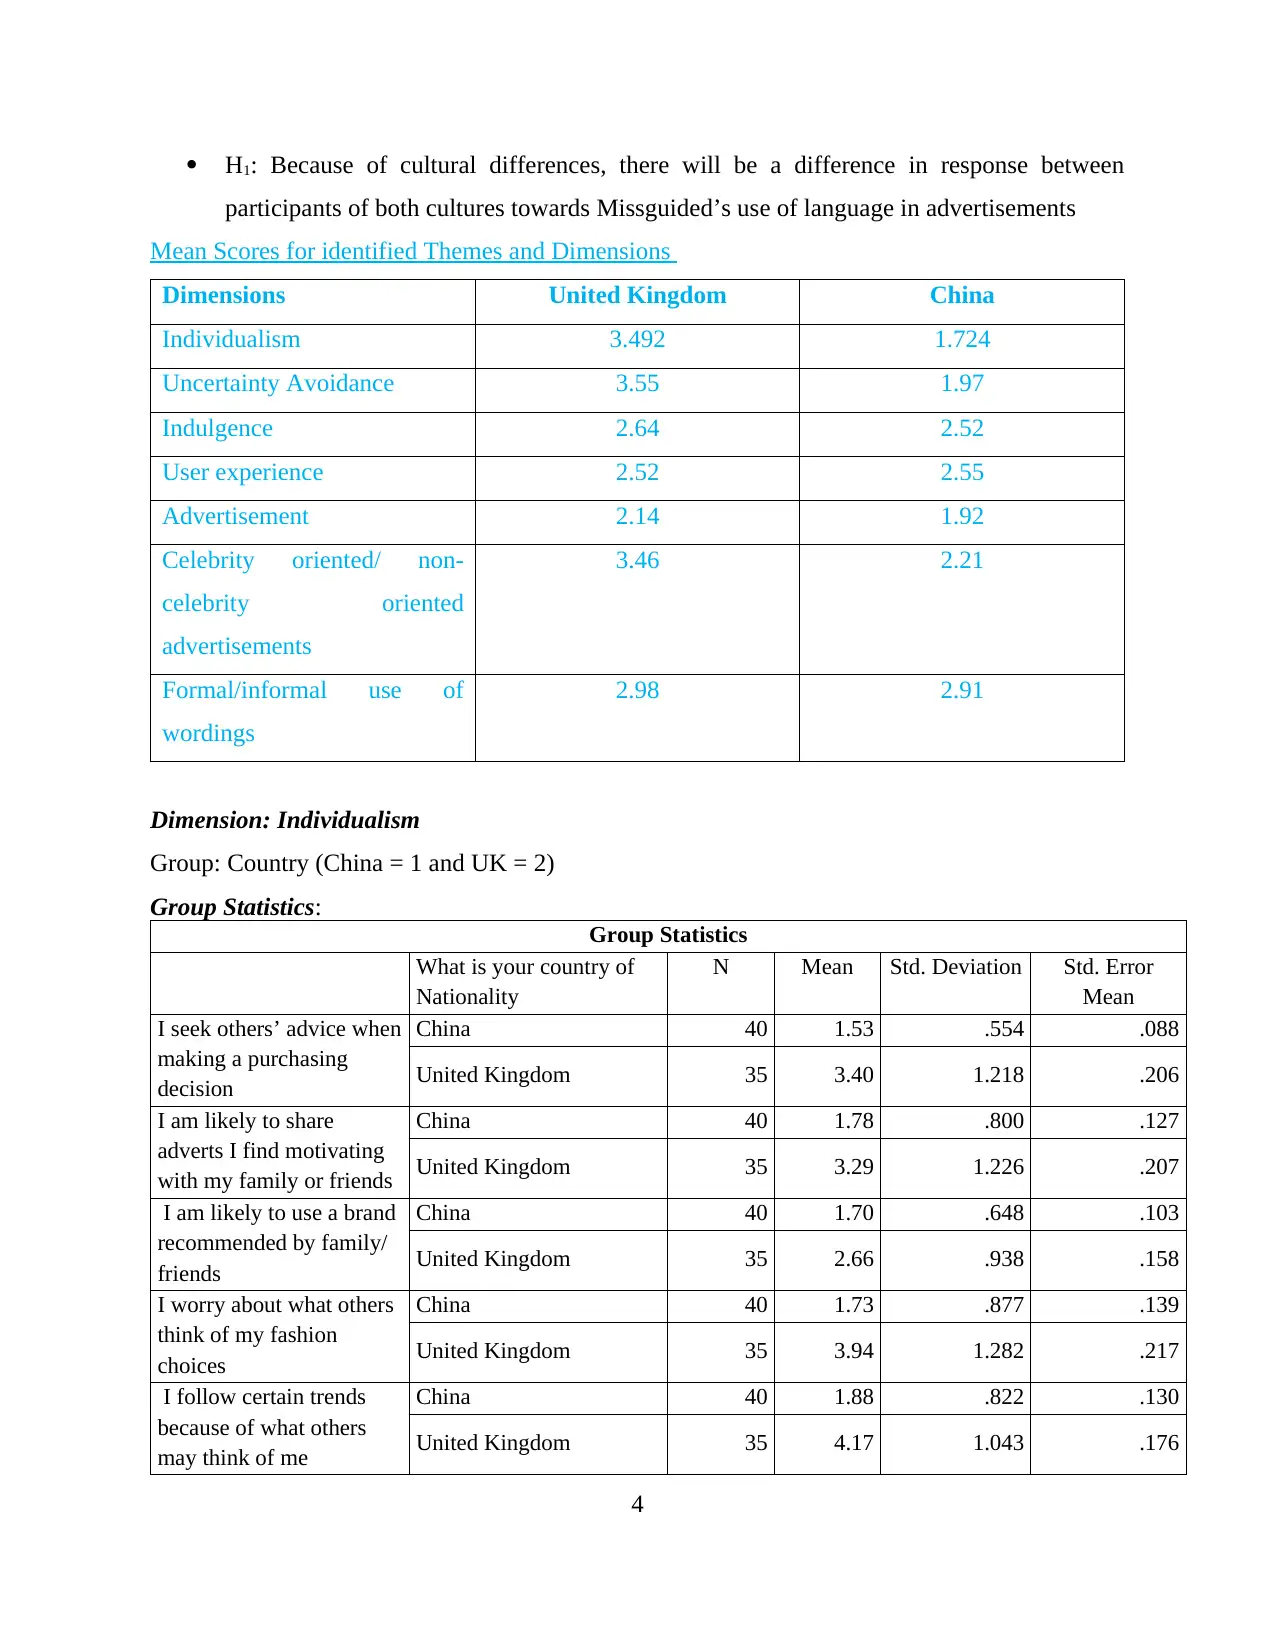
H1: Because of cultural differences, there will be a difference in response between
participants of both cultures towards Missguided’s use of language in advertisements
Mean Scores for identified Themes and Dimensions
Dimensions United Kingdom China
Individualism 3.492 1.724
Uncertainty Avoidance 3.55 1.97
Indulgence 2.64 2.52
User experience 2.52 2.55
Advertisement 2.14 1.92
Celebrity oriented/ non-
celebrity oriented
advertisements
3.46 2.21
Formal/informal use of
wordings
2.98 2.91
Dimension: Individualism
Group: Country (China = 1 and UK = 2)
Group Statistics:
Group Statistics
What is your country of
Nationality
N Mean Std. Deviation Std. Error
Mean
I seek others’ advice when
making a purchasing
decision
China 40 1.53 .554 .088
United Kingdom 35 3.40 1.218 .206
I am likely to share
adverts I find motivating
with my family or friends
China 40 1.78 .800 .127
United Kingdom 35 3.29 1.226 .207
I am likely to use a brand
recommended by family/
friends
China 40 1.70 .648 .103
United Kingdom 35 2.66 .938 .158
I worry about what others
think of my fashion
choices
China 40 1.73 .877 .139
United Kingdom 35 3.94 1.282 .217
I follow certain trends
because of what others
may think of me
China 40 1.88 .822 .130
United Kingdom 35 4.17 1.043 .176
4
⊘ This is a preview!⊘
Do you want full access?
Subscribe today to unlock all pages.
Trusted by 1+ million students worldwide
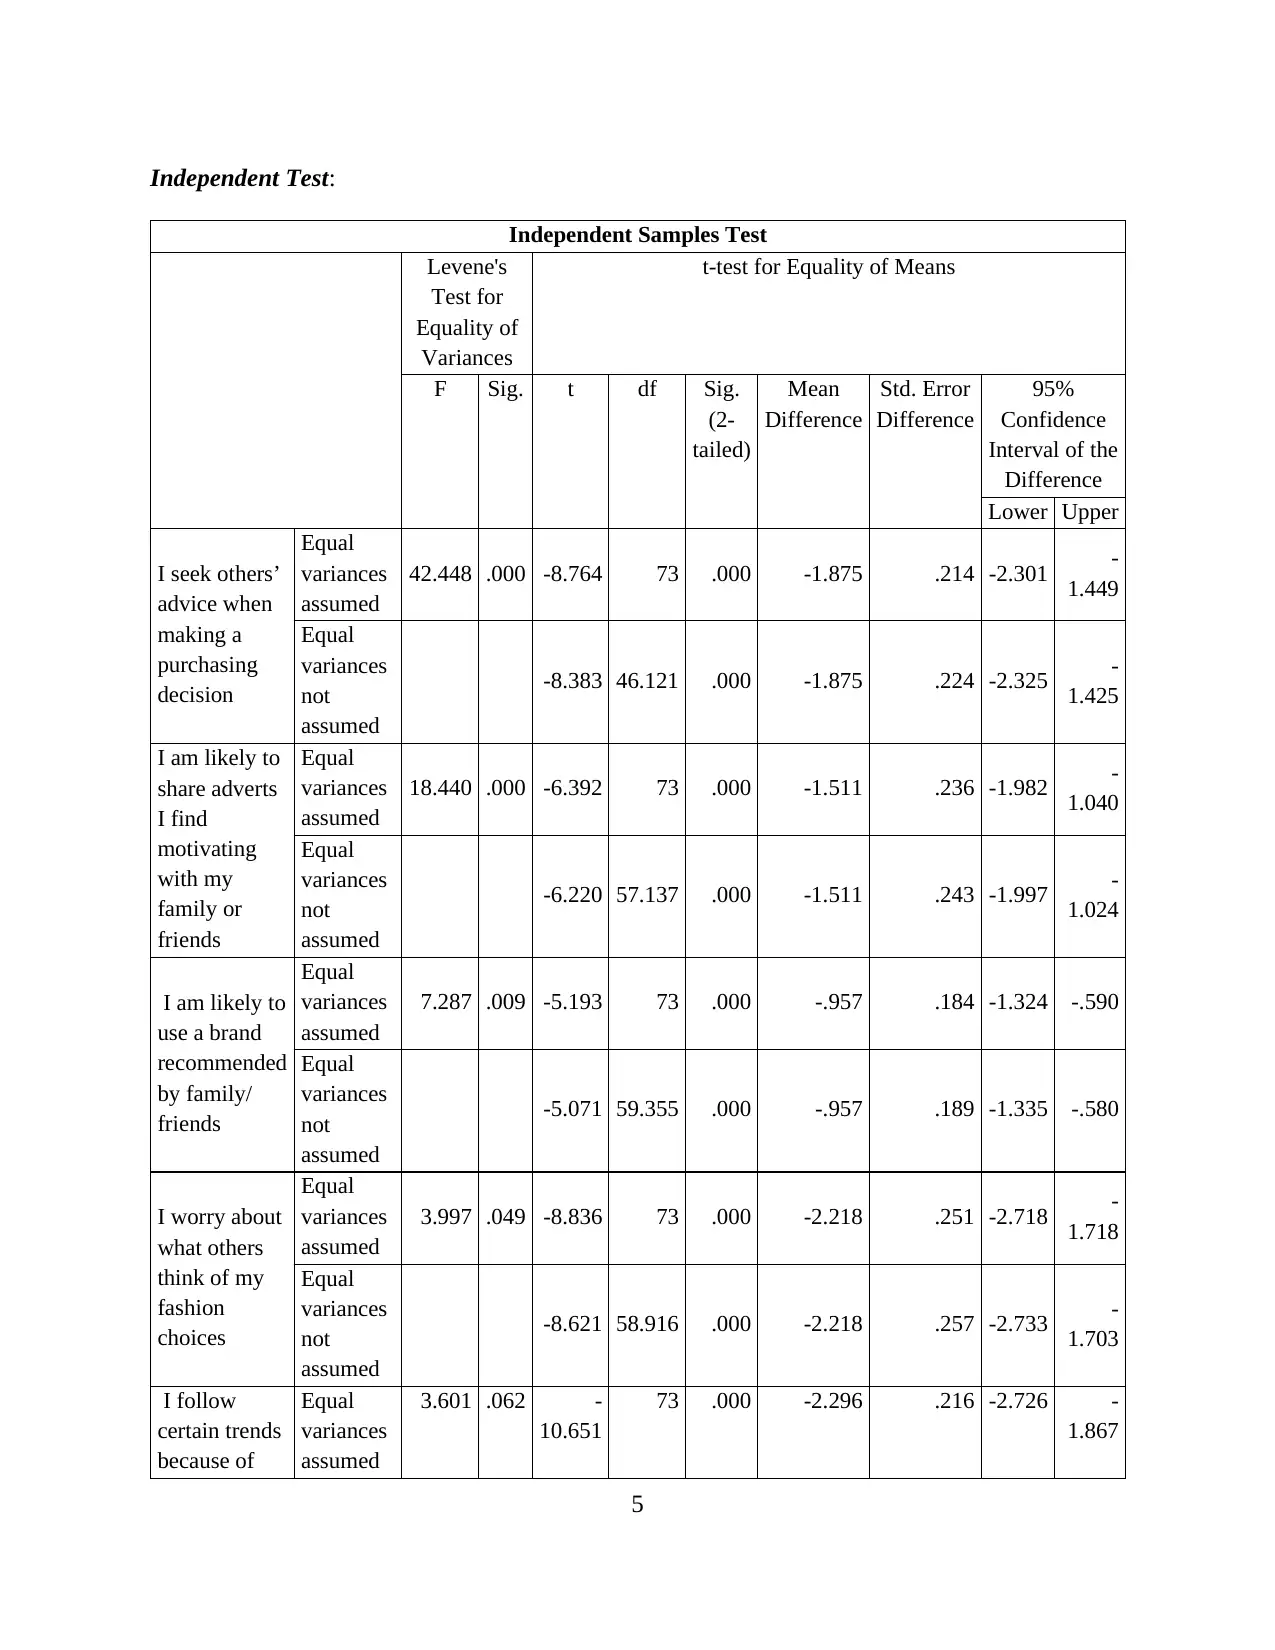
Independent Test:
Independent Samples Test
Levene's
Test for
Equality of
Variances
t-test for Equality of Means
F Sig. t df Sig.
(2-
tailed)
Mean
Difference
Std. Error
Difference
95%
Confidence
Interval of the
Difference
Lower Upper
I seek others’
advice when
making a
purchasing
decision
Equal
variances
assumed
42.448 .000 -8.764 73 .000 -1.875 .214 -2.301 -
1.449
Equal
variances
not
assumed
-8.383 46.121 .000 -1.875 .224 -2.325 -
1.425
I am likely to
share adverts
I find
motivating
with my
family or
friends
Equal
variances
assumed
18.440 .000 -6.392 73 .000 -1.511 .236 -1.982 -
1.040
Equal
variances
not
assumed
-6.220 57.137 .000 -1.511 .243 -1.997 -
1.024
I am likely to
use a brand
recommended
by family/
friends
Equal
variances
assumed
7.287 .009 -5.193 73 .000 -.957 .184 -1.324 -.590
Equal
variances
not
assumed
-5.071 59.355 .000 -.957 .189 -1.335 -.580
I worry about
what others
think of my
fashion
choices
Equal
variances
assumed
3.997 .049 -8.836 73 .000 -2.218 .251 -2.718 -
1.718
Equal
variances
not
assumed
-8.621 58.916 .000 -2.218 .257 -2.733 -
1.703
I follow
certain trends
because of
Equal
variances
assumed
3.601 .062 -
10.651
73 .000 -2.296 .216 -2.726 -
1.867
5
Paraphrase This Document
Need a fresh take? Get an instant paraphrase of this document with our AI Paraphraser
what others
may think of
me
Equal
variances
not
assumed
-
10.484 64.437 .000 -2.296 .219 -2.734 -
1.859
Interpretation:
On the basis of above computation, caparison between total dimension score for
individualism between participants in the UK and China has been conducted. However, it has
been identified that, with the lower mean value in all the questions asked from Chinese
participants it has been analyzed that they are collectivist in nature while on the other hand,
higher mean value in all the questions for British people indicates that they are individualist in
nature and require no guidance in buying products. Further, with the significance value of less
than 0.05 indicates that alternative hypothesis has been accepted and null hypothesis has been
rejected. Thus, it can be said that, cultural differences leads to difference in response between
participants of both cultures towards Missguided’s use of language in advertisements.
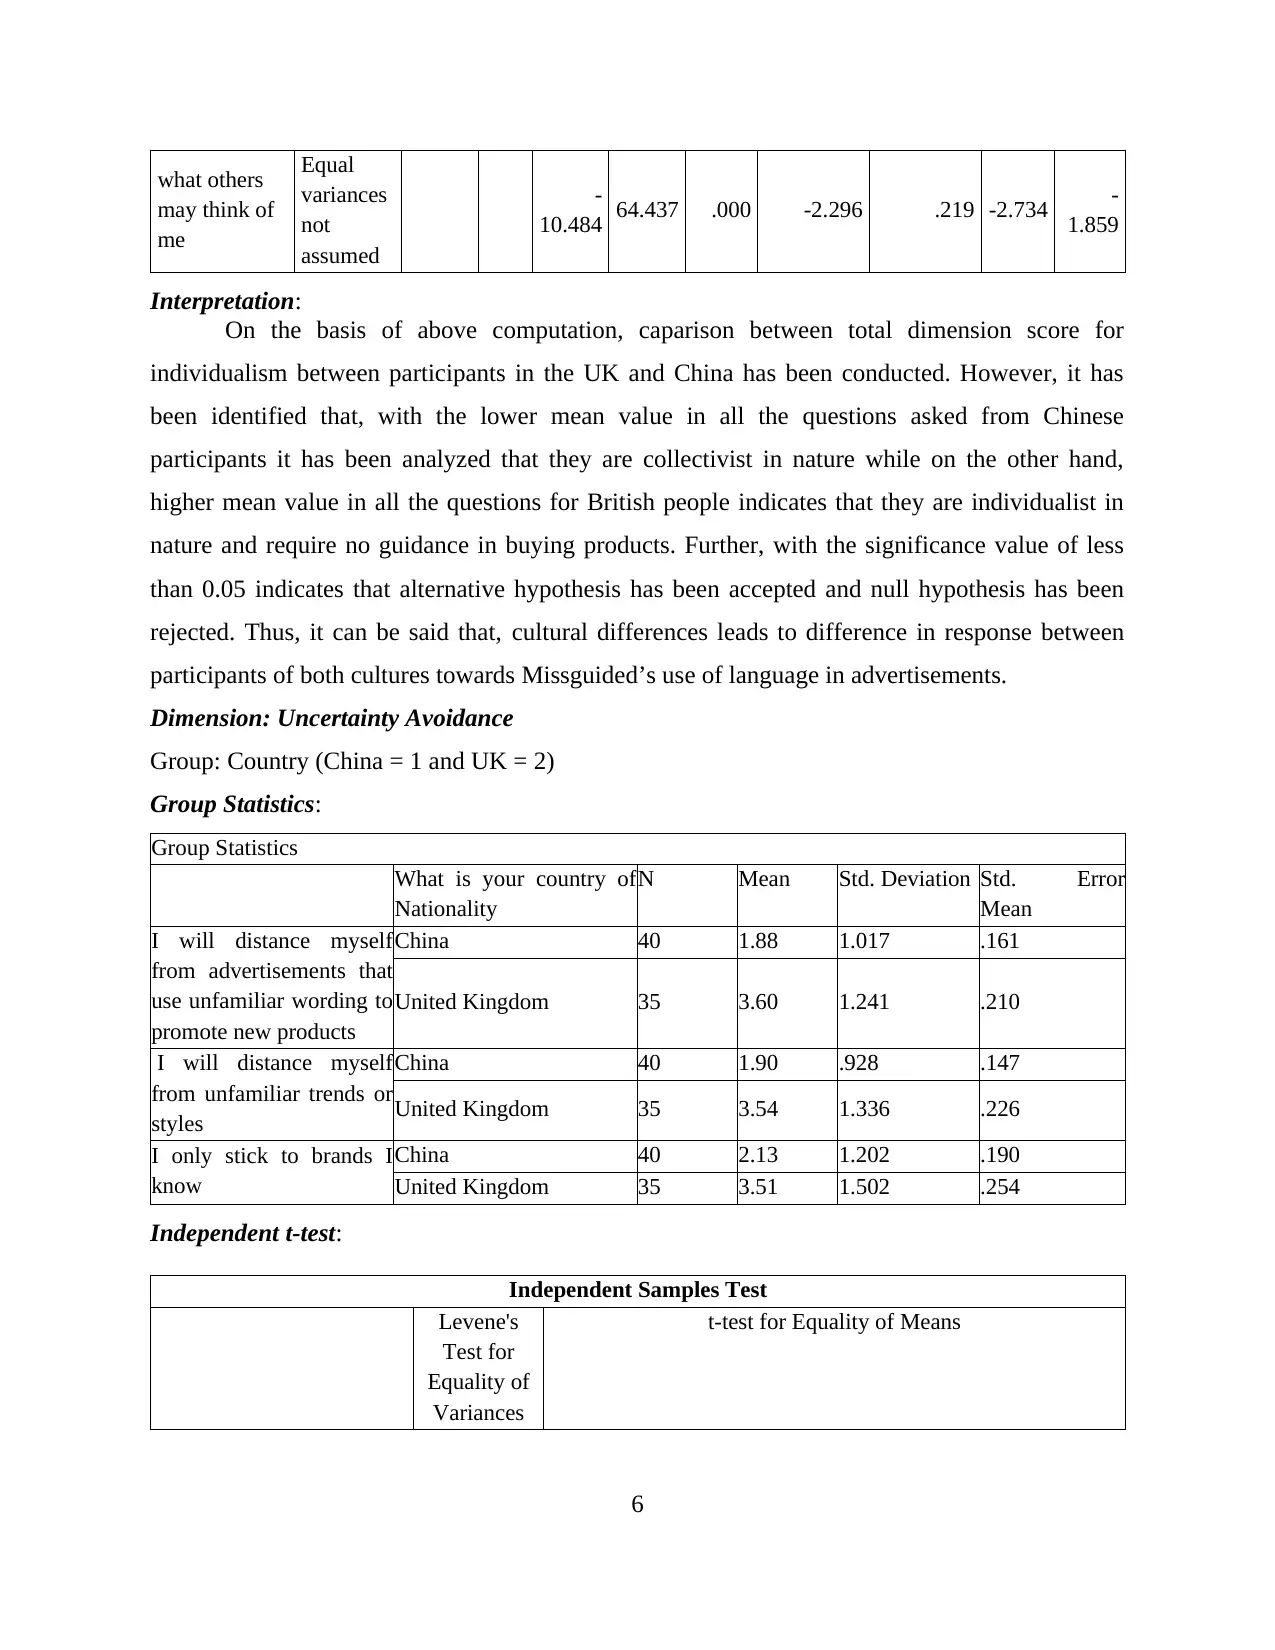
Dimension: Uncertainty Avoidance
Group: Country (China = 1 and UK = 2)
Group Statistics:
Group Statistics
What is your country of
Nationality
N Mean Std. Deviation Std. Error
Mean
I will distance myself
from advertisements that
use unfamiliar wording to
promote new products
China 40 1.88 1.017 .161
United Kingdom 35 3.60 1.241 .210
I will distance myself
from unfamiliar trends or
styles
China 40 1.90 .928 .147
United Kingdom 35 3.54 1.336 .226
I only stick to brands I
know
China 40 2.13 1.202 .190
United Kingdom 35 3.51 1.502 .254
Independent t-test:
Independent Samples Test
Levene's
Test for
Equality of
Variances
t-test for Equality of Means
6
may think of
me
Equal
variances
not
assumed
-
10.484 64.437 .000 -2.296 .219 -2.734 -
1.859
Interpretation:
On the basis of above computation, caparison between total dimension score for
individualism between participants in the UK and China has been conducted. However, it has
been identified that, with the lower mean value in all the questions asked from Chinese
participants it has been analyzed that they are collectivist in nature while on the other hand,
higher mean value in all the questions for British people indicates that they are individualist in
nature and require no guidance in buying products. Further, with the significance value of less
than 0.05 indicates that alternative hypothesis has been accepted and null hypothesis has been
rejected. Thus, it can be said that, cultural differences leads to difference in response between
participants of both cultures towards Missguided’s use of language in advertisements.
Dimension: Uncertainty Avoidance
Group: Country (China = 1 and UK = 2)
Group Statistics:
Group Statistics
What is your country of
Nationality
N Mean Std. Deviation Std. Error
Mean
I will distance myself
from advertisements that
use unfamiliar wording to
promote new products
China 40 1.88 1.017 .161
United Kingdom 35 3.60 1.241 .210
I will distance myself
from unfamiliar trends or
styles
China 40 1.90 .928 .147
United Kingdom 35 3.54 1.336 .226
I only stick to brands I
know
China 40 2.13 1.202 .190
United Kingdom 35 3.51 1.502 .254
Independent t-test:
Independent Samples Test
Levene's
Test for
Equality of
Variances
t-test for Equality of Means
6
F Sig. t df Sig.
(2-
tailed)
Mean
Difference
Std. Error
Difference
95%
Confidence
Interval of the
Difference
Lower Upper
I will distance
myself from
advertisements
that use
unfamiliar
wording to
promote new
products
Equal
variances
assumed
4.537 .037 -
6.611 73 .000 -1.725 .261 -2.245 -
1.205
Equal
variances
not
assumed
-
6.524 65.874 .000 -1.725 .264 -2.253 -
1.197
I will distance
myself from
unfamiliar
trends or
styles
Equal
variances
assumed
13.638 .000 -
6.246 73 .000 -1.643 .263 -2.167 -
1.119
Equal
variances
not
assumed
-
6.100 59.528 .000 -1.643 .269 -2.182 -
1.104
I only stick to
brands I know
Equal
variances
assumed
7.167 .009 -
4.445 73 .000 -1.389 .313 -2.012 -.766
Equal
variances
not
assumed
-
4.380 64.990 .000 -1.389 .317 -2.023 -.756
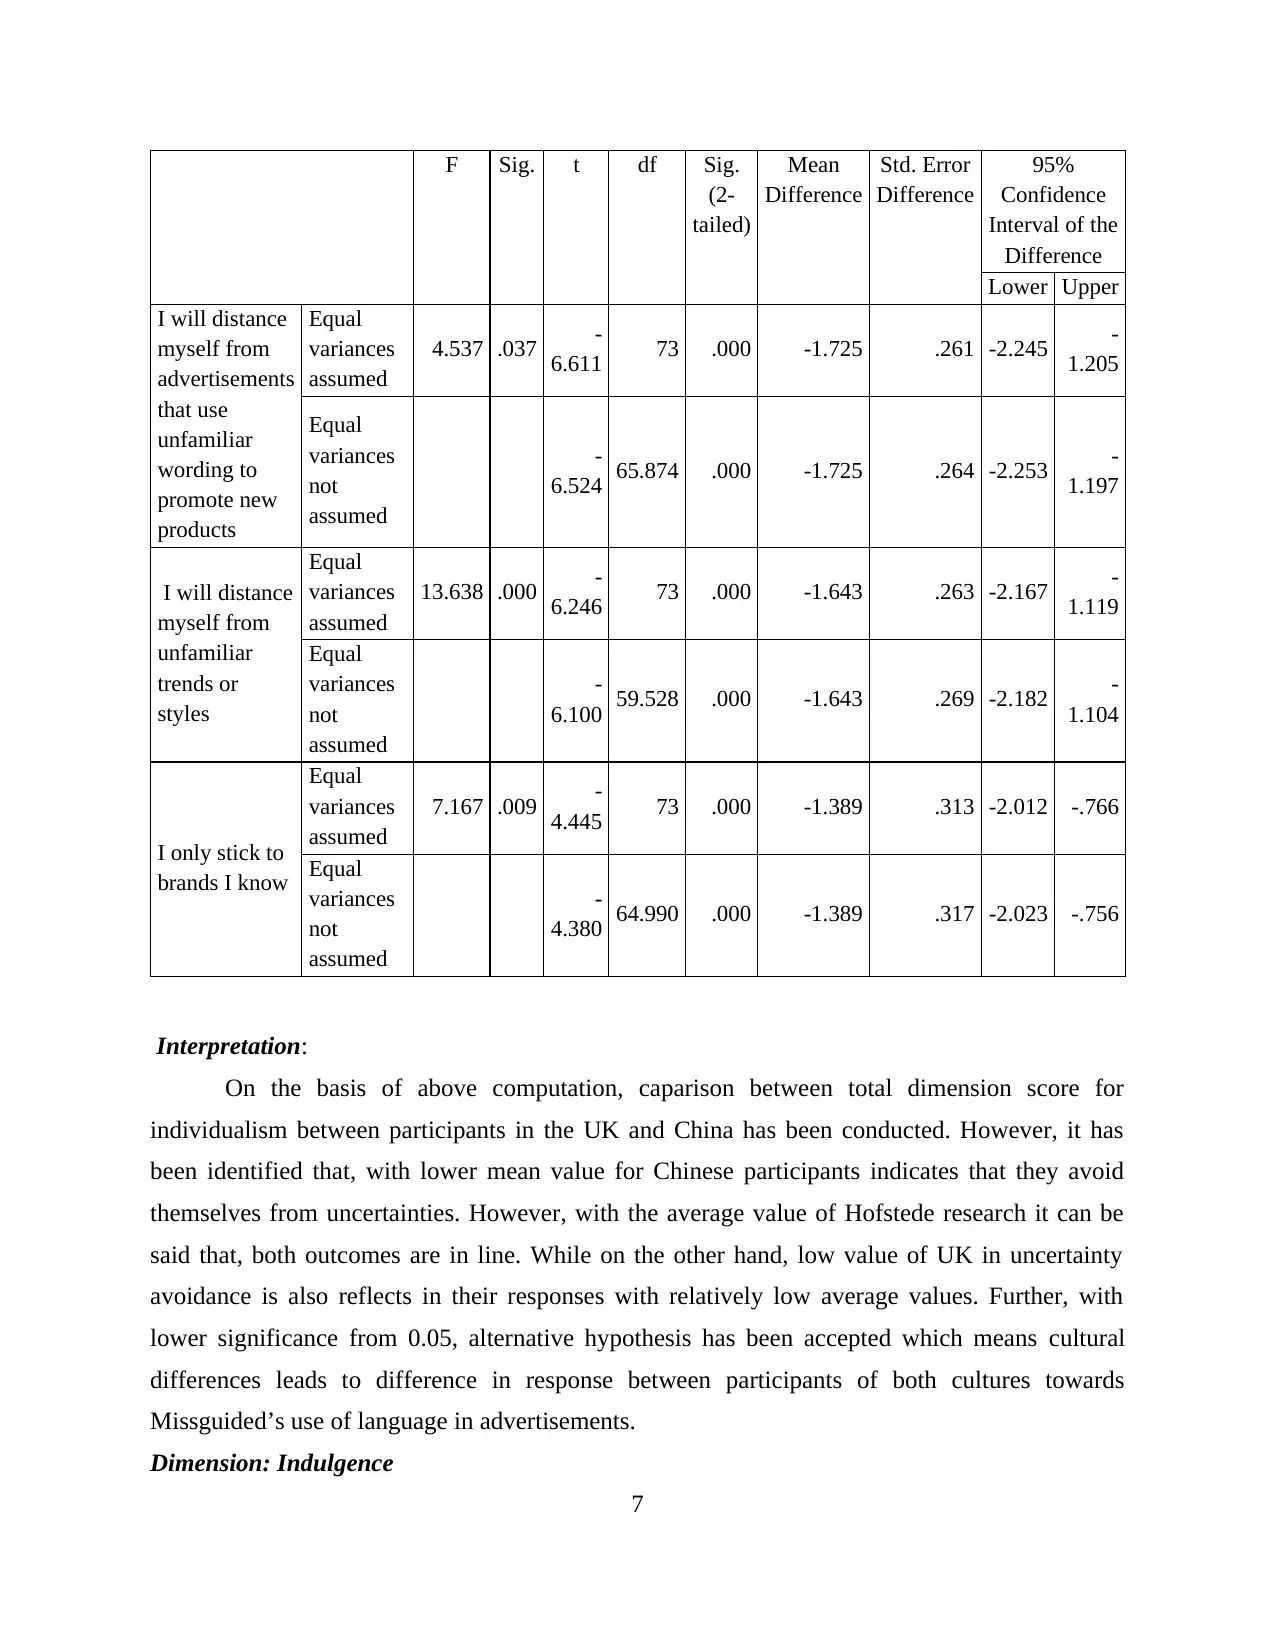
Interpretation:
On the basis of above computation, caparison between total dimension score for
individualism between participants in the UK and China has been conducted. However, it has
been identified that, with lower mean value for Chinese participants indicates that they avoid
themselves from uncertainties. However, with the average value of Hofstede research it can be
said that, both outcomes are in line. While on the other hand, low value of UK in uncertainty
avoidance is also reflects in their responses with relatively low average values. Further, with
lower significance from 0.05, alternative hypothesis has been accepted which means cultural
differences leads to difference in response between participants of both cultures towards
Missguided’s use of language in advertisements.
Dimension: Indulgence
7
(2-
tailed)
Mean
Difference
Std. Error
Difference
95%
Confidence
Interval of the
Difference
Lower Upper
I will distance
myself from
advertisements
that use
unfamiliar
wording to
promote new
products
Equal
variances
assumed
4.537 .037 -
6.611 73 .000 -1.725 .261 -2.245 -
1.205
Equal
variances
not
assumed
-
6.524 65.874 .000 -1.725 .264 -2.253 -
1.197
I will distance
myself from
unfamiliar
trends or
styles
Equal
variances
assumed
13.638 .000 -
6.246 73 .000 -1.643 .263 -2.167 -
1.119
Equal
variances
not
assumed
-
6.100 59.528 .000 -1.643 .269 -2.182 -
1.104
I only stick to
brands I know
Equal
variances
assumed
7.167 .009 -
4.445 73 .000 -1.389 .313 -2.012 -.766
Equal
variances
not
assumed
-
4.380 64.990 .000 -1.389 .317 -2.023 -.756
Interpretation:
On the basis of above computation, caparison between total dimension score for
individualism between participants in the UK and China has been conducted. However, it has
been identified that, with lower mean value for Chinese participants indicates that they avoid
themselves from uncertainties. However, with the average value of Hofstede research it can be
said that, both outcomes are in line. While on the other hand, low value of UK in uncertainty
avoidance is also reflects in their responses with relatively low average values. Further, with
lower significance from 0.05, alternative hypothesis has been accepted which means cultural
differences leads to difference in response between participants of both cultures towards
Missguided’s use of language in advertisements.
Dimension: Indulgence
7
⊘ This is a preview!⊘
Do you want full access?
Subscribe today to unlock all pages.
Trusted by 1+ million students worldwide
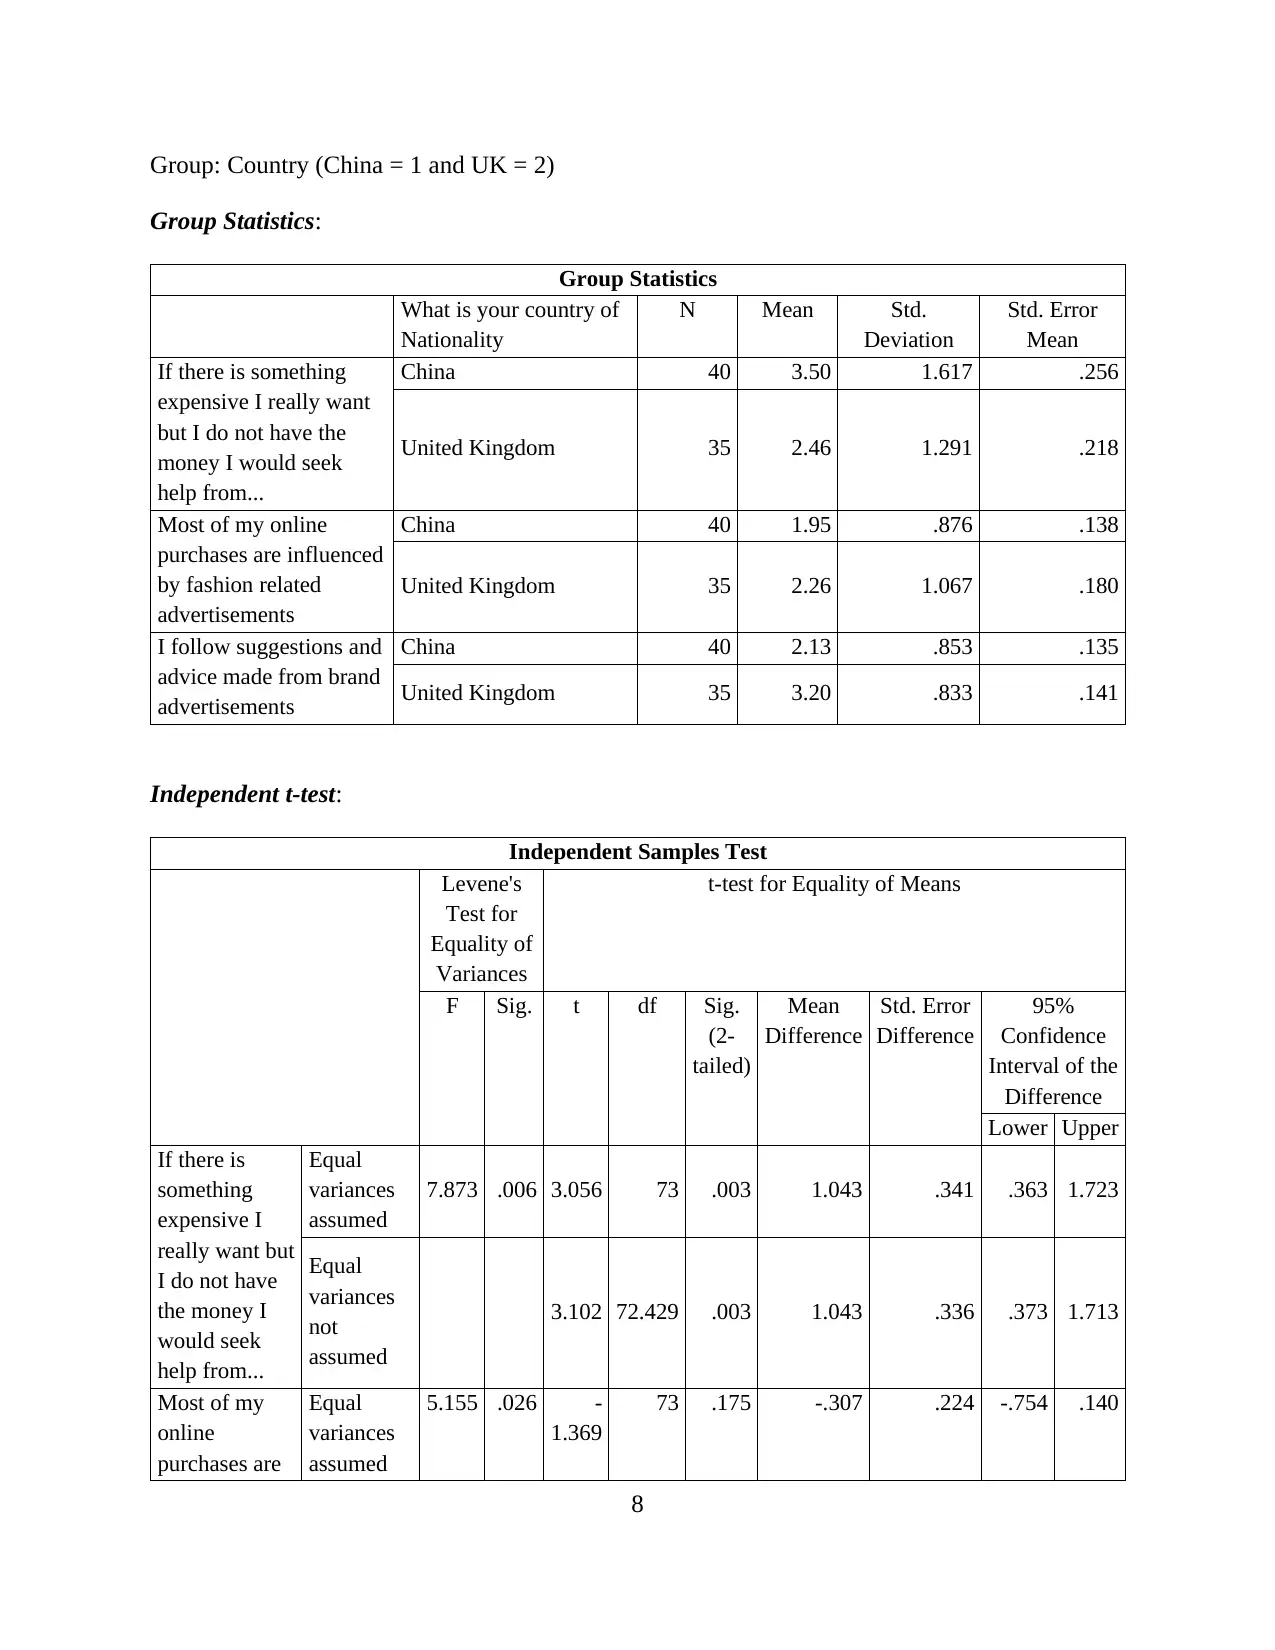
Group: Country (China = 1 and UK = 2)
Group Statistics:
Group Statistics
What is your country of
Nationality
N Mean Std.
Deviation
Std. Error
Mean
If there is something
expensive I really want
but I do not have the
money I would seek
help from...
China 40 3.50 1.617 .256
United Kingdom 35 2.46 1.291 .218
Most of my online
purchases are influenced
by fashion related
advertisements
China 40 1.95 .876 .138
United Kingdom 35 2.26 1.067 .180
I follow suggestions and
advice made from brand
advertisements
China 40 2.13 .853 .135
United Kingdom 35 3.20 .833 .141
Independent t-test:
Independent Samples Test
Levene's
Test for
Equality of
Variances
t-test for Equality of Means
F Sig. t df Sig.
(2-
tailed)
Mean
Difference
Std. Error
Difference
95%
Confidence
Interval of the
Difference
Lower Upper
If there is
something
expensive I
really want but
I do not have
the money I
would seek
help from...
Equal
variances
assumed
7.873 .006 3.056 73 .003 1.043 .341 .363 1.723
Equal
variances
not
assumed
3.102 72.429 .003 1.043 .336 .373 1.713
Most of my
online
purchases are
Equal
variances
assumed
5.155 .026 -
1.369
73 .175 -.307 .224 -.754 .140
8
Paraphrase This Document
Need a fresh take? Get an instant paraphrase of this document with our AI Paraphraser
influenced by
fashion related
advertisements
Equal
variances
not
assumed
-
1.351 65.930 .181 -.307 .227 -.761 .147
I follow
suggestions
and advice
made from
brand
advertisements
Equal
variances
assumed
.774 .382 -
5.504 73 .000 -1.075 .195 -1.464 -.686
Equal
variances
not
assumed
-
5.513 72.096 .000 -1.075 .195 -1.464 -.686
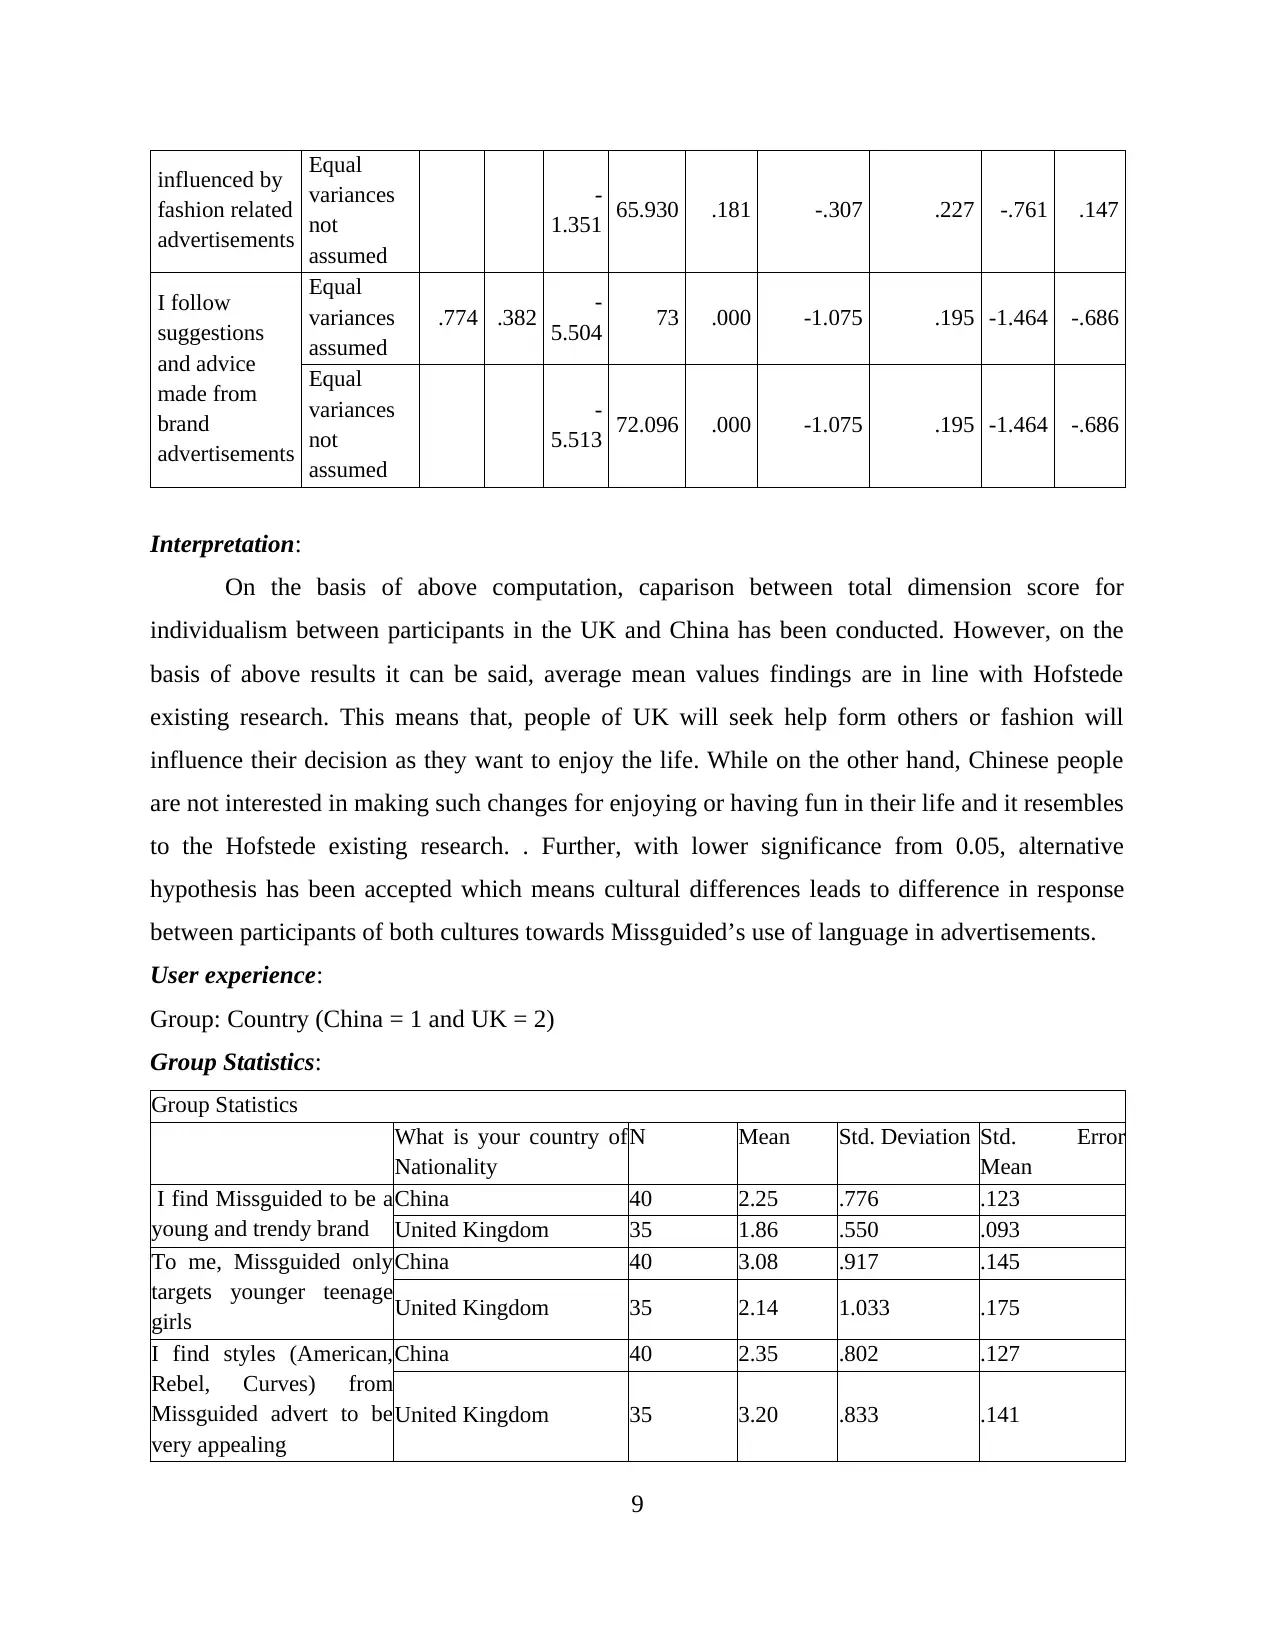
Interpretation:
On the basis of above computation, caparison between total dimension score for
individualism between participants in the UK and China has been conducted. However, on the
basis of above results it can be said, average mean values findings are in line with Hofstede
existing research. This means that, people of UK will seek help form others or fashion will
influence their decision as they want to enjoy the life. While on the other hand, Chinese people
are not interested in making such changes for enjoying or having fun in their life and it resembles
to the Hofstede existing research. . Further, with lower significance from 0.05, alternative
hypothesis has been accepted which means cultural differences leads to difference in response
between participants of both cultures towards Missguided’s use of language in advertisements.
User experience:
Group: Country (China = 1 and UK = 2)
Group Statistics:
Group Statistics
What is your country of
Nationality
N Mean Std. Deviation Std. Error
Mean
I find Missguided to be a
young and trendy brand
China 40 2.25 .776 .123
United Kingdom 35 1.86 .550 .093
To me, Missguided only
targets younger teenage
girls
China 40 3.08 .917 .145
United Kingdom 35 2.14 1.033 .175
I find styles (American,
Rebel, Curves) from
Missguided advert to be
very appealing
China 40 2.35 .802 .127
United Kingdom 35 3.20 .833 .141
9
fashion related
advertisements
Equal
variances
not
assumed
-
1.351 65.930 .181 -.307 .227 -.761 .147
I follow
suggestions
and advice
made from
brand
advertisements
Equal
variances
assumed
.774 .382 -
5.504 73 .000 -1.075 .195 -1.464 -.686
Equal
variances
not
assumed
-
5.513 72.096 .000 -1.075 .195 -1.464 -.686
Interpretation:
On the basis of above computation, caparison between total dimension score for
individualism between participants in the UK and China has been conducted. However, on the
basis of above results it can be said, average mean values findings are in line with Hofstede
existing research. This means that, people of UK will seek help form others or fashion will
influence their decision as they want to enjoy the life. While on the other hand, Chinese people
are not interested in making such changes for enjoying or having fun in their life and it resembles
to the Hofstede existing research. . Further, with lower significance from 0.05, alternative
hypothesis has been accepted which means cultural differences leads to difference in response
between participants of both cultures towards Missguided’s use of language in advertisements.
User experience:
Group: Country (China = 1 and UK = 2)
Group Statistics:
Group Statistics
What is your country of
Nationality
N Mean Std. Deviation Std. Error
Mean
I find Missguided to be a
young and trendy brand
China 40 2.25 .776 .123
United Kingdom 35 1.86 .550 .093
To me, Missguided only
targets younger teenage
girls
China 40 3.08 .917 .145
United Kingdom 35 2.14 1.033 .175
I find styles (American,
Rebel, Curves) from
Missguided advert to be
very appealing
China 40 2.35 .802 .127
United Kingdom 35 3.20 .833 .141
9
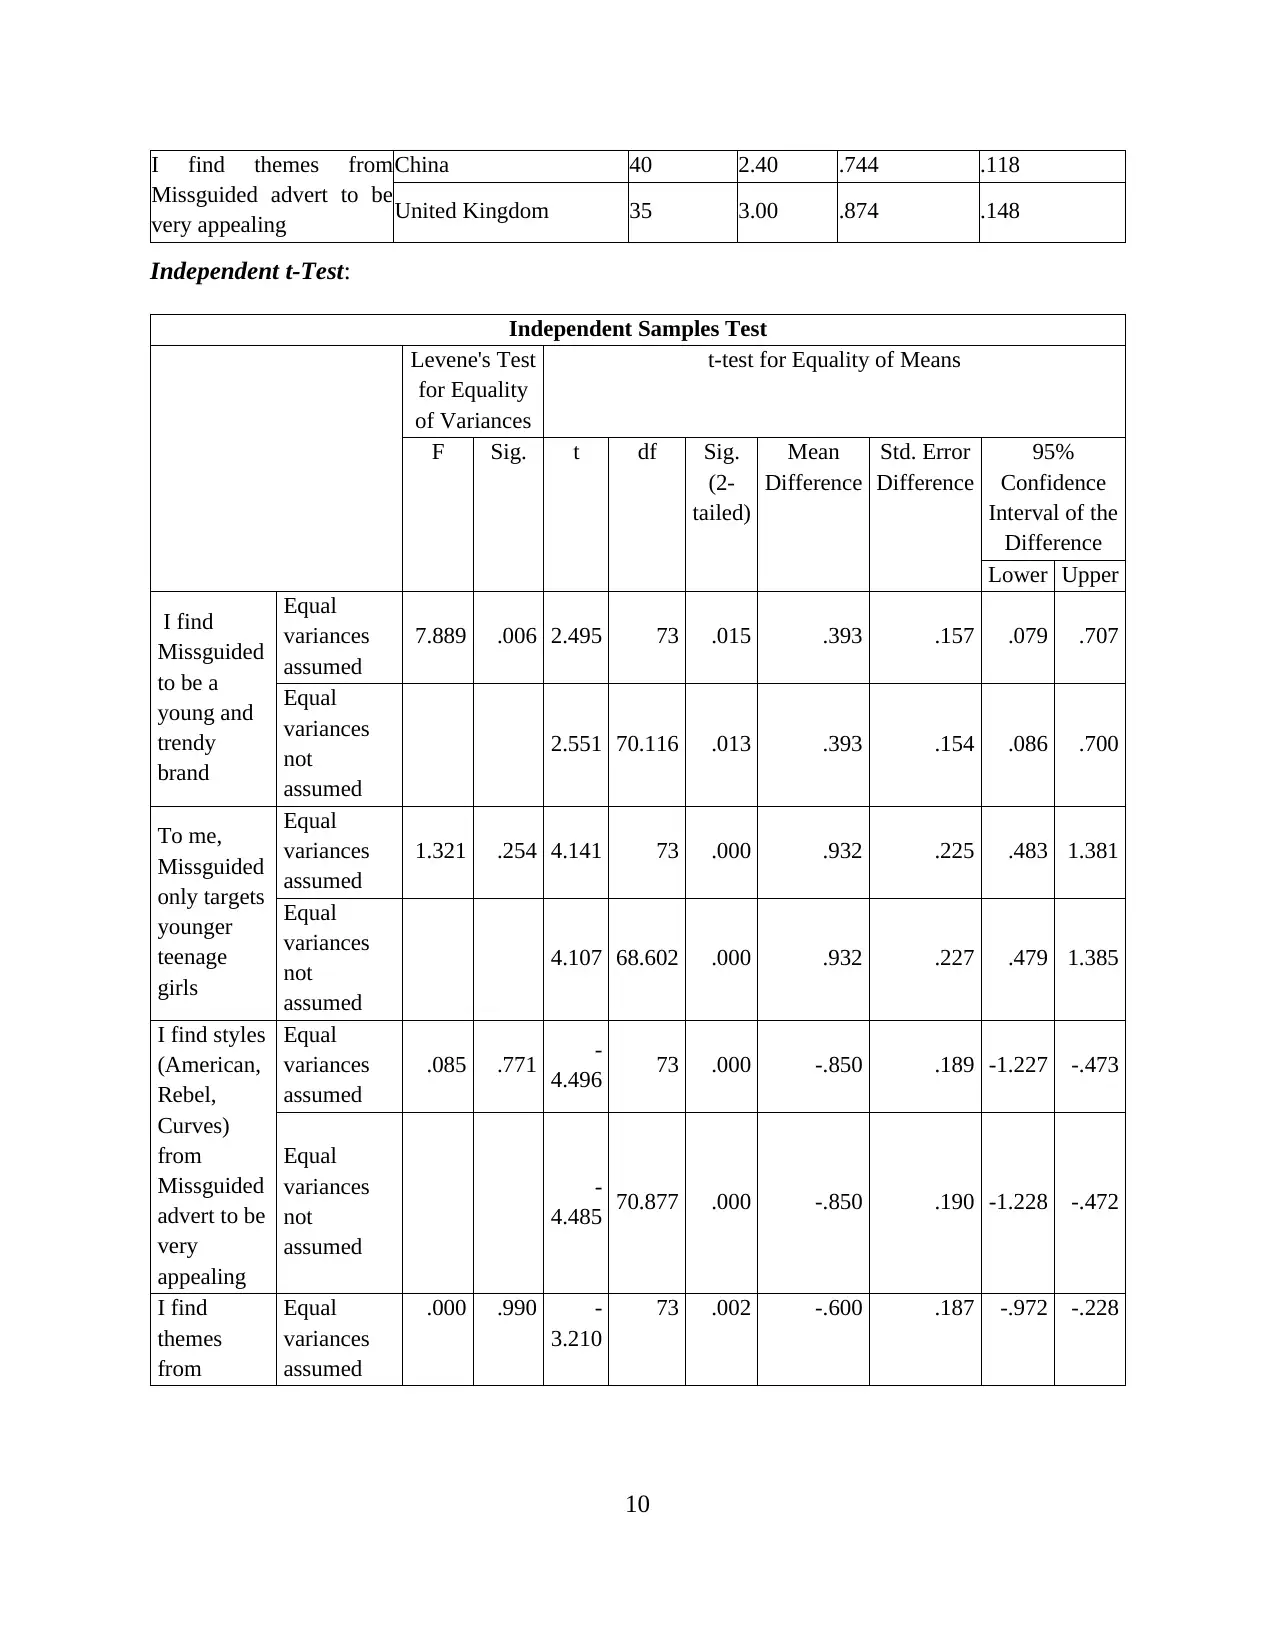
I find themes from
Missguided advert to be
very appealing
China 40 2.40 .744 .118
United Kingdom 35 3.00 .874 .148
Independent t-Test:
Independent Samples Test
Levene's Test
for Equality
of Variances
t-test for Equality of Means
F Sig. t df Sig.
(2-
tailed)
Mean
Difference
Std. Error
Difference
95%
Confidence
Interval of the
Difference
Lower Upper
I find
Missguided
to be a
young and
trendy
brand
Equal
variances
assumed
7.889 .006 2.495 73 .015 .393 .157 .079 .707
Equal
variances
not
assumed
2.551 70.116 .013 .393 .154 .086 .700
To me,
Missguided
only targets
younger
teenage
girls
Equal
variances
assumed
1.321 .254 4.141 73 .000 .932 .225 .483 1.381
Equal
variances
not
assumed
4.107 68.602 .000 .932 .227 .479 1.385
I find styles
(American,
Rebel,
Curves)
from
Missguided
advert to be
very
appealing
Equal
variances
assumed
.085 .771 -
4.496 73 .000 -.850 .189 -1.227 -.473
Equal
variances
not
assumed
-
4.485 70.877 .000 -.850 .190 -1.228 -.472
I find
themes
from
Equal
variances
assumed
.000 .990 -
3.210
73 .002 -.600 .187 -.972 -.228
10
⊘ This is a preview!⊘
Do you want full access?
Subscribe today to unlock all pages.
Trusted by 1+ million students worldwide
1 out of 23


Your All-in-One AI-Powered Toolkit for Academic Success.
+13062052269
info@desklib.com
Available 24*7 on WhatsApp / Email
![[object Object]](/_next/static/media/star-bottom.7253800d.svg)
Unlock your academic potential
Copyright © 2020–2026 A2Z Services. All Rights Reserved. Developed and managed by ZUCOL.