Business Decision Making Report: Analysis of the Crossrail Project
VerifiedAdded on 2019/12/03
|19
|4426
|155
Report
AI Summary
This report provides a comprehensive analysis of business decision-making for the Crossrail project, a major railway infrastructure investment in the UK. It begins with a research plan for collecting primary and secondary data, including survey methodologies and questionnaire design. The report then delves into data analysis, calculating central tendencies like mean, mode, and median, along with measures of dispersion such as range and standard deviation. Percentiles, interquartile range, and correlation coefficients are also calculated to provide a deeper understanding of the data. The report incorporates graphical presentations and trend line construction for visual analysis, culminating in a formal business report. Furthermore, the report includes project management tools such as network diagrams and Gantt charts, along with financial analysis involving the calculation of Net Present Value (NPV) and Internal Rate of Return (IRR) to evaluate investment decisions. The analysis aims to provide effective and strategic business decisions, contributing to the project's success and sustainability.

Business Decision Making
Paraphrase This Document
Need a fresh take? Get an instant paraphrase of this document with our AI Paraphraser
Table of Contents
INTRODUCTION......................................................................................................................1
TASK 1......................................................................................................................................1
AC 1.1 Research plan for collecting the primary and secondary data..............................1
Rationale...........................................................................................................................1
Objective...........................................................................................................................2
AC 1.2 Survey Methodology............................................................................................2
Data analysis.....................................................................................................................3
Time frame........................................................................................................................3
Budget...............................................................................................................................3
AC 1.3 designing a questionnaire.....................................................................................4
TASK 2......................................................................................................................................5
AC 2.1, 2.2 Calculation of Mean, Mode and Median.......................................................5
AC 2.3 Calculation of range and standard deviation........................................................6
AC 2.4 Percentile and inter quartile range and correlation coefficient of the series........7
TASK 3......................................................................................................................................8
AC 3.1, 4.1 Graphical presentation of the given data series.............................................8
AC 3.2, 4.1 Construction of trend line..............................................................................9
AC 3.3 Presentation........................................................................................................11
AC 3.4 Formal business report.......................................................................................11
TASK 4....................................................................................................................................12
AC 4.2 Network diagram and Gantt chart......................................................................12
AC 4.3 Calculation of Net present value and Internal rate of return..............................13
CONCLUSION........................................................................................................................16
REFEERNCES.........................................................................................................................17

Index of Tables
Table 1: Calculation of mean, mode and median.......................................................................5
Table 2: Calculation of standard deviation................................................................................6
Table 3: Calculation of correlation............................................................................................7
Table 4: Calculation of Net present value of the project (In £)...............................................14
Table 5: Calculation of Net present value of the project (In £)...............................................15
⊘ This is a preview!⊘
Do you want full access?
Subscribe today to unlock all pages.
Trusted by 1+ million students worldwide
INTRODUCTION
Every business organizations have to make decisions at different stages to run
business successfully. Effective and strategic business decisions help the organizations to
achieve the business growth and ensure business sustainability for long term period.
Decisions can be taken by different financial and statistical analytical tools. Statistical tool
includes measurement of dispersion, central tendency and correlation. Moreover, it can be
done by preparing different kind of graphs with the objective of data analysis. However,
financial tools such as capital budgeting decisions help the businesses to take better
investment decisions. Crossrail is Europe's largest railway company that provide railway
services through 40 stations. This report aims at taking effective business decisions for UK
Crossrail.
TASK 1
AC 1.1 Research plan for collecting the primary and secondary data
Background
Crossrail is Europe's biggest construction project in Europe. Moreover, it is the single
infrastructure investment in UK. It provides services to the passengers by different routes and
stations. The main purpose of this is to make world class railway system for London by
providing better customer services. It makes investment so as to ensure easier, quicker and
improved travel opportunities to the customers. The purpose of Crossrail project is to provide
convenience and more comfortable services to the passengers at London (Bazerman and
Moore, 2012). Therefore, it becomes necessary for the company to gather data to meet its
purposes. The presented report aims at determining the importance of rail services to the
community of UK. It helps in identifying that how it facilitates and contribute to the
economic development of the country. This report helps in creating a research plan for such
project for data collection purpose.
Rationale
The research is done to analyse the claims that as a mass transit technology the
Crossrail would cut down over-crowding and congestion in the UK by encouraging motor
vehicle and car users to shift to public transport. It also discusses the issue of the Crossrail
gaining carbon credits for being an “energy efficient” technology. The research also shows
how the Crossrail is enhancing restoration in the city through its engagement in property
improvement and suppositions (Hofmann, 2007). Moreover, it discusses the implication of
1 | P a g e
Paraphrase This Document
Need a fresh take? Get an instant paraphrase of this document with our AI Paraphraser
Crossrail for the marginalized subdivisions of the city. By analysing shift by the Crossrail
project, connectivity of rail routes in mediate class section and the fare composition, it tells
the links between capital increase and eviction. Finally the research comes up with the
thought that Crossrail is proposed as a way of rising connectivity in the UK cities and by
making equitable open transport.
Objective
The objective of the research is described as under:
Crossrail route will run over 100km from Rame within which you want the research
coeading and Heathrow in the west, through new tunnels under central London to
Shenfield and Abbey Wood in the east.
Crossrail stations including 10 new stations at Paddington, Bond Street, Tottenham
Court Road, Farringdon, Liverpool Street, Whitechapel, Canary Wharf, Custom
House, Woolwich and Abbey Wood.
Crossrail will bring an extra 1.5 million people to within 45 minutes of central
London which will help in time saving for commuters
Crossrail will provide rreliable and safe journey.
AC 1.2 Survey Methodology
Data can be collected by making primary and secondary research that are described below:
Primary research: Primary research is done by the investigator or researcher itself to
collect the required information. In context to Crossrail project it can be collected to enhance
its capacity, reduce journey times and avail qualified railway services to the passengers.
Passenger surveys, field research and knowing passenger feedbacks can be used for such
purpose. Moreover, interview and questionnaire can be designed through including all the
travel characteristics (Weygandt, kimmel and Kieso, 2009). However, surveys also can be
conducted by making marketing research that helps in determine the effects of parking
provisions, prices and travel policies. In addition to it, competition level can also be
determined by making comparison between other travel roots such as buses.
Secondary research: This type of research is already collected by others for their own
purpose. It can be used to identify the role of travel services to the economic growth by
determining the economic benefits for UK. It can be determined through identifying the
transport industry economic benefits. Moreover, the growth of GDP and employment can be
used for this purpose (Black, 2011). The economic benefit involves the business growth and
2 | P a g e
increase the tax amount. However, passenger benefit includes time saving benefits and
congestion relief. Further, the project provides more than thousands of employment to the
UK citizens. All types of information can be collected from local and central government
data, ministry of railways, London planning, reporting and monitoring reports. In addition to
it, London corporation commission project reports and other research reports may be used for
such purpose.
Data analysis
After collecting the data, it should be analysed by different analytical tools. Data can
be analysed that the surveys helps in deciding the effects of parking provisions, prices and
travel argumentation. In summation to it, rivalry level can also be observed by making
comparison between different travel roots such as buses (Pettigrew, 2014). Moreover, it can
also be analysed that the passengers get welfare by time saving benefits and congestion relief.
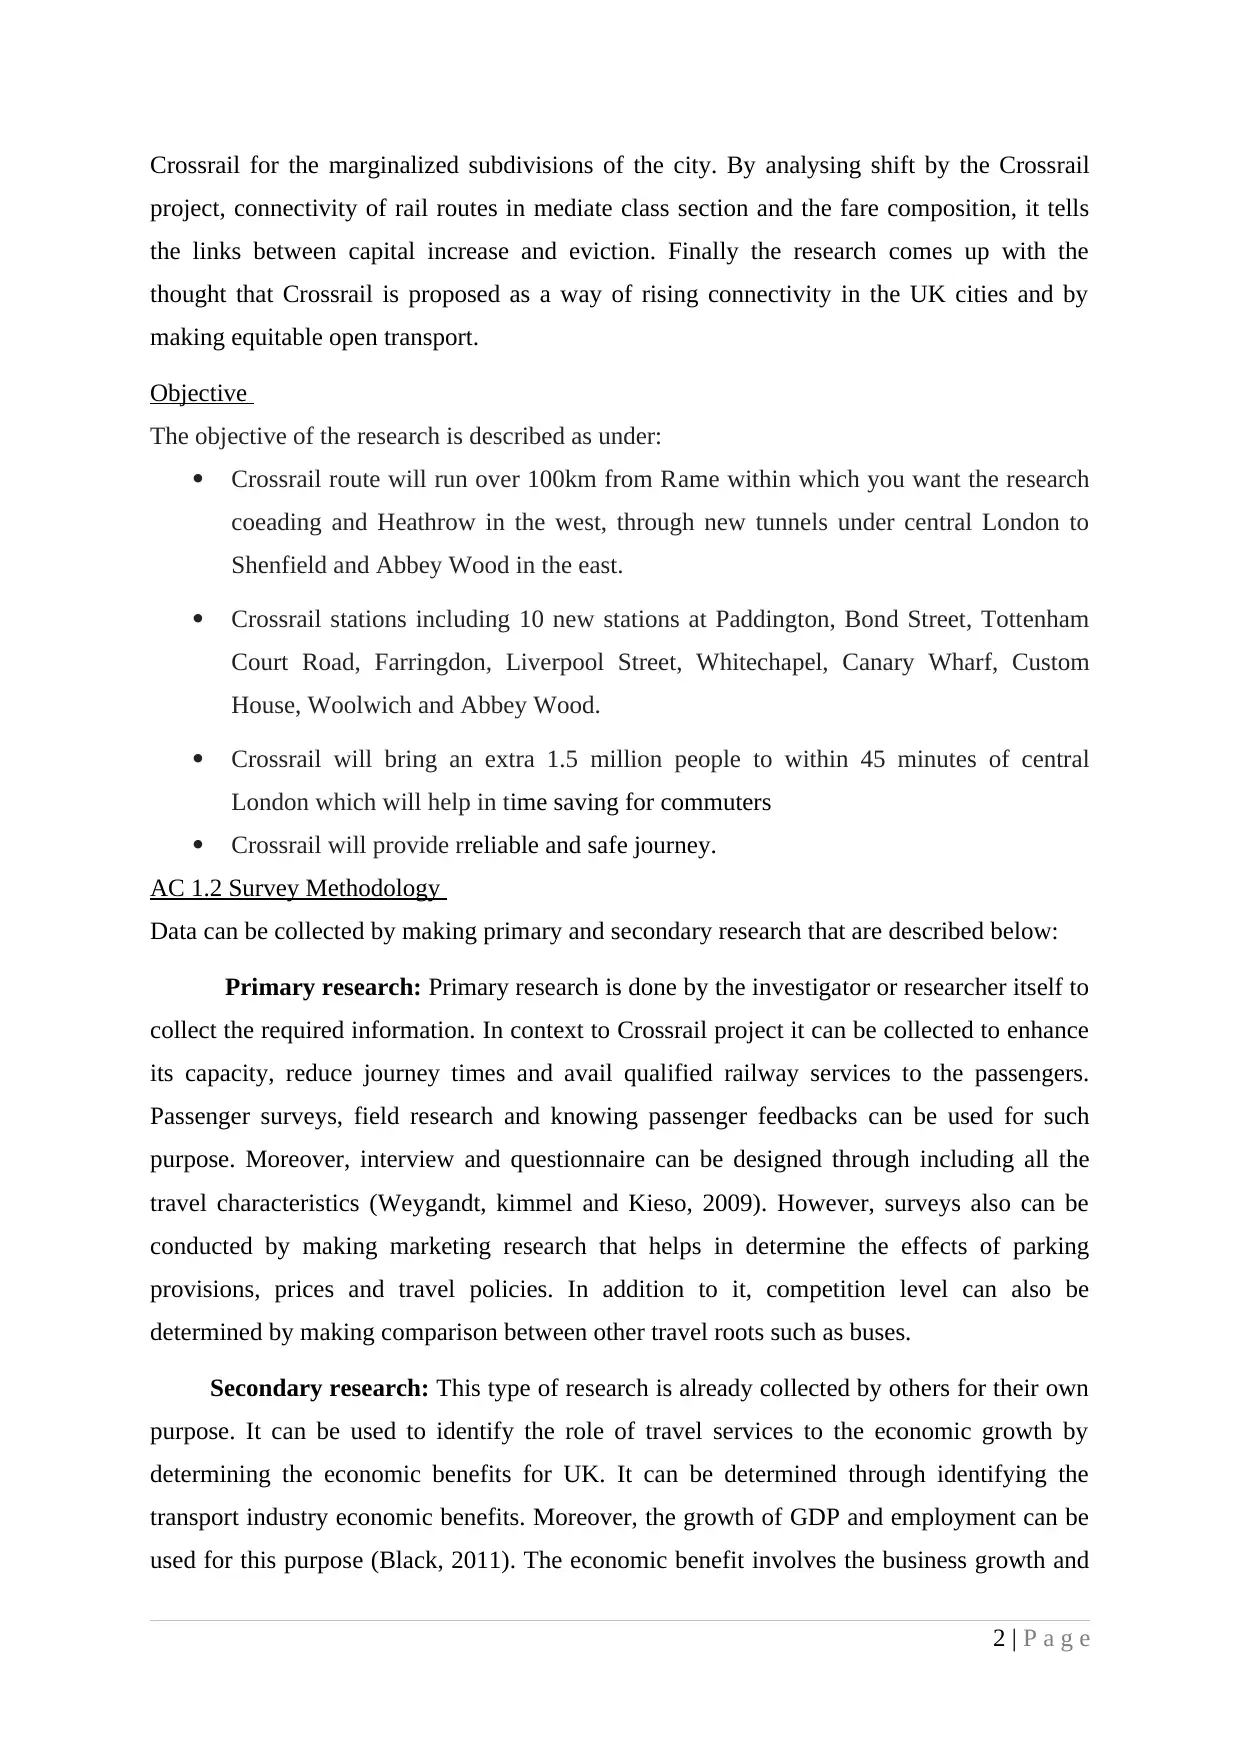
Time frame
Sensing at the quality of existing study, it is crucial for the research worker to make
in-extent analysis. Yet, for making high-fidelity and exact research, time element is most
unitary important factor thought. Therefore, to hold the credibility and dependability of the
task, researcher should yield satisfactory magnitude of time for carrying out the total course
of study on identifying the implication of Crossrail project for the Localized people of
London (Johnson and Christensen, 2008). Thus, time frame has been outlined to transfer out
entire study is as preceded:
Activities/ duration in days 2 4 6 8 10 12 14 16
Contextual investigation
Shaping practical objectives of
the research
Methodology for scheming the
total idea of study
Assembling primary and
secondary data
Investigation of the gathered
data
Budget plan for the entire
research
Deciding the entire research
Concept
Budget
Budgets can be prepared by estimating or forecasting the future cash flows over a
specific period. For the entire course of research in effectual and appropriate way, £1500 has
been budgeted. Following are expenditure divided under the total amount of £1500:
3 | P a g e
congestion relief. Further, the project provides more than thousands of employment to the
UK citizens. All types of information can be collected from local and central government
data, ministry of railways, London planning, reporting and monitoring reports. In addition to
it, London corporation commission project reports and other research reports may be used for
such purpose.
Data analysis
After collecting the data, it should be analysed by different analytical tools. Data can
be analysed that the surveys helps in deciding the effects of parking provisions, prices and
travel argumentation. In summation to it, rivalry level can also be observed by making
comparison between different travel roots such as buses (Pettigrew, 2014). Moreover, it can
also be analysed that the passengers get welfare by time saving benefits and congestion relief.
Time frame
Sensing at the quality of existing study, it is crucial for the research worker to make
in-extent analysis. Yet, for making high-fidelity and exact research, time element is most
unitary important factor thought. Therefore, to hold the credibility and dependability of the
task, researcher should yield satisfactory magnitude of time for carrying out the total course
of study on identifying the implication of Crossrail project for the Localized people of
London (Johnson and Christensen, 2008). Thus, time frame has been outlined to transfer out
entire study is as preceded:
Activities/ duration in days 2 4 6 8 10 12 14 16
Contextual investigation
Shaping practical objectives of
the research
Methodology for scheming the
total idea of study
Assembling primary and
secondary data
Investigation of the gathered
data
Budget plan for the entire
research
Deciding the entire research
Concept
Budget
Budgets can be prepared by estimating or forecasting the future cash flows over a
specific period. For the entire course of research in effectual and appropriate way, £1500 has
been budgeted. Following are expenditure divided under the total amount of £1500:
3 | P a g e
⊘ This is a preview!⊘
Do you want full access?
Subscribe today to unlock all pages.
Trusted by 1+ million students worldwide

EXPENDITURE AMOUNT
Stationary reimbursement £100
Study aggregation from Primary data £600
study aggregation from secondary data £400
petrol Cost £200
Sundry expenditure £200
ENTIRE AMMOUNT = £1500
AC 1.3 designing a questionnaire
Name:
Gender:
Age:
1. Accordant to you, what is the leading profit of Crossrail project?
Rising total travel time crosswise London
Effortless crowding
Proper Connectivity
Alteration and betterment in the manner masses travel around London
2. Are you alert about the Crossrail undertaking of the UK government?
Yes
No
3. Do you accept the concept that, Crossrail project will guarantee in raising the rail
transit and cut travels time across metropolis?
Agree
Strongly Agree
Disagree
Neutral
Strongly Agree
4. Will the services offering by the Crossrail Undertaking power to exercise it?
Yes
No
5. Please, provide befitting ideas for rising welfare of Crossrail undertaking for
localized people of central London.
4 | P a g e
Paraphrase This Document
Need a fresh take? Get an instant paraphrase of this document with our AI Paraphraser
TASK 2
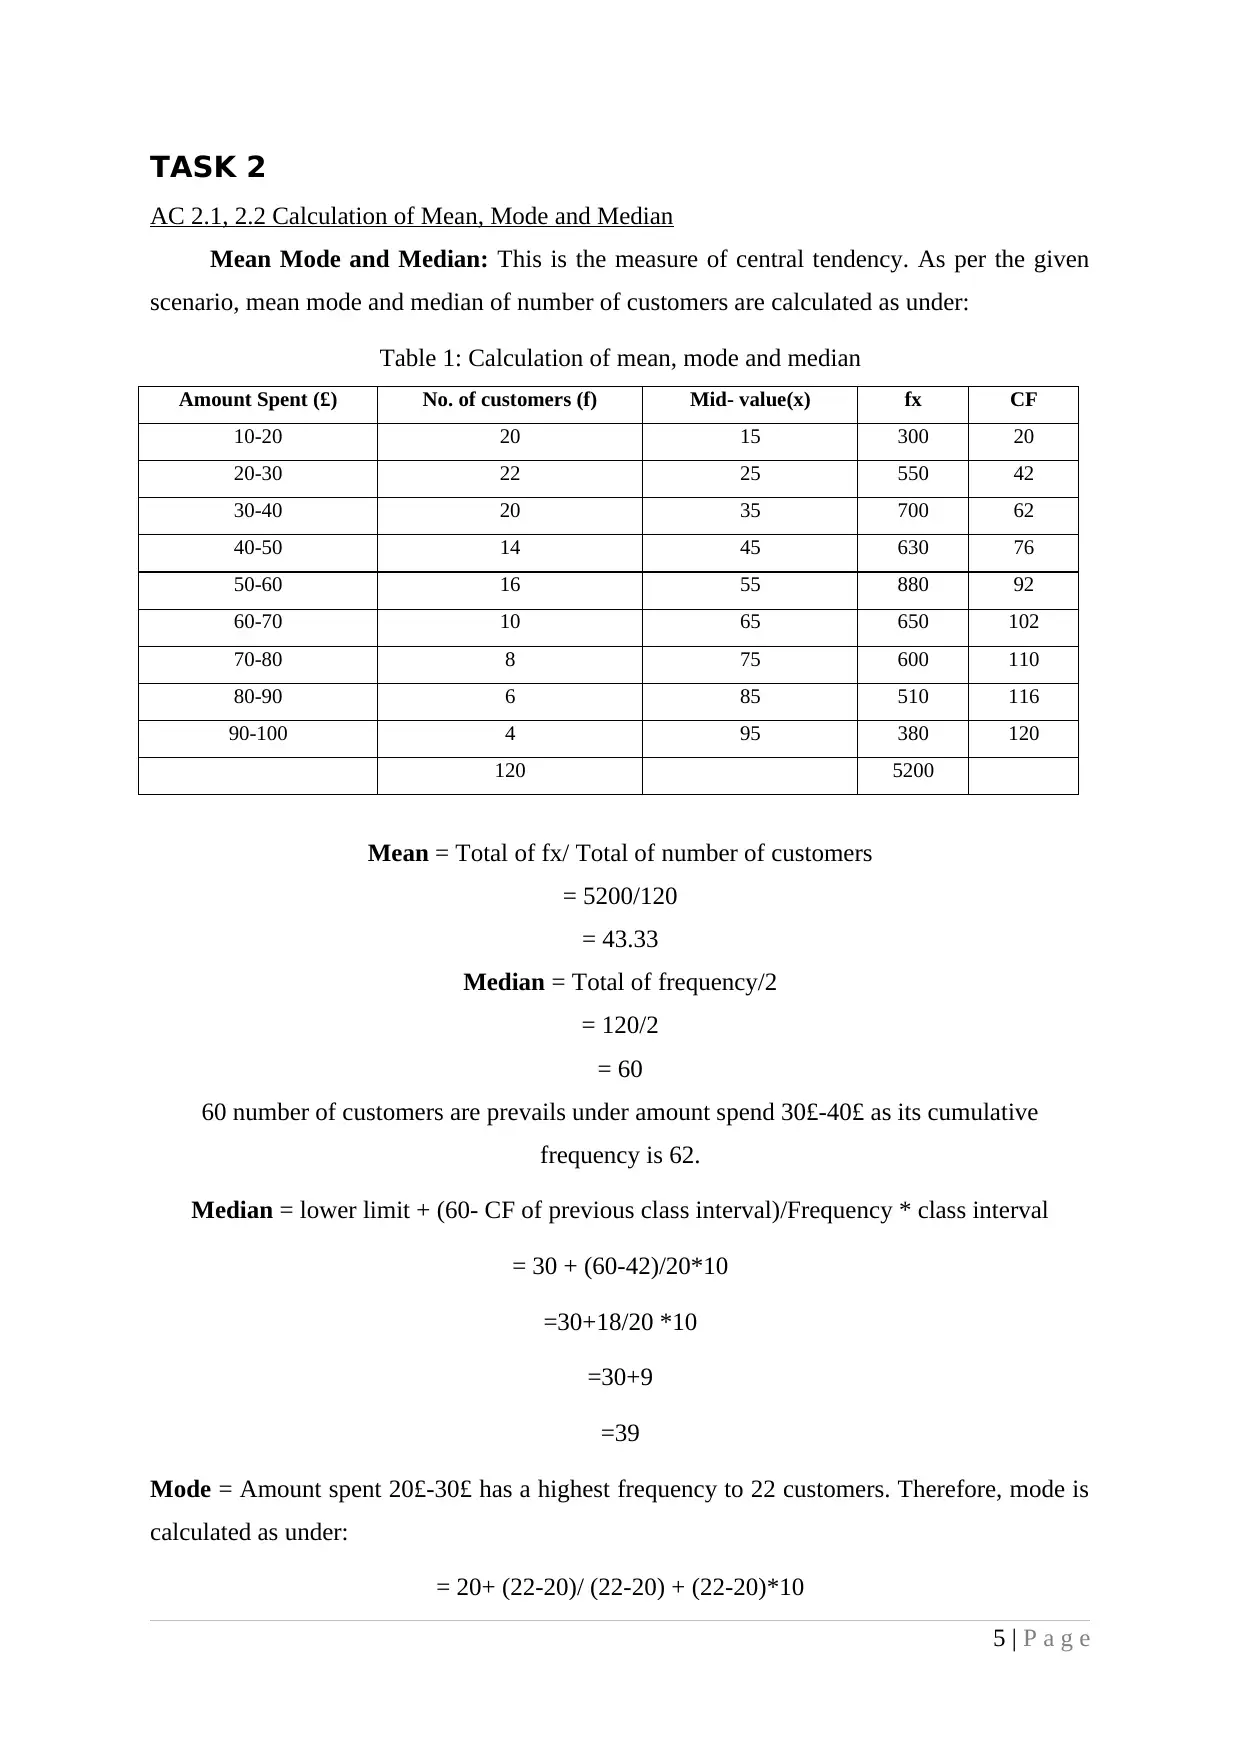
AC 2.1, 2.2 Calculation of Mean, Mode and Median
Mean Mode and Median: This is the measure of central tendency. As per the given
scenario, mean mode and median of number of customers are calculated as under:
Table 1: Calculation of mean, mode and median
Amount Spent (£) No. of customers (f) Mid- value(x) fx CF
10-20 20 15 300 20
20-30 22 25 550 42
30-40 20 35 700 62
40-50 14 45 630 76
50-60 16 55 880 92
60-70 10 65 650 102
70-80 8 75 600 110
80-90 6 85 510 116
90-100 4 95 380 120
120 5200
Mean = Total of fx/ Total of number of customers
= 5200/120
= 43.33
Median = Total of frequency/2
= 120/2
= 60
60 number of customers are prevails under amount spend 30£-40£ as its cumulative
frequency is 62.
Median = lower limit + (60- CF of previous class interval)/Frequency * class interval
= 30 + (60-42)/20*10
=30+18/20 *10
=30+9
=39
Mode = Amount spent 20£-30£ has a highest frequency to 22 customers. Therefore, mode is
calculated as under:
= 20+ (22-20)/ (22-20) + (22-20)*10
5 | P a g e
= 25
Conclusion: The mean of the amount spent is 43.33. It indicate that individual
customers spent up to 43.33£ on an average basis. However, the median and mode of the
series are 39 and 25. It indicate that 50 percent of the customers spend up to 39£ while mode
indicate that high number of customers spend amounted to 25£. Therefore, it can be
concluded that the seller has to make promotion of such products that prices are lower than
40£.
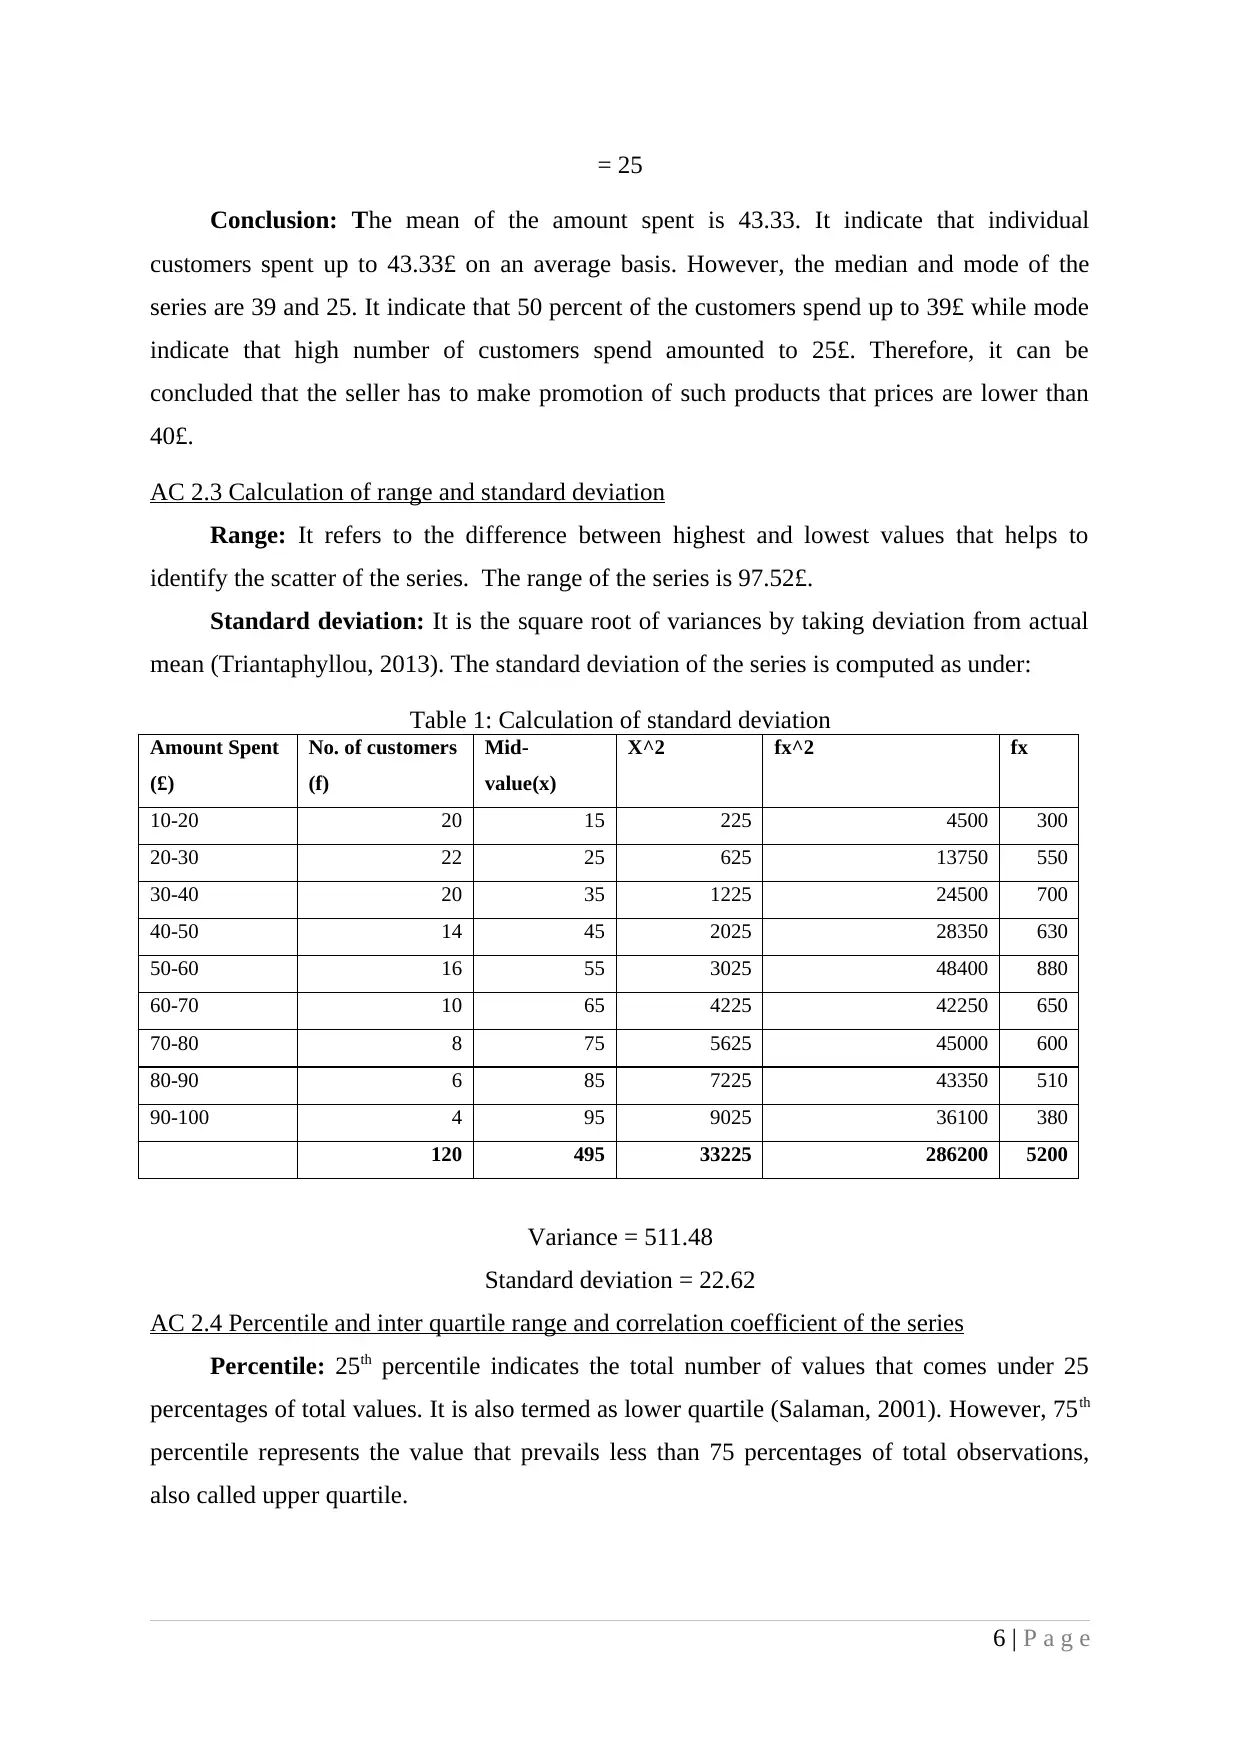
AC 2.3 Calculation of range and standard deviation
Range: It refers to the difference between highest and lowest values that helps to
identify the scatter of the series. The range of the series is 97.52£.
Standard deviation: It is the square root of variances by taking deviation from actual
mean (Triantaphyllou, 2013). The standard deviation of the series is computed as under:
Table 1: Calculation of standard deviation
Amount Spent
(£)
No. of customers
(f)
Mid-
value(x)
X^2 fx^2 fx
10-20 20 15 225 4500 300
20-30 22 25 625 13750 550
30-40 20 35 1225 24500 700
40-50 14 45 2025 28350 630
50-60 16 55 3025 48400 880
60-70 10 65 4225 42250 650
70-80 8 75 5625 45000 600
80-90 6 85 7225 43350 510
90-100 4 95 9025 36100 380
120 495 33225 286200 5200
Variance = 511.48
Standard deviation = 22.62
AC 2.4 Percentile and inter quartile range and correlation coefficient of the series
Percentile: 25th percentile indicates the total number of values that comes under 25
percentages of total values. It is also termed as lower quartile (Salaman, 2001). However, 75th
percentile represents the value that prevails less than 75 percentages of total observations,
also called upper quartile.
6 | P a g e
Conclusion: The mean of the amount spent is 43.33. It indicate that individual
customers spent up to 43.33£ on an average basis. However, the median and mode of the
series are 39 and 25. It indicate that 50 percent of the customers spend up to 39£ while mode
indicate that high number of customers spend amounted to 25£. Therefore, it can be
concluded that the seller has to make promotion of such products that prices are lower than
40£.
AC 2.3 Calculation of range and standard deviation
Range: It refers to the difference between highest and lowest values that helps to
identify the scatter of the series. The range of the series is 97.52£.
Standard deviation: It is the square root of variances by taking deviation from actual
mean (Triantaphyllou, 2013). The standard deviation of the series is computed as under:
Table 1: Calculation of standard deviation
Amount Spent
(£)
No. of customers
(f)
Mid-
value(x)
X^2 fx^2 fx
10-20 20 15 225 4500 300
20-30 22 25 625 13750 550
30-40 20 35 1225 24500 700
40-50 14 45 2025 28350 630
50-60 16 55 3025 48400 880
60-70 10 65 4225 42250 650
70-80 8 75 5625 45000 600
80-90 6 85 7225 43350 510
90-100 4 95 9025 36100 380
120 495 33225 286200 5200
Variance = 511.48
Standard deviation = 22.62
AC 2.4 Percentile and inter quartile range and correlation coefficient of the series
Percentile: 25th percentile indicates the total number of values that comes under 25
percentages of total values. It is also termed as lower quartile (Salaman, 2001). However, 75th
percentile represents the value that prevails less than 75 percentages of total observations,
also called upper quartile.
6 | P a g e
⊘ This is a preview!⊘
Do you want full access?
Subscribe today to unlock all pages.
Trusted by 1+ million students worldwide
As per the given scenario, lower quartile or 25th Percentile is 24.5£ while Upper quartile or
75th percentile is 58.8£. Thus, it can be said that 25th percentage of total spending comes
under 24.5£ while 75th percentage of total spending comes under 58.8£.
Inter quartile range: It is a measure of variability that is based on dividing a data set
into quartiles. It is the difference between Upper quartile and lower quartile. In other words, it
is the difference between 75th percentile and 25th Percentile. The interquartile range is
calculated as under:
Inter Quartile Range (IQR) = Upper Quartile – Lower Quartile
= 58.8 – 24.5
= 34.2
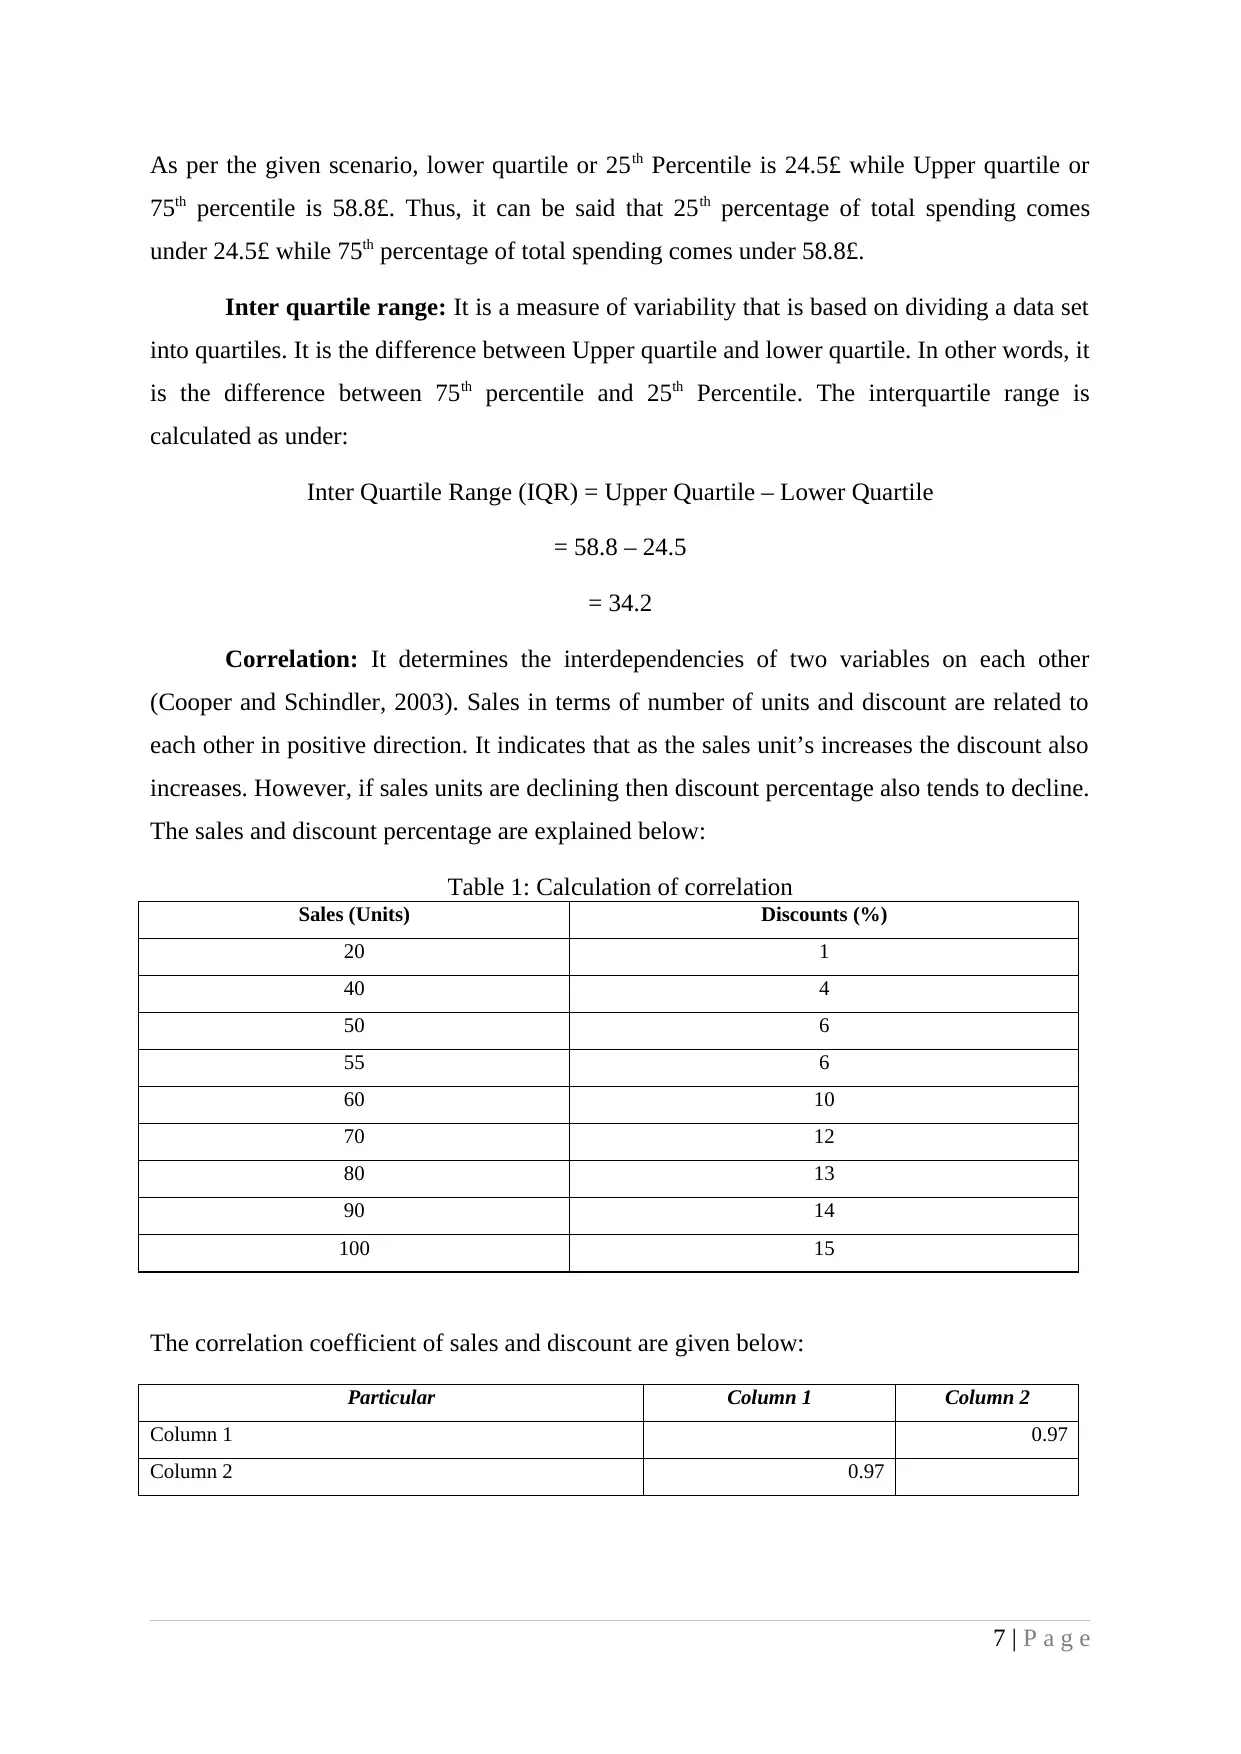
Correlation: It determines the interdependencies of two variables on each other
(Cooper and Schindler, 2003). Sales in terms of number of units and discount are related to
each other in positive direction. It indicates that as the sales unit’s increases the discount also
increases. However, if sales units are declining then discount percentage also tends to decline.
The sales and discount percentage are explained below:
Table 1: Calculation of correlation
Sales (Units) Discounts (%)
20 1
40 4
50 6
55 6
60 10
70 12
80 13
90 14
100 15
The correlation coefficient of sales and discount are given below:
Particular Column 1 Column 2
Column 1 0.97
Column 2 0.97
7 | P a g e
75th percentile is 58.8£. Thus, it can be said that 25th percentage of total spending comes
under 24.5£ while 75th percentage of total spending comes under 58.8£.
Inter quartile range: It is a measure of variability that is based on dividing a data set
into quartiles. It is the difference between Upper quartile and lower quartile. In other words, it
is the difference between 75th percentile and 25th Percentile. The interquartile range is
calculated as under:
Inter Quartile Range (IQR) = Upper Quartile – Lower Quartile
= 58.8 – 24.5
= 34.2
Correlation: It determines the interdependencies of two variables on each other
(Cooper and Schindler, 2003). Sales in terms of number of units and discount are related to
each other in positive direction. It indicates that as the sales unit’s increases the discount also
increases. However, if sales units are declining then discount percentage also tends to decline.
The sales and discount percentage are explained below:
Table 1: Calculation of correlation
Sales (Units) Discounts (%)
20 1
40 4
50 6
55 6
60 10
70 12
80 13
90 14
100 15
The correlation coefficient of sales and discount are given below:
Particular Column 1 Column 2
Column 1 0.97
Column 2 0.97
7 | P a g e
Paraphrase This Document
Need a fresh take? Get an instant paraphrase of this document with our AI Paraphraser
Conclusion: The correlation coefficient between sale units and cost is 0.97. It implies
that both the variables are highly related with each other in positive direction.
TASK 3
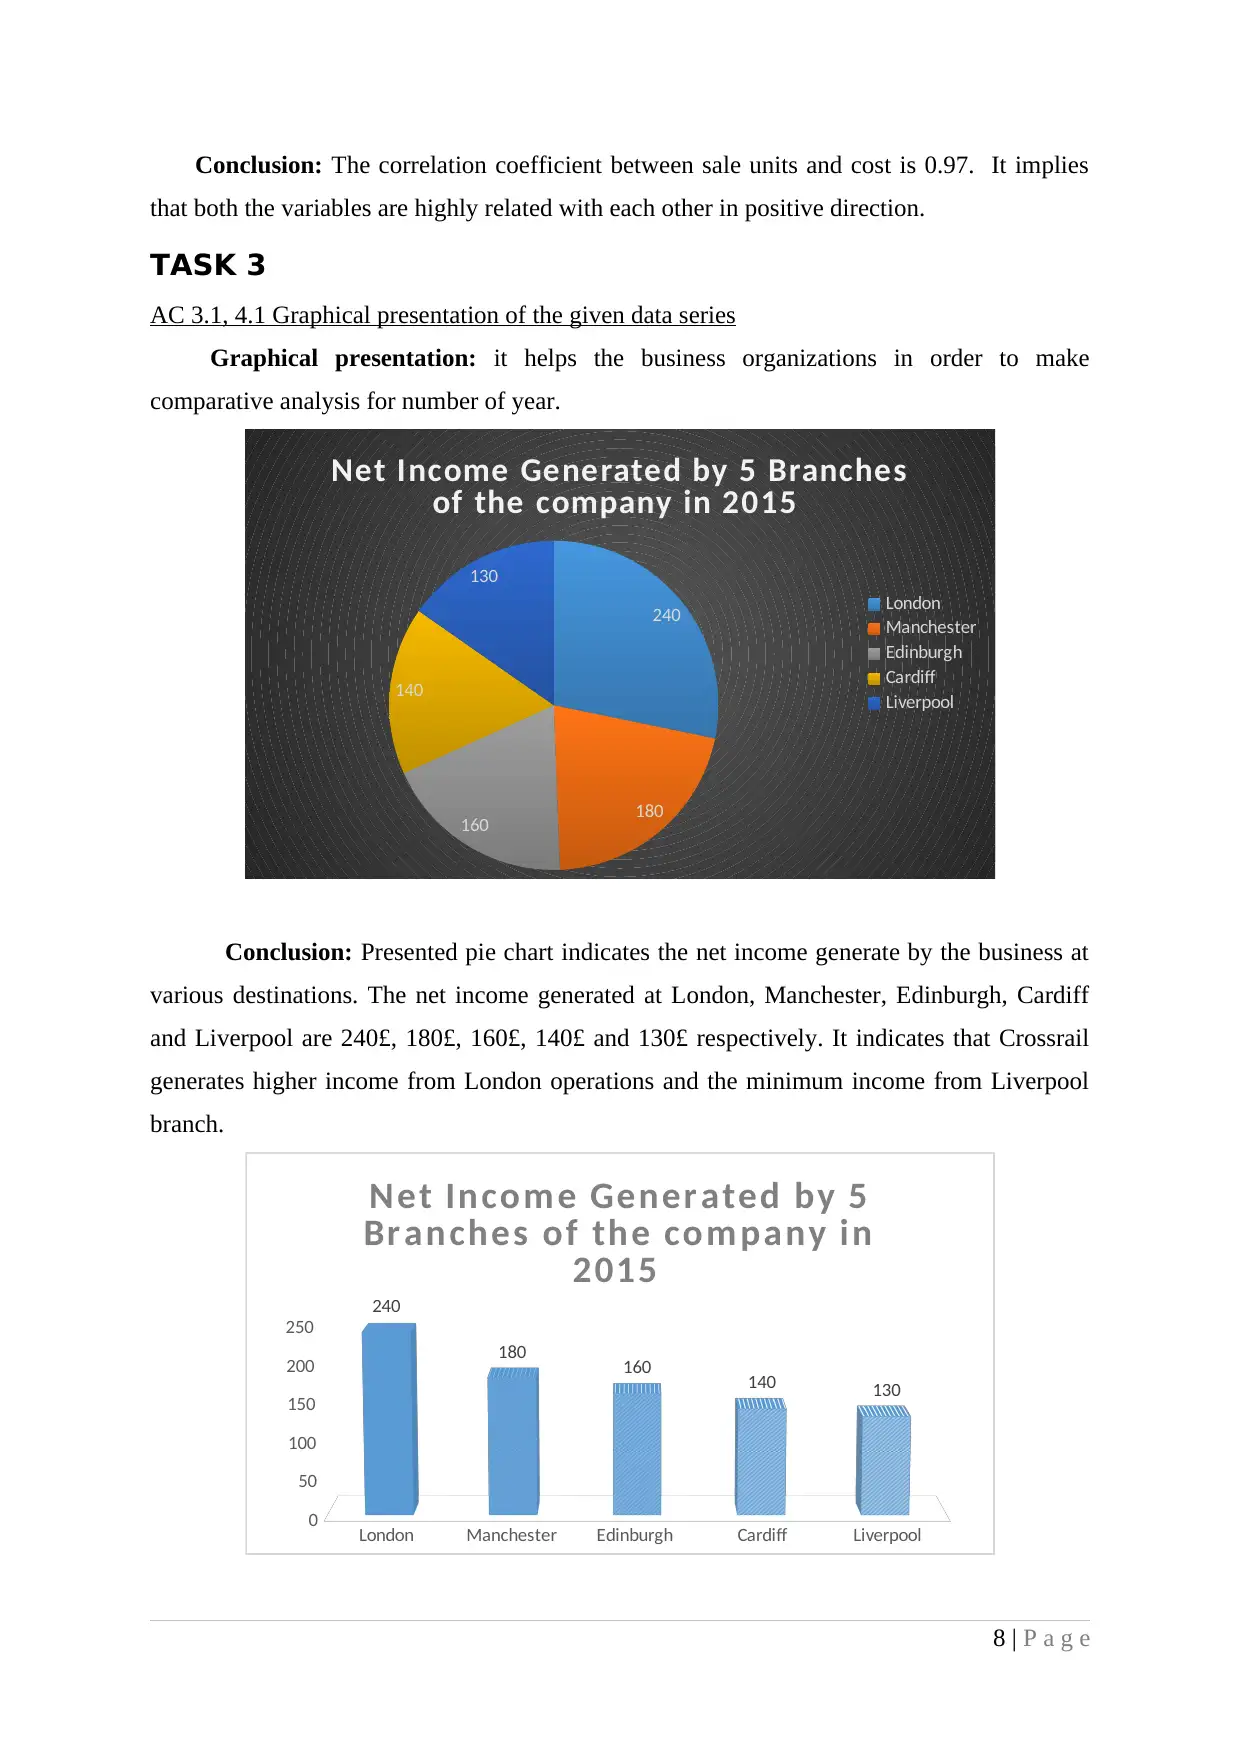
AC 3.1, 4.1 Graphical presentation of the given data series
Graphical presentation: it helps the business organizations in order to make
comparative analysis for number of year.
240
180
160
140
130
Net Income Generated by 5 Branches
of the company in 2015
London
Manchester
Edinburgh
Cardiff
Liverpool
Conclusion: Presented pie chart indicates the net income generate by the business at
various destinations. The net income generated at London, Manchester, Edinburgh, Cardiff
and Liverpool are 240£, 180£, 160£, 140£ and 130£ respectively. It indicates that Crossrail
generates higher income from London operations and the minimum income from Liverpool
branch.
London Manchester Edinburgh Cardiff Liverpool
0
50
100
150
200
250
240
180 160 140 130
Net Incom e Generated by 5
Branches of the company in
2015
8 | P a g e
that both the variables are highly related with each other in positive direction.
TASK 3
AC 3.1, 4.1 Graphical presentation of the given data series
Graphical presentation: it helps the business organizations in order to make
comparative analysis for number of year.
240
180
160
140
130
Net Income Generated by 5 Branches
of the company in 2015
London
Manchester
Edinburgh
Cardiff
Liverpool
Conclusion: Presented pie chart indicates the net income generate by the business at
various destinations. The net income generated at London, Manchester, Edinburgh, Cardiff
and Liverpool are 240£, 180£, 160£, 140£ and 130£ respectively. It indicates that Crossrail
generates higher income from London operations and the minimum income from Liverpool
branch.
London Manchester Edinburgh Cardiff Liverpool
0
50
100
150
200
250
240
180 160 140 130
Net Incom e Generated by 5
Branches of the company in
2015
8 | P a g e
Conclusion: Bar chart is also prepared for making analysis of net income by
operations from different branches. It helps to make the comparative net income analysis
generated by the company. On the basis of above bar graph, it indicates that Crossrail
generates greater revenues from London branch. However, the Liverpool is getting fewer
amounts of revenues than other branches. Therefore, it become advisable that company
should make investment at the Liverpool, Cardiff and Edinburgh in order to increase its
revenues. Crossrail should make efforts and take necessary decisions so as to enhance such
branch revenues. This helps the company to increase its overall revenue and also the
profitability. This in turn, resulted in increased the business growth and business success.
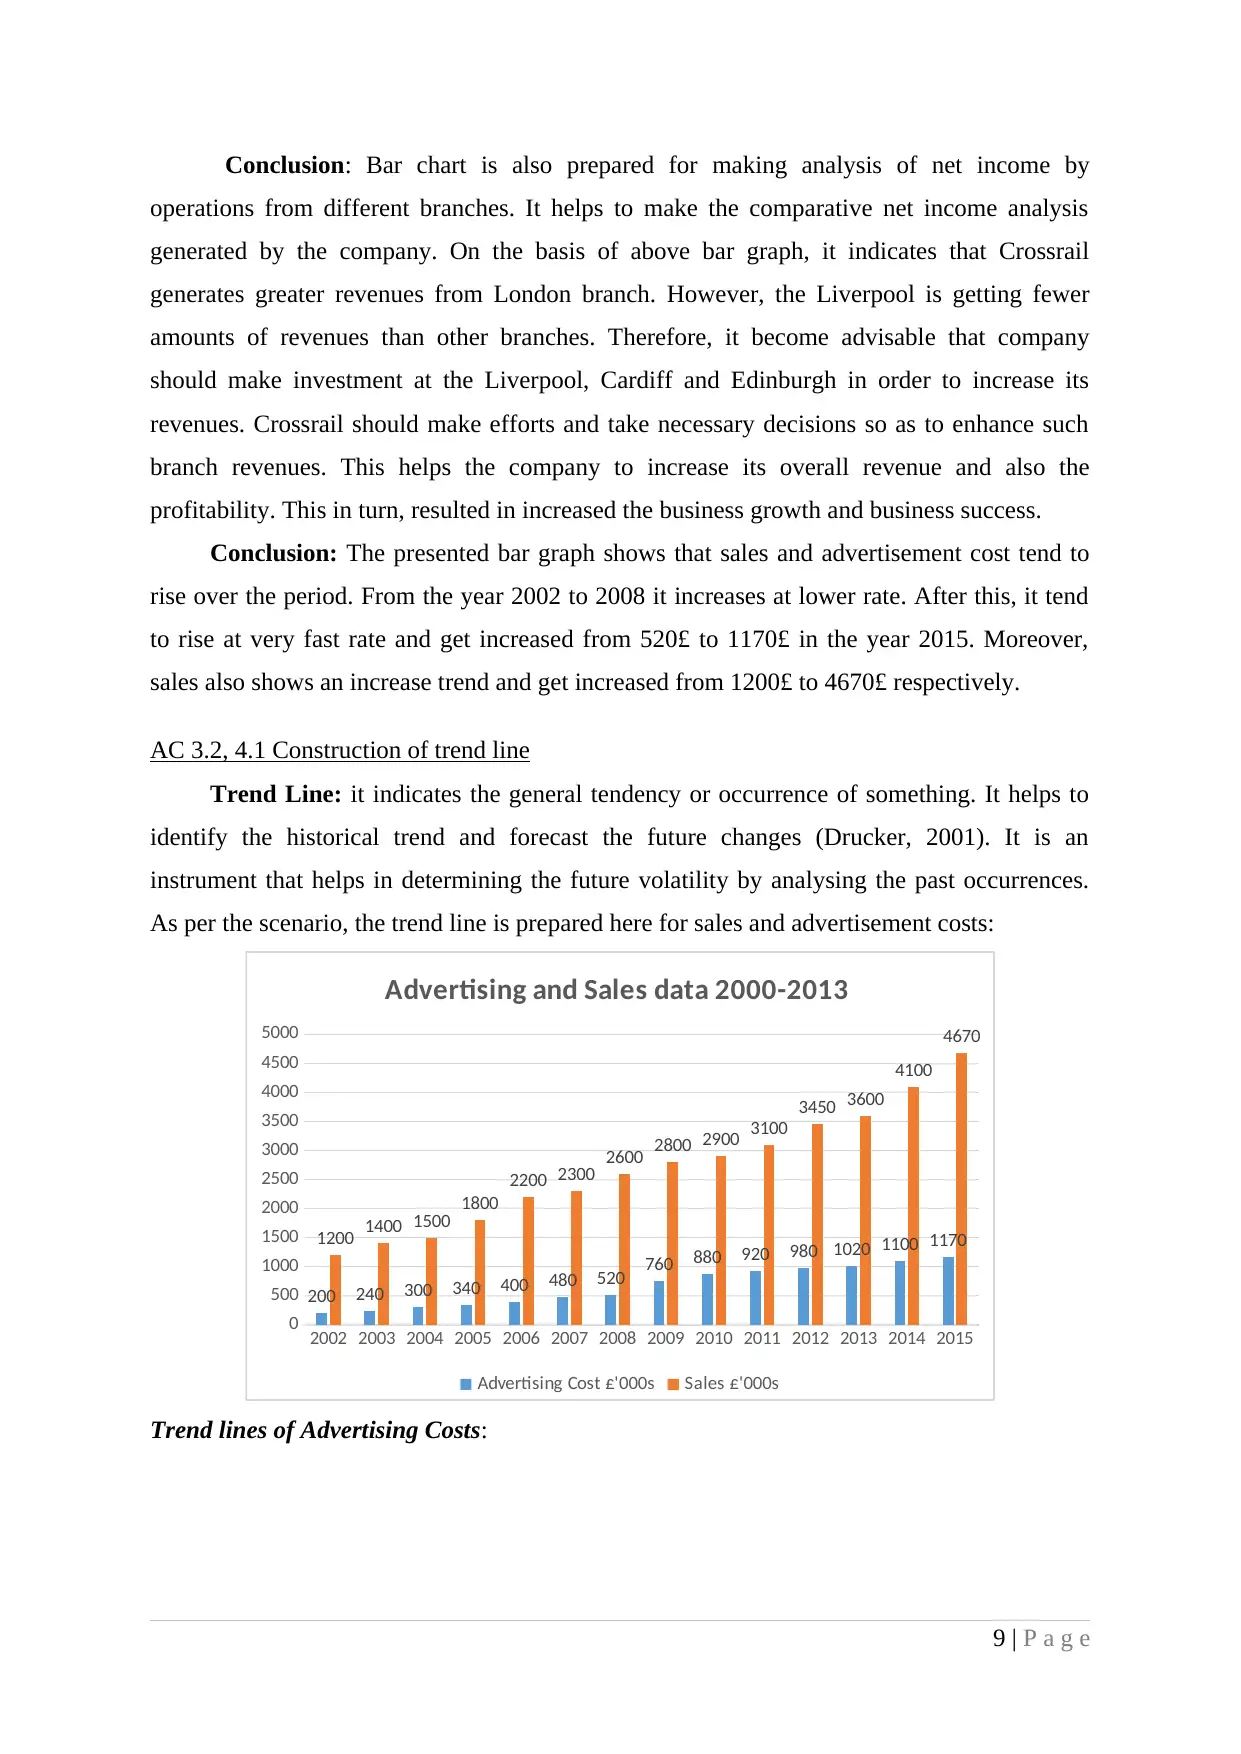
Conclusion: The presented bar graph shows that sales and advertisement cost tend to
rise over the period. From the year 2002 to 2008 it increases at lower rate. After this, it tend
to rise at very fast rate and get increased from 520£ to 1170£ in the year 2015. Moreover,
sales also shows an increase trend and get increased from 1200£ to 4670£ respectively.
AC 3.2, 4.1 Construction of trend line
Trend Line: it indicates the general tendency or occurrence of something. It helps to
identify the historical trend and forecast the future changes (Drucker, 2001). It is an
instrument that helps in determining the future volatility by analysing the past occurrences.
As per the scenario, the trend line is prepared here for sales and advertisement costs:
2002 2003 2004 2005 2006 2007 2008 2009 2010 2011 2012 2013 2014 2015
0
500
1000
1500
2000
2500
3000
3500
4000
4500
5000
200 240 300 340 400 480 520 760 880 920 980 1020 1100 11701200 1400 1500 1800
2200 2300 2600 2800 2900 3100
3450 3600
4100
4670
Advertising and Sales data 2000-2013
Advertising Cost £'000s Sales £'000s
Trend lines of Advertising Costs:
9 | P a g e
operations from different branches. It helps to make the comparative net income analysis
generated by the company. On the basis of above bar graph, it indicates that Crossrail
generates greater revenues from London branch. However, the Liverpool is getting fewer
amounts of revenues than other branches. Therefore, it become advisable that company
should make investment at the Liverpool, Cardiff and Edinburgh in order to increase its
revenues. Crossrail should make efforts and take necessary decisions so as to enhance such
branch revenues. This helps the company to increase its overall revenue and also the
profitability. This in turn, resulted in increased the business growth and business success.
Conclusion: The presented bar graph shows that sales and advertisement cost tend to
rise over the period. From the year 2002 to 2008 it increases at lower rate. After this, it tend
to rise at very fast rate and get increased from 520£ to 1170£ in the year 2015. Moreover,
sales also shows an increase trend and get increased from 1200£ to 4670£ respectively.
AC 3.2, 4.1 Construction of trend line
Trend Line: it indicates the general tendency or occurrence of something. It helps to
identify the historical trend and forecast the future changes (Drucker, 2001). It is an
instrument that helps in determining the future volatility by analysing the past occurrences.
As per the scenario, the trend line is prepared here for sales and advertisement costs:
2002 2003 2004 2005 2006 2007 2008 2009 2010 2011 2012 2013 2014 2015
0
500
1000
1500
2000
2500
3000
3500
4000
4500
5000
200 240 300 340 400 480 520 760 880 920 980 1020 1100 11701200 1400 1500 1800
2200 2300 2600 2800 2900 3100
3450 3600
4100
4670
Advertising and Sales data 2000-2013
Advertising Cost £'000s Sales £'000s
Trend lines of Advertising Costs:
9 | P a g e
⊘ This is a preview!⊘
Do you want full access?
Subscribe today to unlock all pages.
Trusted by 1+ million students worldwide
1 out of 19
Related Documents


Your All-in-One AI-Powered Toolkit for Academic Success.
+13062052269
info@desklib.com
Available 24*7 on WhatsApp / Email
![[object Object]](/_next/static/media/star-bottom.7253800d.svg)
Unlock your academic potential
Copyright © 2020–2026 A2Z Services. All Rights Reserved. Developed and managed by ZUCOL.