Investigating Petrol Price Trends: Crude Oil and Retail Price Analysis
VerifiedAdded on  2023/04/21
|12
|1971
|88
Report
AI Summary
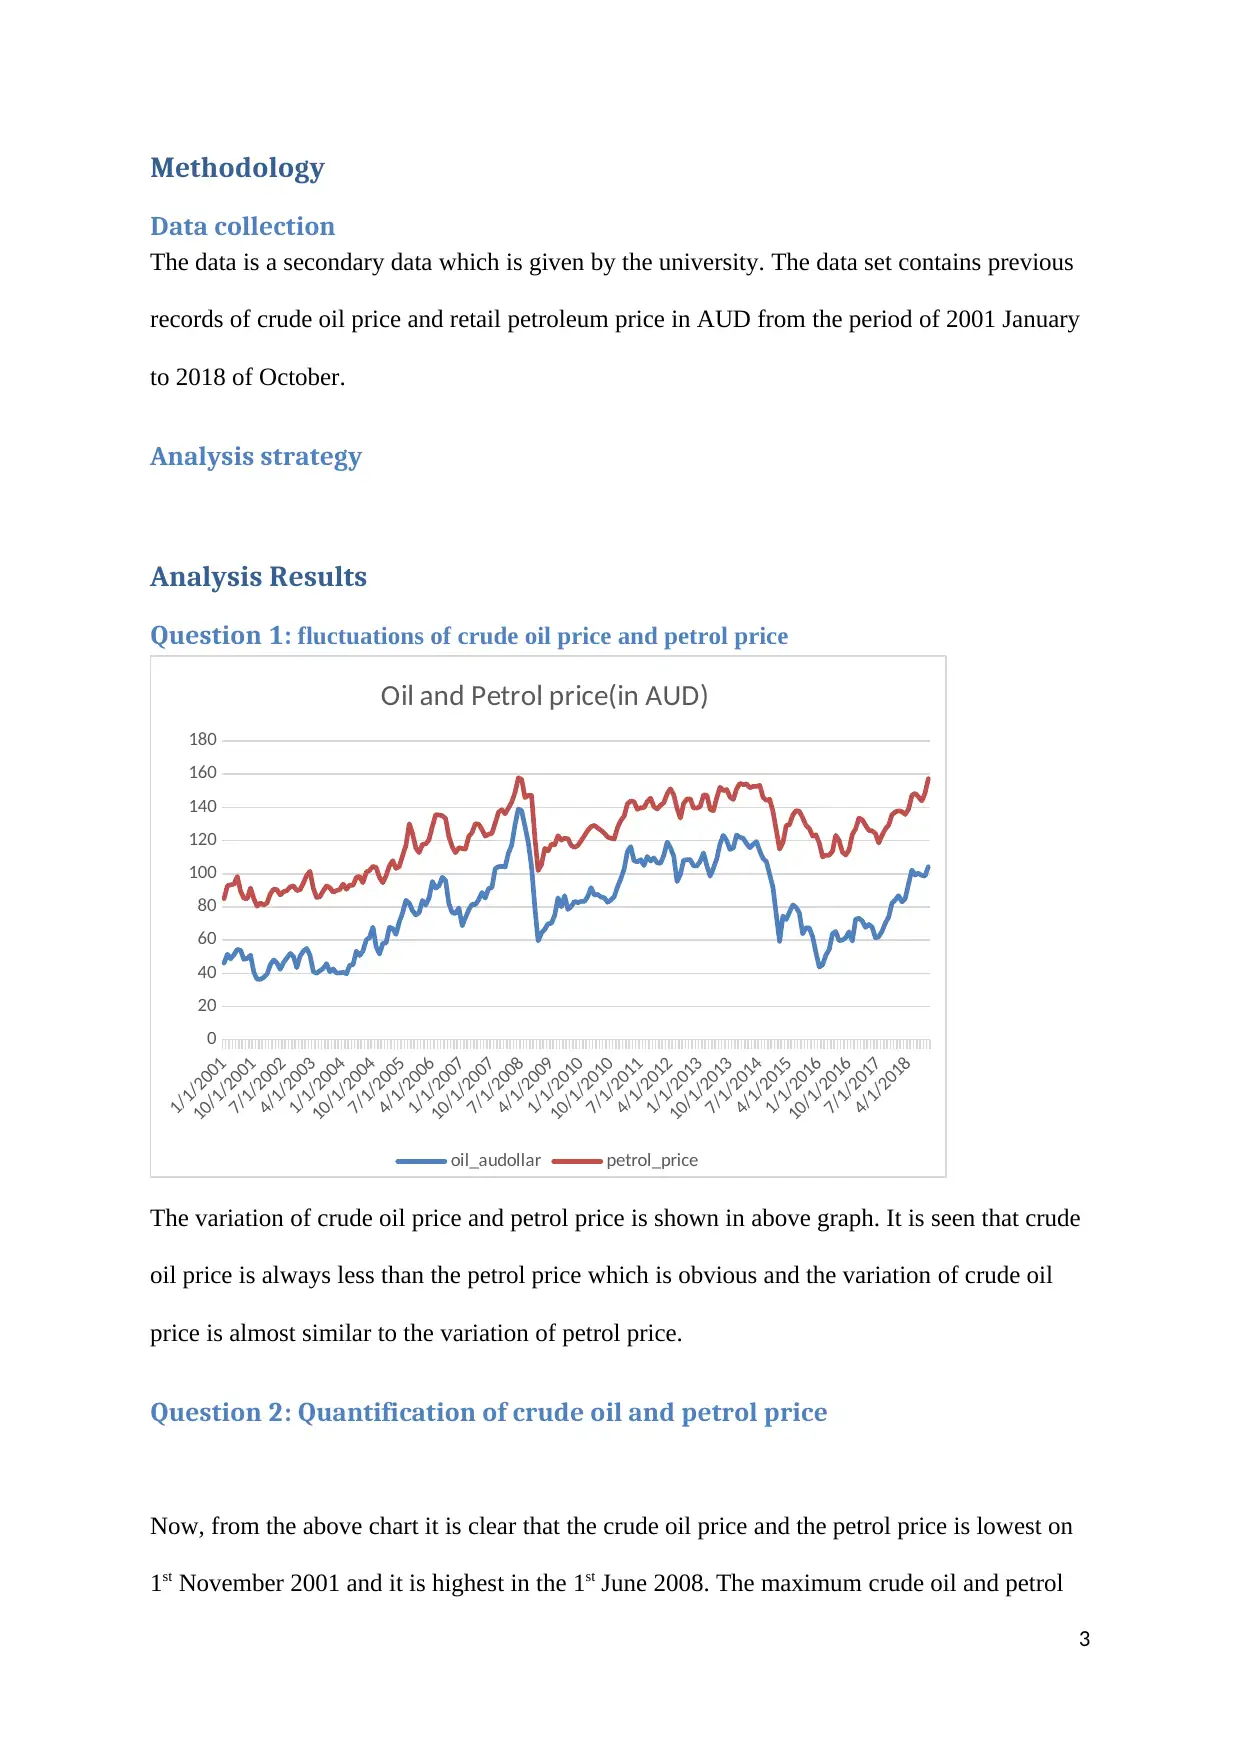
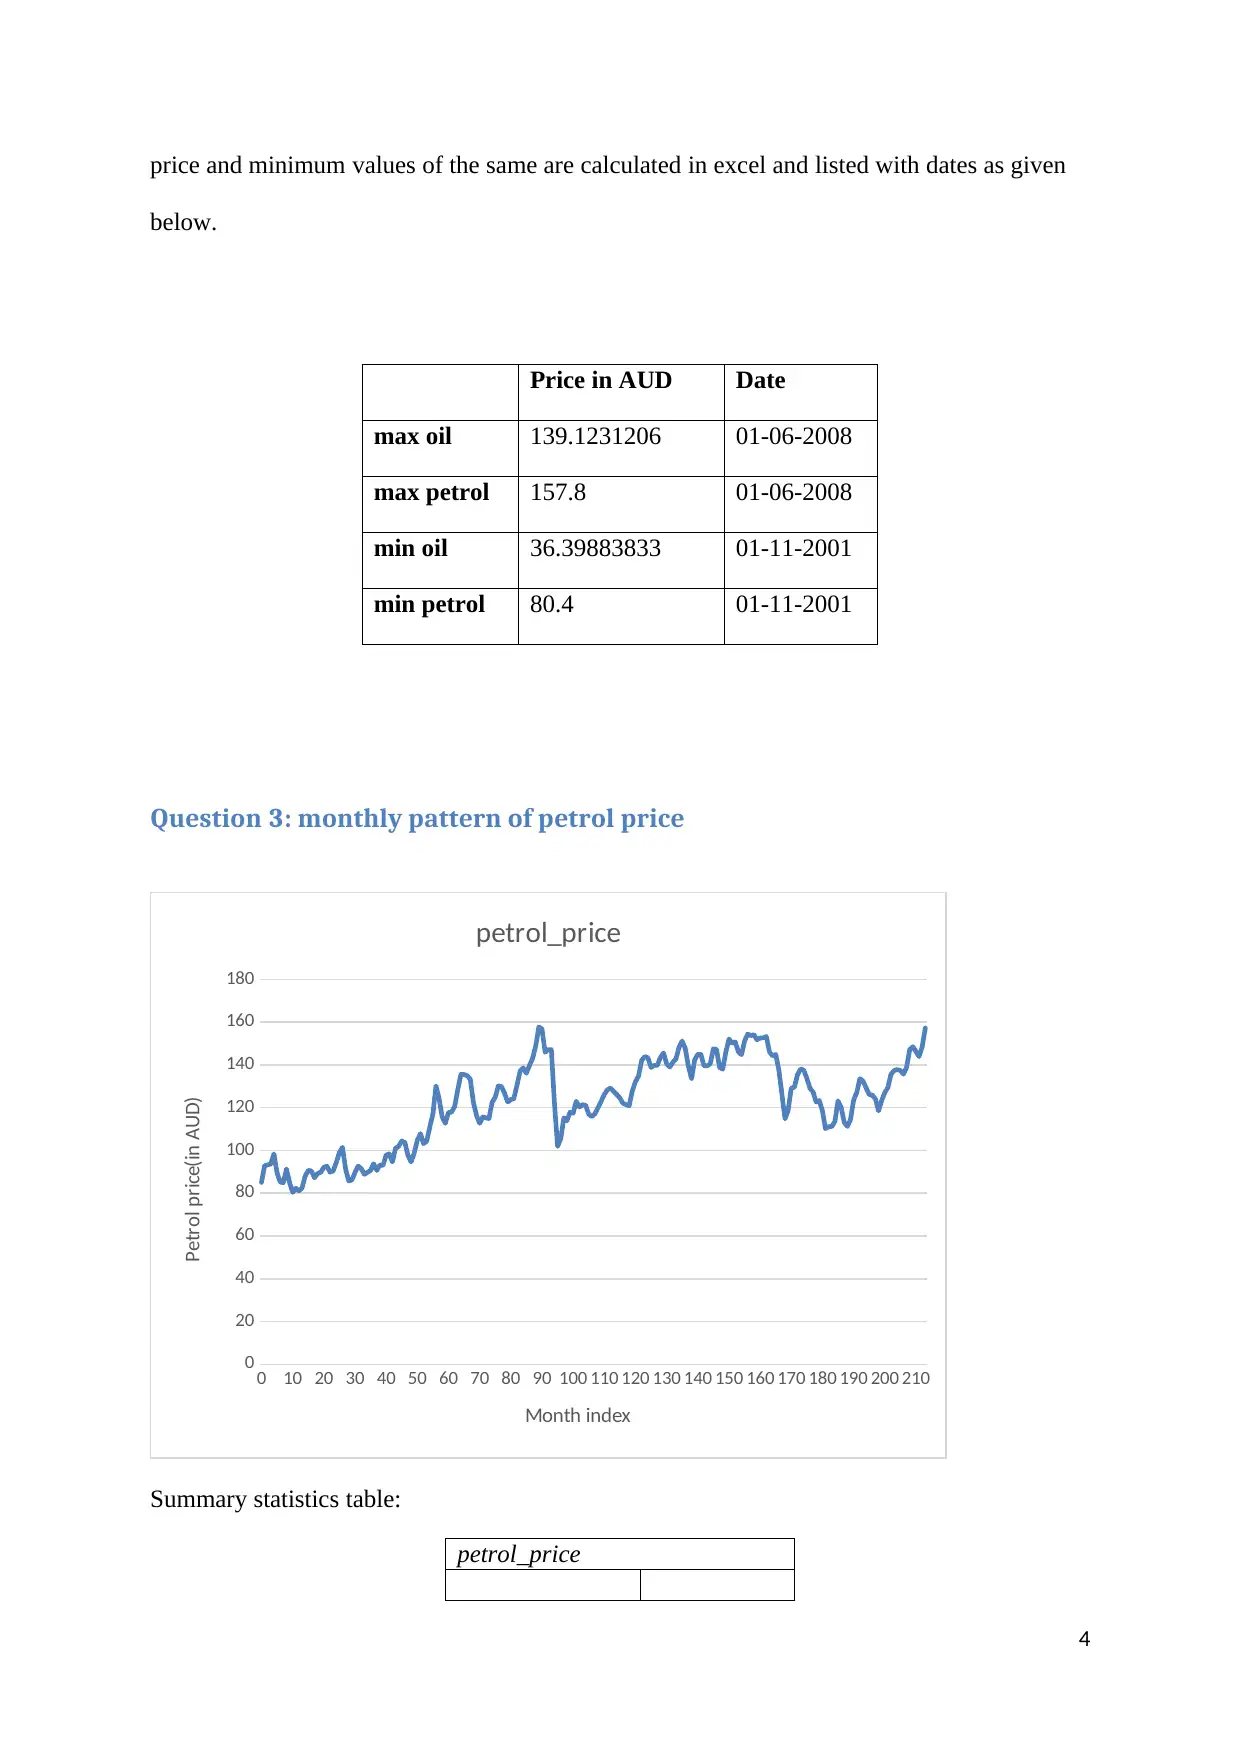
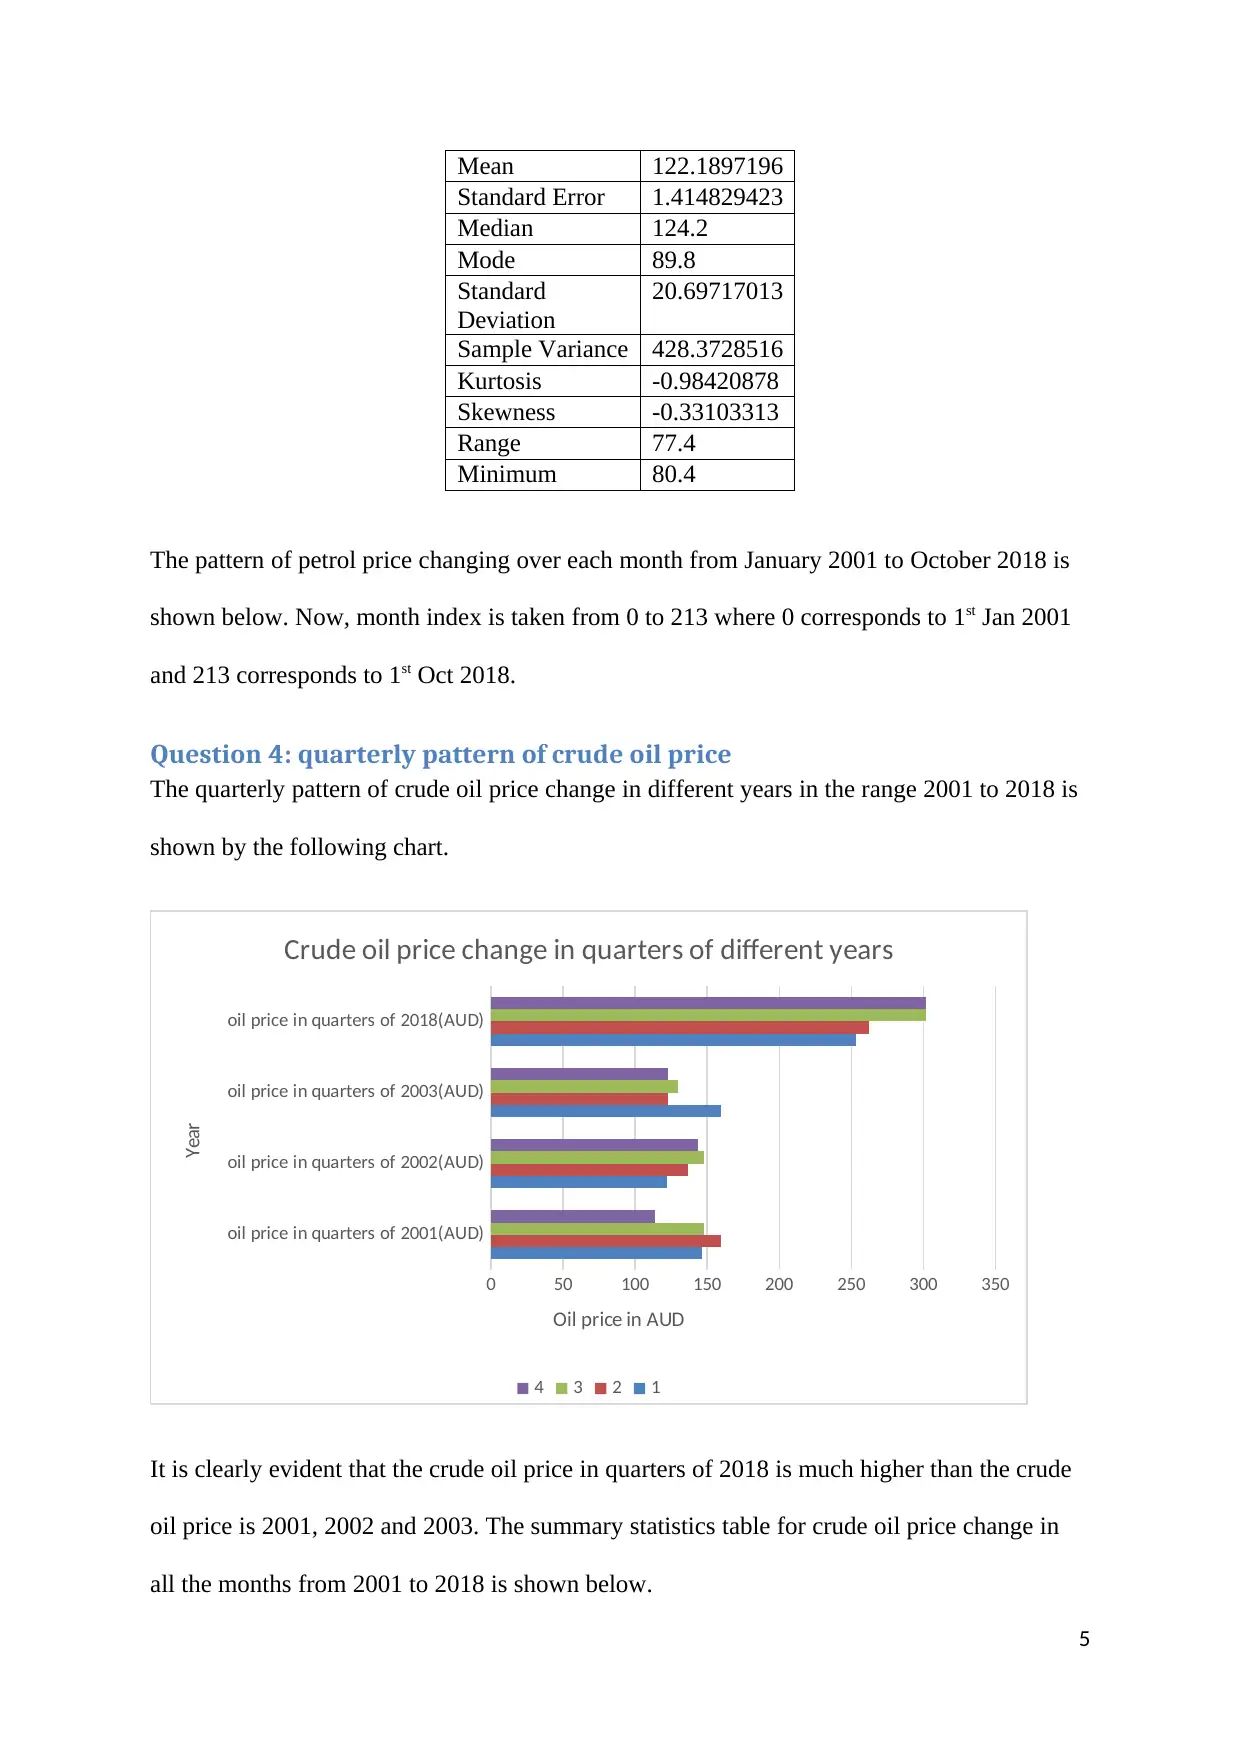
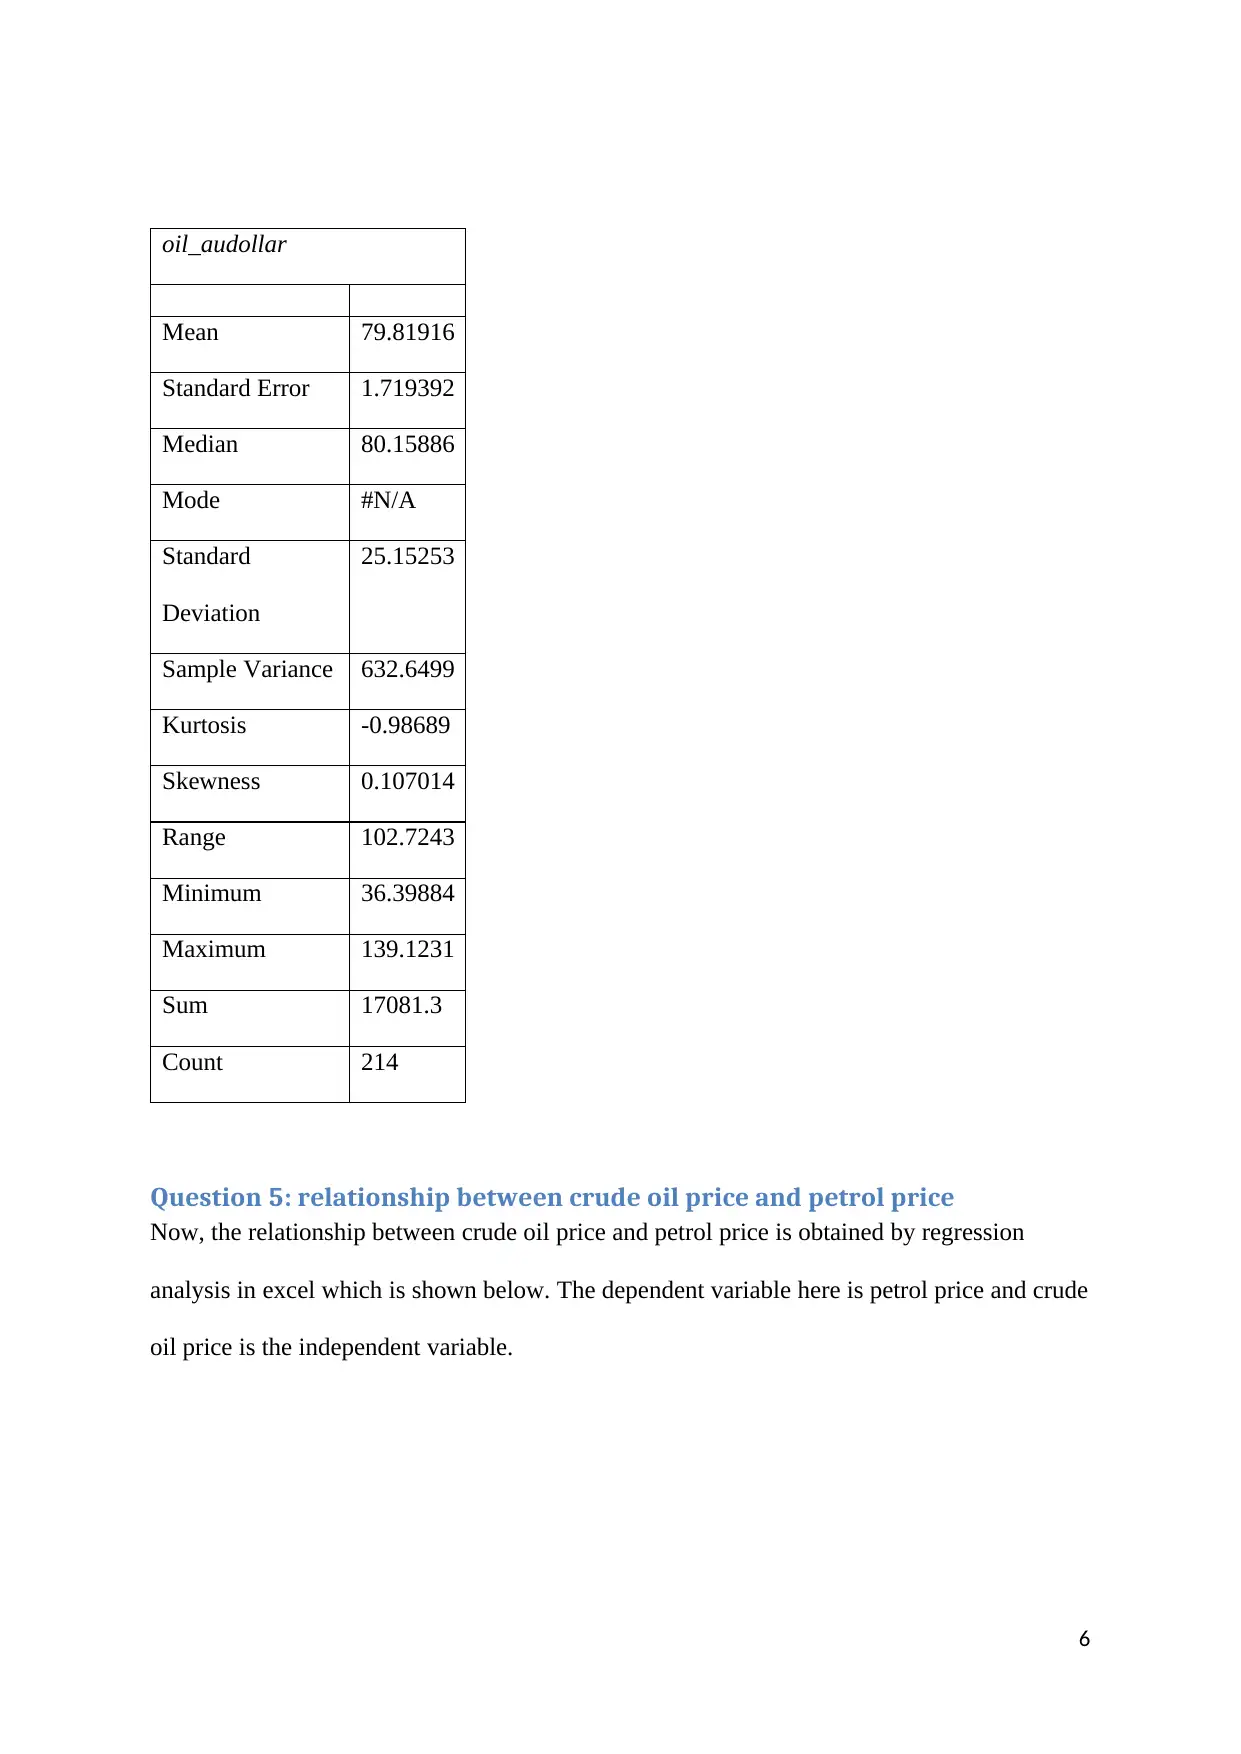
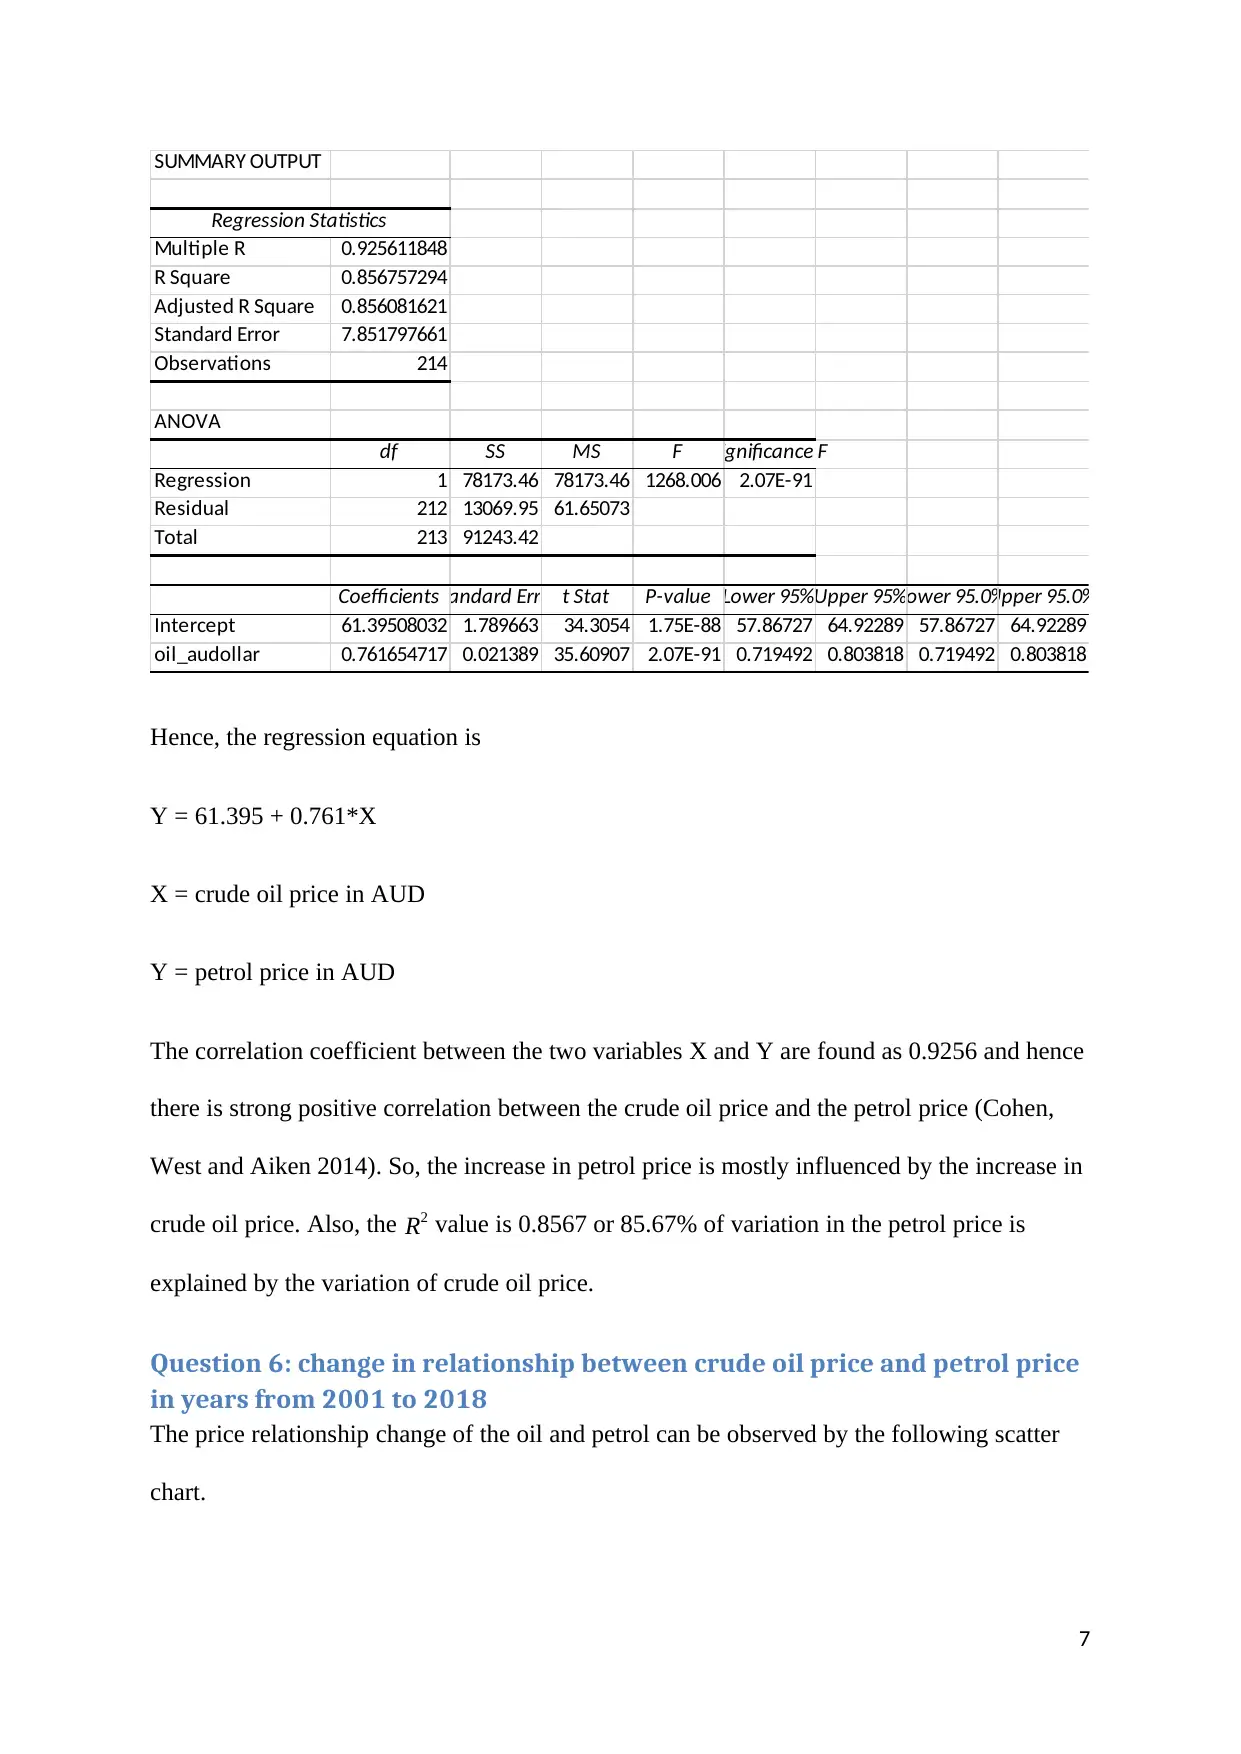
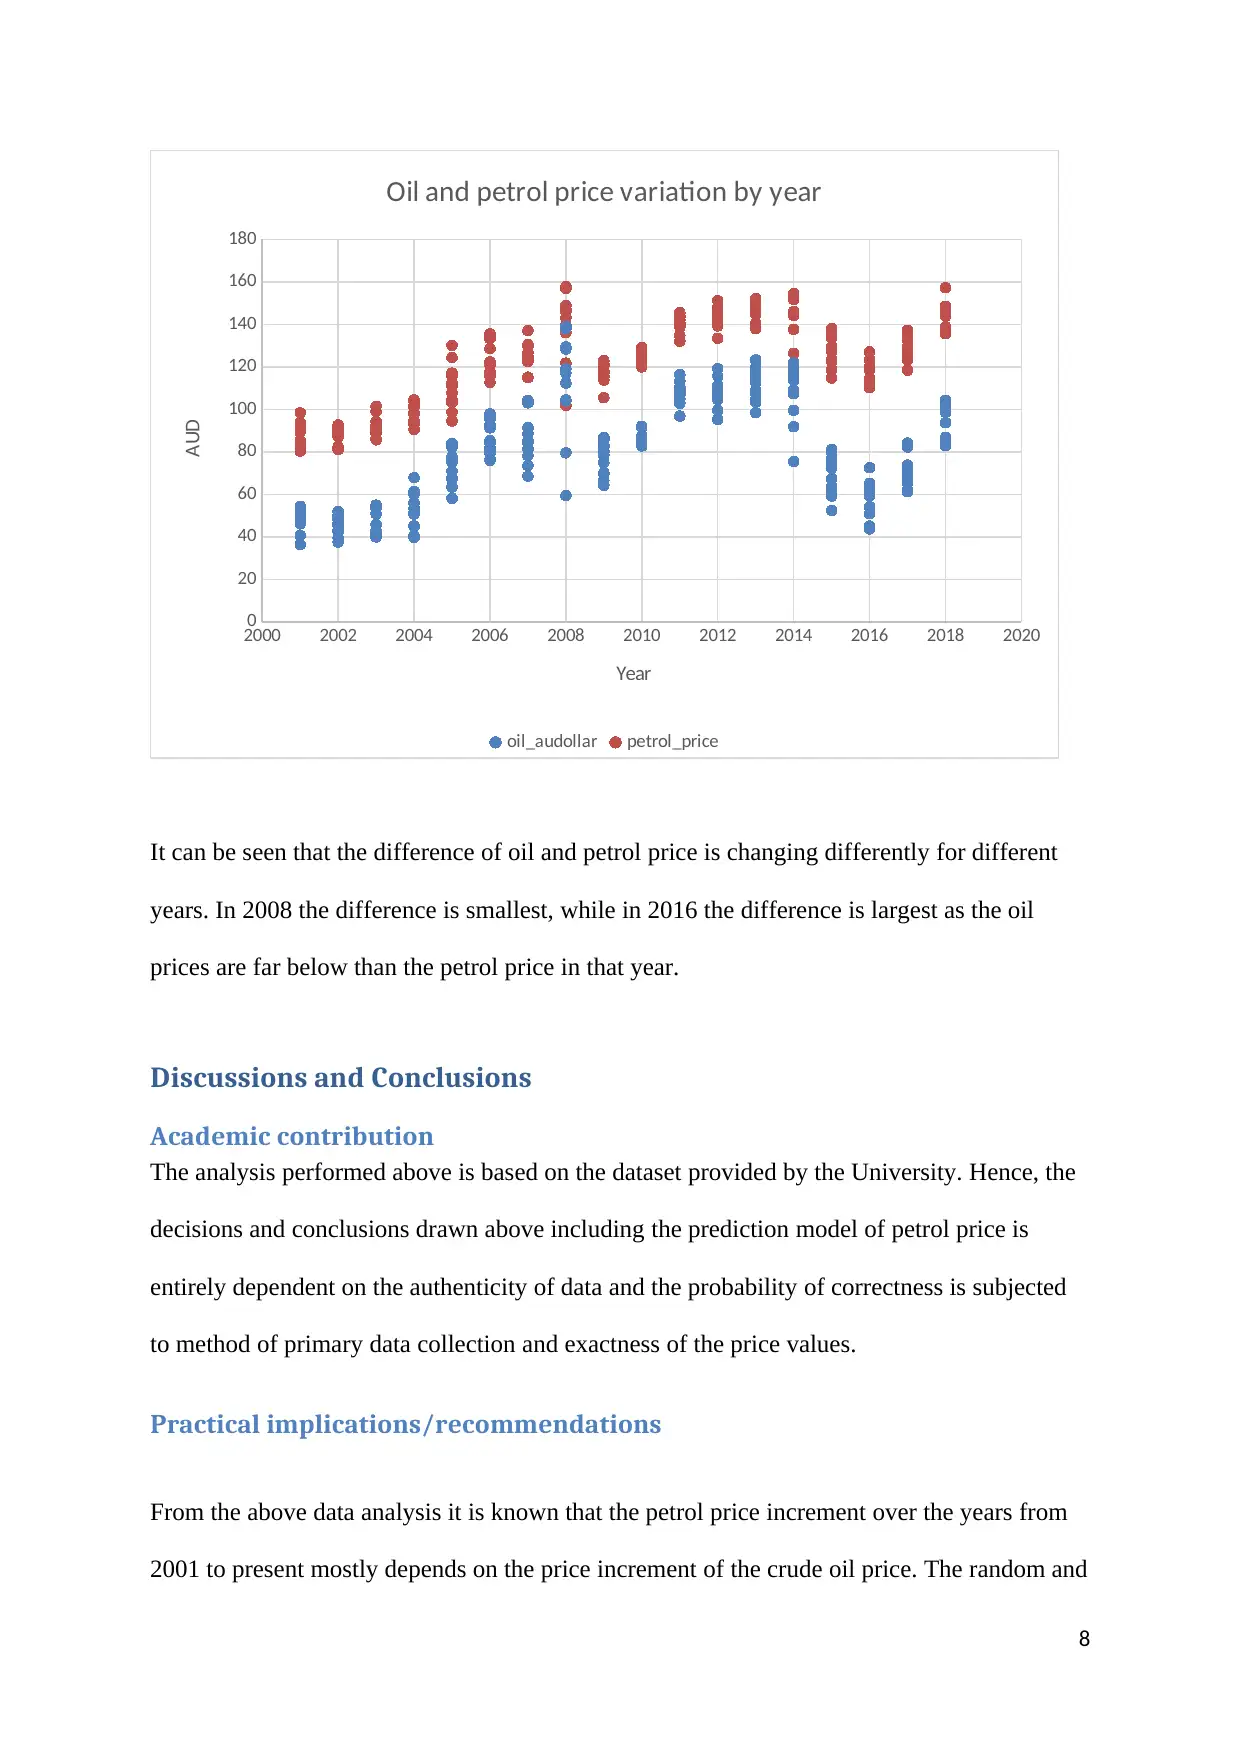
This report investigates the relationship between crude oil and petrol prices in Australia from January 2001 to October 2018. The analysis utilizes data provided by the university, employing MS Excel for data visualization and analysis to address specific questions outlined in the assignment brief. The study begins by examining the fluctuations of both crude oil and petrol prices over time, presenting a comparative chart illustrating their trends. The report then quantifies and compares these fluctuations, identifying the maximum and minimum price points for both. Further analysis explores the monthly and quarterly patterns of petrol and crude oil prices, respectively, using summary statistics to highlight trends. Finally, the study conducts a regression analysis to determine the correlation between crude oil and petrol prices, constructing a predictive model and assessing its validity. The findings reveal a strong positive correlation, suggesting that petrol price changes are significantly influenced by crude oil price variations, with the regression model explaining a substantial portion of petrol price fluctuations. The report concludes with a discussion of academic contributions, practical implications, limitations of the study, and recommendations for future research, including the need for a larger sample size and more comprehensive data collection methods.

INDIVIDUAL TASK COVER SHEET
Title
Name
Student Number
Who it is for
Usually place a representative graphic either your own photo or clip art, be careful of copyright
issues.
Title
Name
Student Number
Who it is for
Usually place a representative graphic either your own photo or clip art, be careful of copyright
issues.
Paraphrase This Document
Need a fresh take? Get an instant paraphrase of this document with our AI Paraphraser

INDIVIDUAL TASK COVER SHEET
Table of Contents
Introduction...........................................................................................................................................1
Background........................................................................................................................................1
Aim and objectives............................................................................................................................1
Context..................................................................................................................................................1
World wide........................................................................................................................................1
Australia............................................................................................................................................1
Methodology.........................................................................................................................................1
Data collection...................................................................................................................................1
Analysis strategy................................................................................................................................1
Analysis Results.....................................................................................................................................1
Question 1.........................................................................................................................................1
Question 2.........................................................................................................................................1
Question …........................................................................................................................................1
Discussions and Conclusions..................................................................................................................1
Academic contribution......................................................................................................................1
Practical implications/recommendations..........................................................................................1
Limitations and future work..............................................................................................................1
References.............................................................................................................................................2

Introduction
Petrol is one of the most essential product which is used by most of the car and engine owner
throughout Australia and world. Hence, the change in price of petrol affects the lifestyle of
normal people as most of the businesses use cars, trucks and other vehicle for transporting the
business materials (Hashimi and Jeffreys 2016). The effect of the petrol price increase is
more evident to the poorer section of people rather than to the people above poverty limit.
Hence, it is necessary to investigate the root causes of increase in petrol price specifically in
Australia.
Background
Now, the increase in petrol price affects more all less every sections like the transportation,
auto, textiles, manufacturing and household expenses. If the price is increased for a longer
period then eventually banking sector is also gets affected by it. Increase in food price is
commonly visible just after the increase in petrol price. Then if the price is not reduced then it
will affect more or less every section of system like a chain reaction starting from
transportation cost increase to increase in goods price and eventually forces the public to
make more expenses on day by day basis (Wadud 2015). Now, the price increase is
sometimes used by the petrol traders for their benefits and thus it affects the common people
more. Now, the most common cause petrol price increase in Australia is the increment in
price of crude oil. Hence, a data analysis of petrol price and crude oil price is performed in
this assignment with a sample of data in certain period from past statistics.
Aim and objectives
1
⊘ This is a preview!⊘
Do you want full access?
Subscribe today to unlock all pages.

Trusted by 1+ million students worldwide

In this assignment the objective is to find a relationship between the petrol price and crude oil
price by data analysis methods to investigate the change in petrol price is justified or not.
Additionally, a predictive model with charts will be produced which will predict the petrol
price for a given crude oil price with certain probability of confidence. The validity of the
model will also be shown and how much variation of crude oil price change is expressed by
the petrol price change will be shown in this assignment.
Context
World wide
Currently, price of the petrol is changing worldwide and change is not uniform in each
countries. The countries with poor economic conditions (like mostly African countries) are
getting mostly affected by the price hike. Hence, it is required to find out the causes of petrol
price change.
Australia
In Australia the petrol price change is observed in various places like Sydney, New South
Wales, Melbourne and other cities. The current petrol price in Melbourne is 171.9 cents per
litre, in New South Wales it is 165.9 cents/litre and west part of Sydney is 139.9 cents per
litre (Wadud 2015). Hence, as the price is affecting most of automobile and machinery
industries around Australia, it is required find the crude oil price change in association with
petrol price change and whether the petrol price change is justified.
2
Paraphrase This Document
Need a fresh take? Get an instant paraphrase of this document with our AI Paraphraser

Methodology
Data collection
The data is a secondary data which is given by the university. The data set contains previous
records of crude oil price and retail petroleum price in AUD from the period of 2001 January
to 2018 of October.
Analysis strategy
Analysis Results
1Question : fluctuations of crude oil price and petrol price
1/1/2001
10/1/2001
7/1/2002
4/1/2003
1/1/2004
10/1/2004
7/1/2005
4/1/2006
1/1/2007
10/1/2007
7/1/2008
4/1/2009
1/1/2010
10/1/2010
7/1/2011
4/1/2012
1/1/2013
10/1/2013
7/1/2014
4/1/2015
1/1/2016
10/1/2016
7/1/2017
4/1/2018
0
20
40
60
80
100
120
140
160
180
Oil and Petrol price(in AUD)
oil_audollar petrol_price
The variation of crude oil price and petrol price is shown in above graph. It is seen that crude
oil price is always less than the petrol price which is obvious and the variation of crude oil
price is almost similar to the variation of petrol price.
Question 2: Quantification of crude oil and petrol price
Now, from the above chart it is clear that the crude oil price and the petrol price is lowest on
1st November 2001 and it is highest in the 1st June 2008. The maximum crude oil and petrol
3

price and minimum values of the same are calculated in excel and listed with dates as given
below.
Price in AUD Date
max oil 139.1231206 01-06-2008
max petrol 157.8 01-06-2008
min oil 36.39883833 01-11-2001
min petrol 80.4 01-11-2001
Question 3: monthly pattern of petrol price
0 10 20 30 40 50 60 70 80 90 100 110 120 130 140 150 160 170 180 190 200 210
0
20
40
60
80
100
120
140
160
180
petrol_price
Month index
Petrol price(in AUD)
Summary statistics table:
petrol_price
4
⊘ This is a preview!⊘
Do you want full access?
Subscribe today to unlock all pages.

Trusted by 1+ million students worldwide

Mean 122.1897196
Standard Error 1.414829423
Median 124.2
Mode 89.8
Standard
Deviation
20.69717013
Sample Variance 428.3728516
Kurtosis -0.98420878
Skewness -0.33103313
Range 77.4
Minimum 80.4
The pattern of petrol price changing over each month from January 2001 to October 2018 is
shown below. Now, month index is taken from 0 to 213 where 0 corresponds to 1st Jan 2001
and 213 corresponds to 1st Oct 2018.
Question 4: quarterly pattern of crude oil price
The quarterly pattern of crude oil price change in different years in the range 2001 to 2018 is
shown by the following chart.
oil price in quarters of 2001(AUD)
oil price in quarters of 2002(AUD)
oil price in quarters of 2003(AUD)
oil price in quarters of 2018(AUD)
0 50 100 150 200 250 300 350
Crude oil price change in quarters of different years
4 3 2 1
Oil price in AUD
Year
It is clearly evident that the crude oil price in quarters of 2018 is much higher than the crude
oil price is 2001, 2002 and 2003. The summary statistics table for crude oil price change in
all the months from 2001 to 2018 is shown below.
5
Paraphrase This Document
Need a fresh take? Get an instant paraphrase of this document with our AI Paraphraser

oil_audollar
Mean 79.81916
Standard Error 1.719392
Median 80.15886
Mode #N/A
Standard
Deviation
25.15253
Sample Variance 632.6499
Kurtosis -0.98689
Skewness 0.107014
Range 102.7243
Minimum 36.39884
Maximum 139.1231
Sum 17081.3
Count 214
Question 5: relationship between crude oil price and petrol price
Now, the relationship between crude oil price and petrol price is obtained by regression
analysis in excel which is shown below. The dependent variable here is petrol price and crude
oil price is the independent variable.
6

SUMMARY OUTPUT
Regression Statistics
Multiple R 0.925611848
R Square 0.856757294
Adjusted R Square 0.856081621
Standard Error 7.851797661
Observations 214
ANOVA
df SS MS F Significance F
Regression 1 78173.46 78173.46 1268.006 2.07E-91
Residual 212 13069.95 61.65073
Total 213 91243.42
CoefficientsStandard Error t Stat P-value Lower 95%Upper 95%Lower 95.0%Upper 95.0%
Intercept 61.39508032 1.789663 34.3054 1.75E-88 57.86727 64.92289 57.86727 64.92289
oil_audollar 0.761654717 0.021389 35.60907 2.07E-91 0.719492 0.803818 0.719492 0.803818
Hence, the regression equation is
Y = 61.395 + 0.761*X
X = crude oil price in AUD
Y = petrol price in AUD
The correlation coefficient between the two variables X and Y are found as 0.9256 and hence
there is strong positive correlation between the crude oil price and the petrol price (Cohen,
West and Aiken 2014). So, the increase in petrol price is mostly influenced by the increase in
crude oil price. Also, the R2 value is 0.8567 or 85.67% of variation in the petrol price is
explained by the variation of crude oil price.
Question 6: change in relationship between crude oil price and petrol price
1 18in years from 200 to 20
The price relationship change of the oil and petrol can be observed by the following scatter
chart.
7
⊘ This is a preview!⊘
Do you want full access?
Subscribe today to unlock all pages.

Trusted by 1+ million students worldwide

2000 2002 2004 2006 2008 2010 2012 2014 2016 2018 2020
0
20
40
60
80
100
120
140
160
180
Oil and petrol price variation by year
oil_audollar petrol_price
Year
AUD
It can be seen that the difference of oil and petrol price is changing differently for different
years. In 2008 the difference is smallest, while in 2016 the difference is largest as the oil
prices are far below than the petrol price in that year.
Discussions and Conclusions
Academic contribution
The analysis performed above is based on the dataset provided by the University. Hence, the
decisions and conclusions drawn above including the prediction model of petrol price is
entirely dependent on the authenticity of data and the probability of correctness is subjected
to method of primary data collection and exactness of the price values.
Practical implications/recommendations
From the above data analysis it is known that the petrol price increment over the years from
2001 to present mostly depends on the price increment of the crude oil price. The random and
8
Paraphrase This Document
Need a fresh take? Get an instant paraphrase of this document with our AI Paraphraser

systematic variation in the regression model of petrol price is small and the model can be
used as prediction model for future petrol price with some assumed or extrapolated crude oil
price.
Limitations and future work
The provided dataset sample size is n= 214, hence the population for which it can produce
significant conclusion is such that n/N >= 0.05 or 5% of population size must be the least
sample size. Hence, the prediction about future price of petrol beyond the specified limit will
not be significant and actual price may fluctuate much. Also, the older price values before
2001 of crude oil and petrol price may change the relationship between the two variables in a
significant way. Hence, for a further accurate model a larger sample may be collected and the
method of collection needs to be suitable for optimum data analysis.
9

References
Cohen, P., West, S.G. and Aiken, L.S., 2014. Applied multiple regression/correlation analysis
for the behavioral sciences. Psychology Press.
Hashimi, H. and Jeffreys, I., 2016. The impact of lengthening petrol price cycles on consumer
purchasing behaviour. Economic Analysis and Policy, 51, pp.130-137.
Wadud, Z., 2015. Imperfect reversibility of air transport demand: Effects of air fare, fuel
prices and price transmission. Transportation Research Part A: Policy and Practice, 72, pp.16-
26.
10
⊘ This is a preview!⊘
Do you want full access?
Subscribe today to unlock all pages.

Trusted by 1+ million students worldwide
1 out of 12
Related Documents
Your All-in-One AI-Powered Toolkit for Academic Success.
 +13062052269
info@desklib.com
Available 24*7 on WhatsApp / Email
Unlock your academic potential
Copyright © 2020–2025 A2Z Services. All Rights Reserved. Developed and managed by ZUCOL.


