BIZ201 - Crystal Hotel: Financial Performance Analysis Case Study
VerifiedAdded on 2023/01/23
|9
|2110
|23
Case Study
AI Summary
This case study solution for BIZ201, "Accounting for Decision Making," analyzes the financial performance of Crystal Hotel Pty Ltd. The analysis includes a comparative review of the income statement, highlighting revenue sources, cost of sales, and personnel costs, and comparing them to industry benchmarks. The report then delves into a comprehensive ratio analysis, covering profitability, efficiency, liquidity, and solvency ratios, to assess the hotel's financial health. The study benchmarks Crystal Hotel's performance against industry averages, offering insights into its strengths and weaknesses, and suggests recommendations to improve the hotel’s financial position. Furthermore, the study discusses additional techniques, such as horizontal analysis, trend analysis, and graphical analysis, for industry performance benchmarking.
Running head: BIZ201 ACCOUNTING FOR DECISION MAKING
BIZ201 Accounting for decision making
Name of the student
Name of the university
Student ID
Author note
BIZ201 Accounting for decision making
Name of the student
Name of the university
Student ID
Author note
Paraphrase This Document
Need a fresh take? Get an instant paraphrase of this document with our AI Paraphraser
1BIZ201 ACCOUNTING FOR DECISION MAKING
Table of Contents
Part 1................................................................................................................................................2
Part 2................................................................................................................................................2
3. Comparative analysis of income statement.............................................................................2
4. Ratio analysis...........................................................................................................................3
5. Additional techniques for industry performance benchmark..................................................6
Reference.........................................................................................................................................7
2BIZ201 ACCOUNTING FOR DECISION MAKING
Part 1
Refer to excel sheet
Part 2
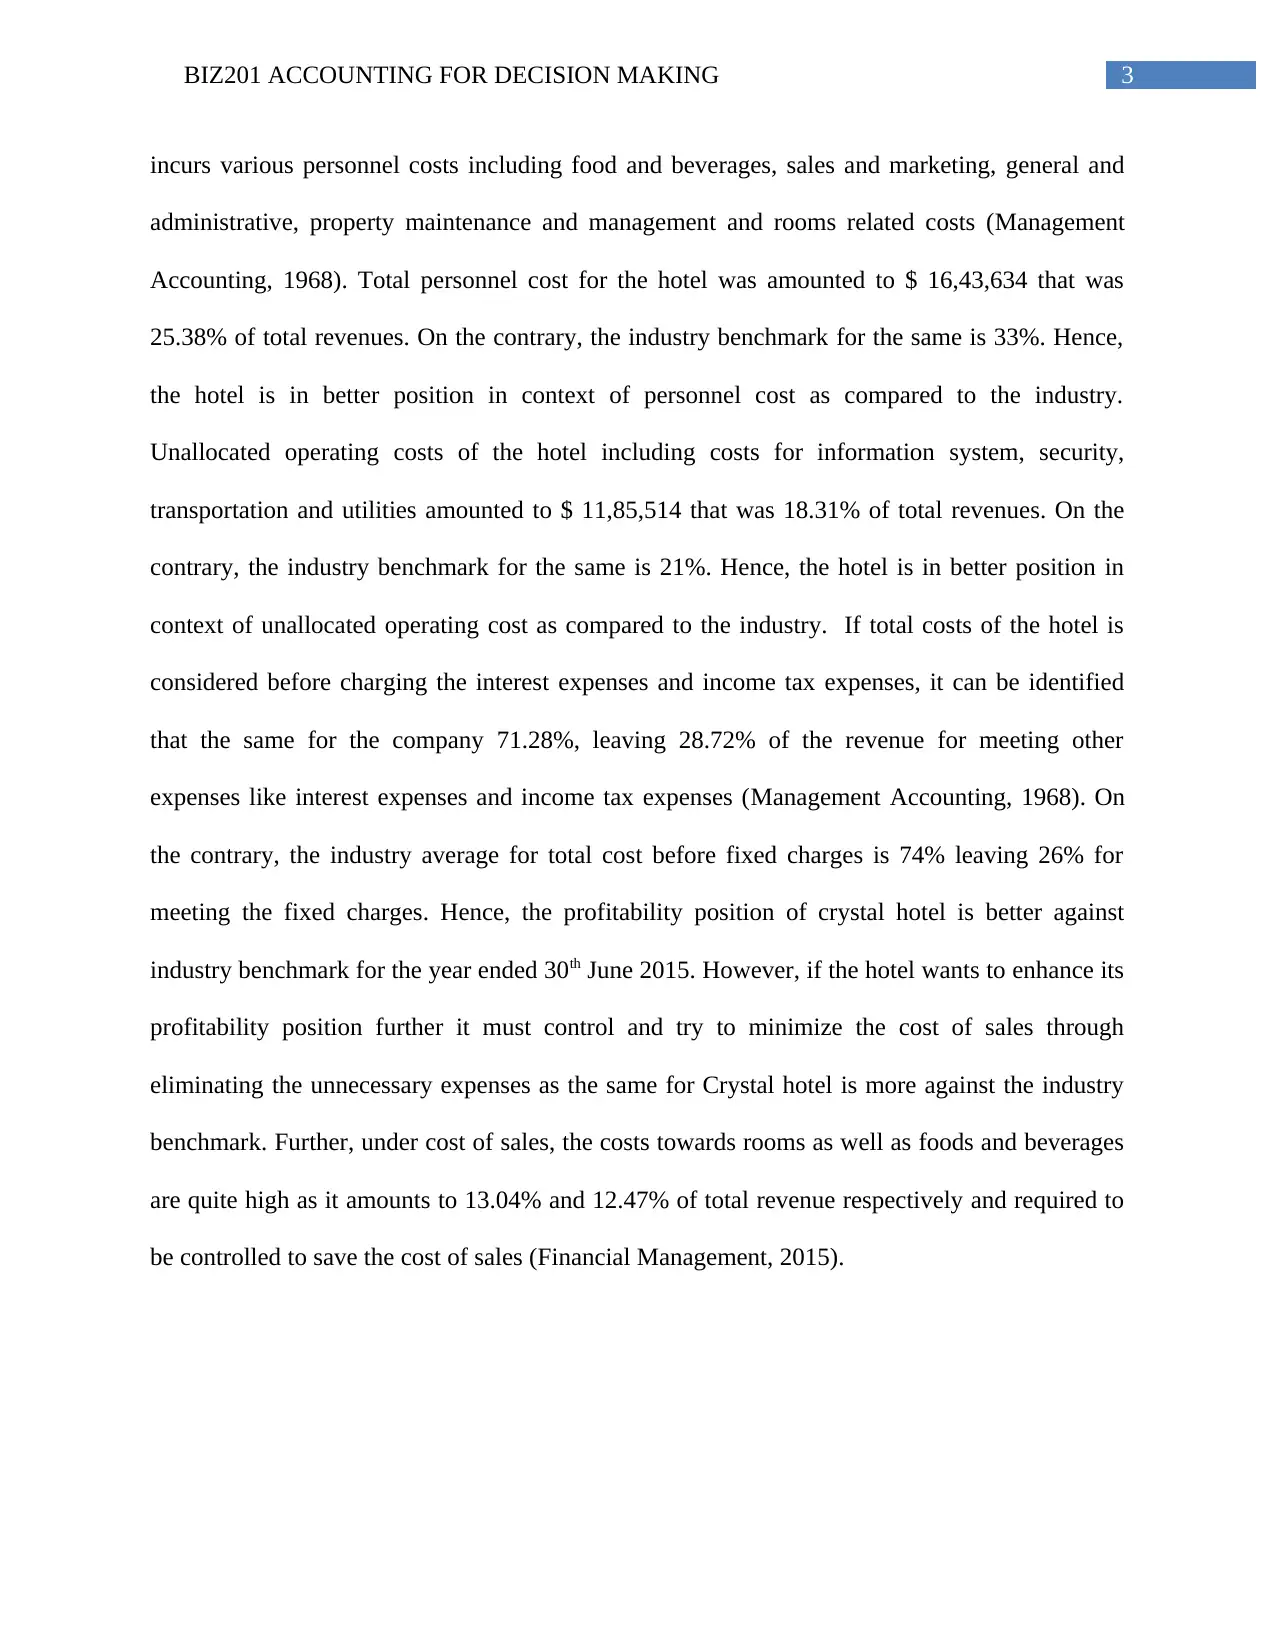
3. Comparative analysis of income statement
Income statement is one of the major financial statements used to report the financial
performance of the entity over the specific period of time. It provides summary of the revenue,
costs and profit or loss generated by the company over the period under concern. Based on the
income statement financial performance of the entity is evaluated taking into consideration the
way through which the revenue is generated by it and the amount it expensed to generate the
income. Analysing the income statement of Crystal Hotel Pty Ltd, it can be identified that the
entity generates major portion of the revenue from room revenue and the percentage of revenue
generated from the room revenue is 61.88 (Journal of Bank Cost & Management Accounting
2004). On the other hand, the industrial average for the same is 51% (Business And Economics--
Accounting; Business And Economics--Banking And Finance, 2011). Hence, it can be stated that
Crystal Hotel is more efficient is generating revenues from room charges as compared to the
industry. If COS of the hotel is considered it can be identified that the same for Crystal Hotel is
27.59% of total revenues that will enable to draw gross margin of 72.41%. However, if the
industry average is considered, the COS is 20% of total revenues that will enable to draw gross
margin of 80%. Hence, even if the hotel is efficient in generating more revenues from room
charges as compared to the industry benchmark it was not able to control the cost as per the
industry benchmark. If the personal costs are considered it can be identified that the company
Part 1
Refer to excel sheet
Part 2
3. Comparative analysis of income statement
Income statement is one of the major financial statements used to report the financial
performance of the entity over the specific period of time. It provides summary of the revenue,
costs and profit or loss generated by the company over the period under concern. Based on the
income statement financial performance of the entity is evaluated taking into consideration the
way through which the revenue is generated by it and the amount it expensed to generate the
income. Analysing the income statement of Crystal Hotel Pty Ltd, it can be identified that the
entity generates major portion of the revenue from room revenue and the percentage of revenue
generated from the room revenue is 61.88 (Journal of Bank Cost & Management Accounting
2004). On the other hand, the industrial average for the same is 51% (Business And Economics--
Accounting; Business And Economics--Banking And Finance, 2011). Hence, it can be stated that
Crystal Hotel is more efficient is generating revenues from room charges as compared to the
industry. If COS of the hotel is considered it can be identified that the same for Crystal Hotel is
27.59% of total revenues that will enable to draw gross margin of 72.41%. However, if the
industry average is considered, the COS is 20% of total revenues that will enable to draw gross
margin of 80%. Hence, even if the hotel is efficient in generating more revenues from room
charges as compared to the industry benchmark it was not able to control the cost as per the
industry benchmark. If the personal costs are considered it can be identified that the company
⊘ This is a preview!⊘
Do you want full access?
Subscribe today to unlock all pages.
Trusted by 1+ million students worldwide
3BIZ201 ACCOUNTING FOR DECISION MAKING
incurs various personnel costs including food and beverages, sales and marketing, general and
administrative, property maintenance and management and rooms related costs (Management
Accounting, 1968). Total personnel cost for the hotel was amounted to $ 16,43,634 that was
25.38% of total revenues. On the contrary, the industry benchmark for the same is 33%. Hence,
the hotel is in better position in context of personnel cost as compared to the industry.
Unallocated operating costs of the hotel including costs for information system, security,
transportation and utilities amounted to $ 11,85,514 that was 18.31% of total revenues. On the
contrary, the industry benchmark for the same is 21%. Hence, the hotel is in better position in
context of unallocated operating cost as compared to the industry. If total costs of the hotel is
considered before charging the interest expenses and income tax expenses, it can be identified
that the same for the company 71.28%, leaving 28.72% of the revenue for meeting other
expenses like interest expenses and income tax expenses (Management Accounting, 1968). On
the contrary, the industry average for total cost before fixed charges is 74% leaving 26% for
meeting the fixed charges. Hence, the profitability position of crystal hotel is better against
industry benchmark for the year ended 30th June 2015. However, if the hotel wants to enhance its
profitability position further it must control and try to minimize the cost of sales through
eliminating the unnecessary expenses as the same for Crystal hotel is more against the industry
benchmark. Further, under cost of sales, the costs towards rooms as well as foods and beverages
are quite high as it amounts to 13.04% and 12.47% of total revenue respectively and required to
be controlled to save the cost of sales (Financial Management, 2015).
Paraphrase This Document
Need a fresh take? Get an instant paraphrase of this document with our AI Paraphraser
4BIZ201 ACCOUNTING FOR DECISION MAKING
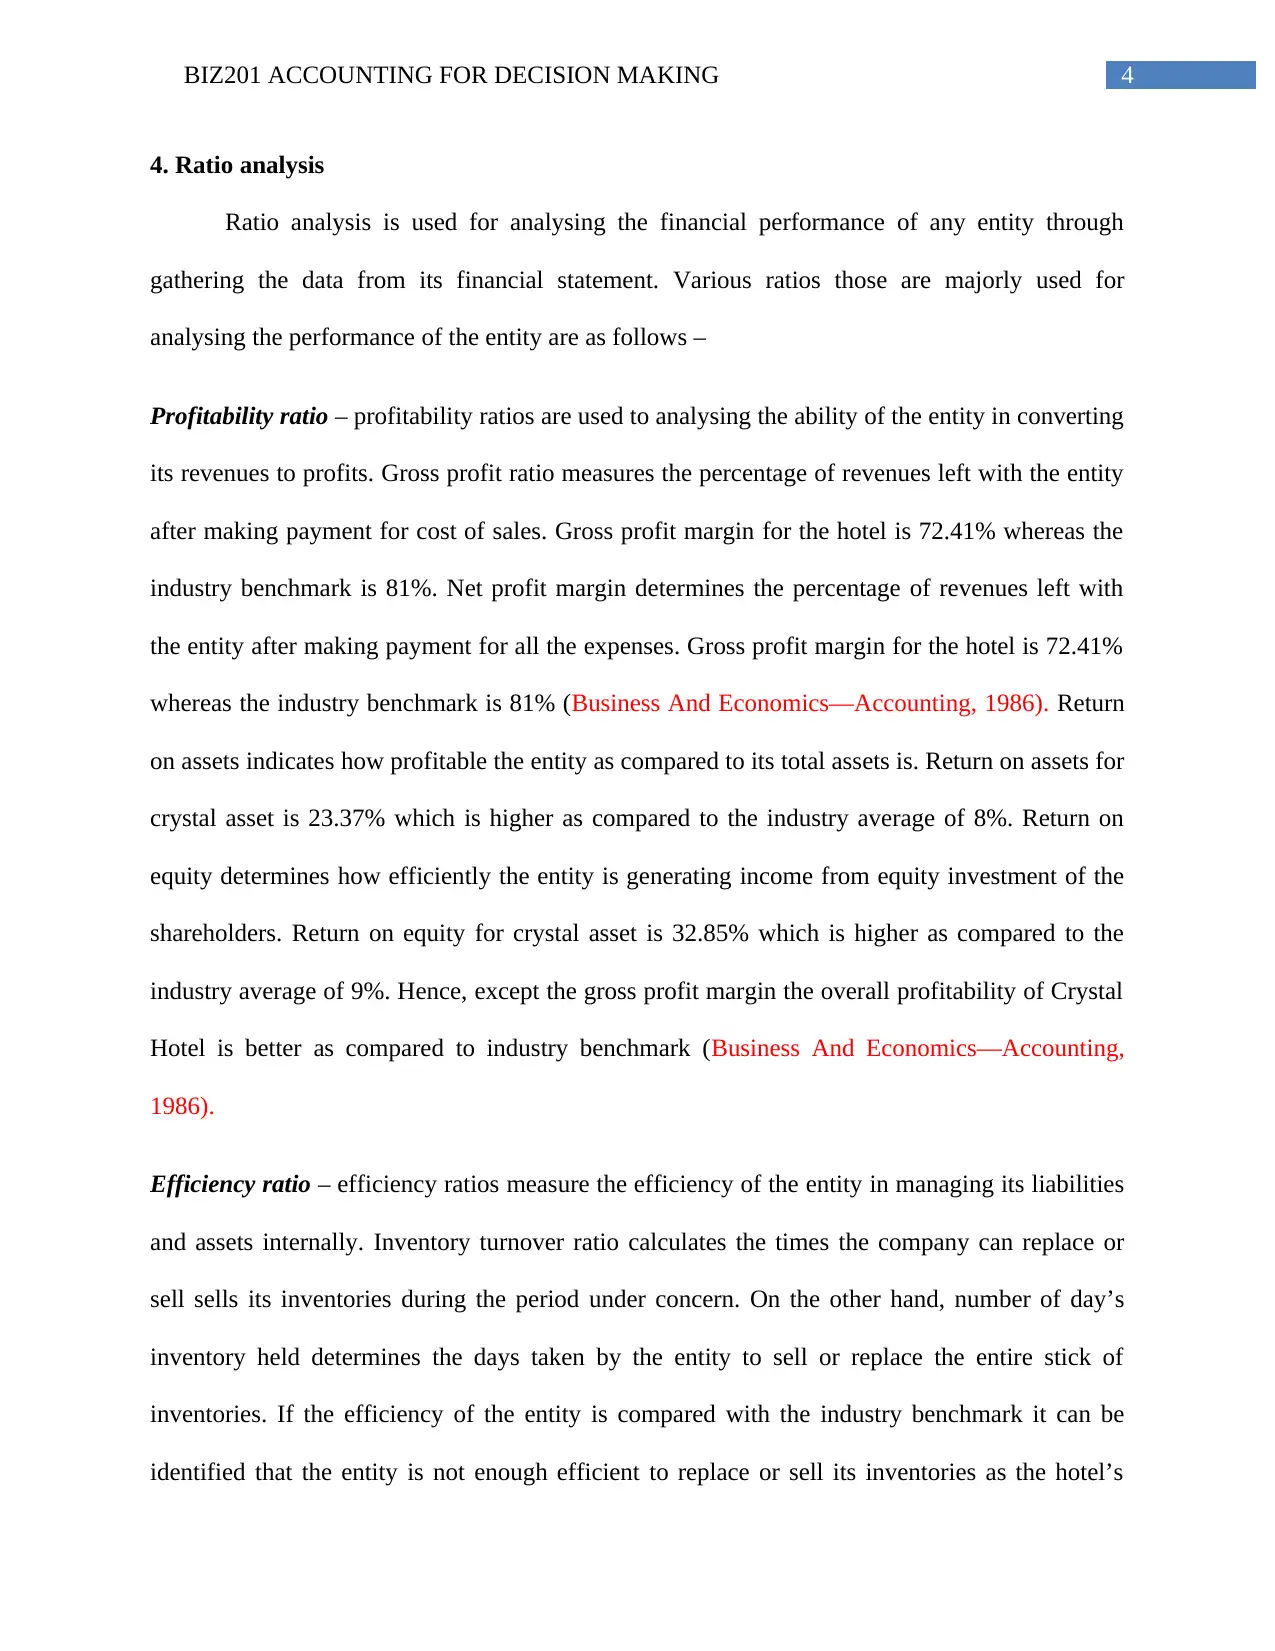
4. Ratio analysis
Ratio analysis is used for analysing the financial performance of any entity through
gathering the data from its financial statement. Various ratios those are majorly used for
analysing the performance of the entity are as follows –
Profitability ratio – profitability ratios are used to analysing the ability of the entity in converting
its revenues to profits. Gross profit ratio measures the percentage of revenues left with the entity
after making payment for cost of sales. Gross profit margin for the hotel is 72.41% whereas the
industry benchmark is 81%. Net profit margin determines the percentage of revenues left with
the entity after making payment for all the expenses. Gross profit margin for the hotel is 72.41%
whereas the industry benchmark is 81% (Business And Economics—Accounting, 1986). Return
on assets indicates how profitable the entity as compared to its total assets is. Return on assets for
crystal asset is 23.37% which is higher as compared to the industry average of 8%. Return on
equity determines how efficiently the entity is generating income from equity investment of the
shareholders. Return on equity for crystal asset is 32.85% which is higher as compared to the
industry average of 9%. Hence, except the gross profit margin the overall profitability of Crystal
Hotel is better as compared to industry benchmark (Business And Economics—Accounting,
1986).
Efficiency ratio – efficiency ratios measure the efficiency of the entity in managing its liabilities
and assets internally. Inventory turnover ratio calculates the times the company can replace or
sell sells its inventories during the period under concern. On the other hand, number of day’s
inventory held determines the days taken by the entity to sell or replace the entire stick of
inventories. If the efficiency of the entity is compared with the industry benchmark it can be
identified that the entity is not enough efficient to replace or sell its inventories as the hotel’s
5BIZ201 ACCOUNTING FOR DECISION MAKING
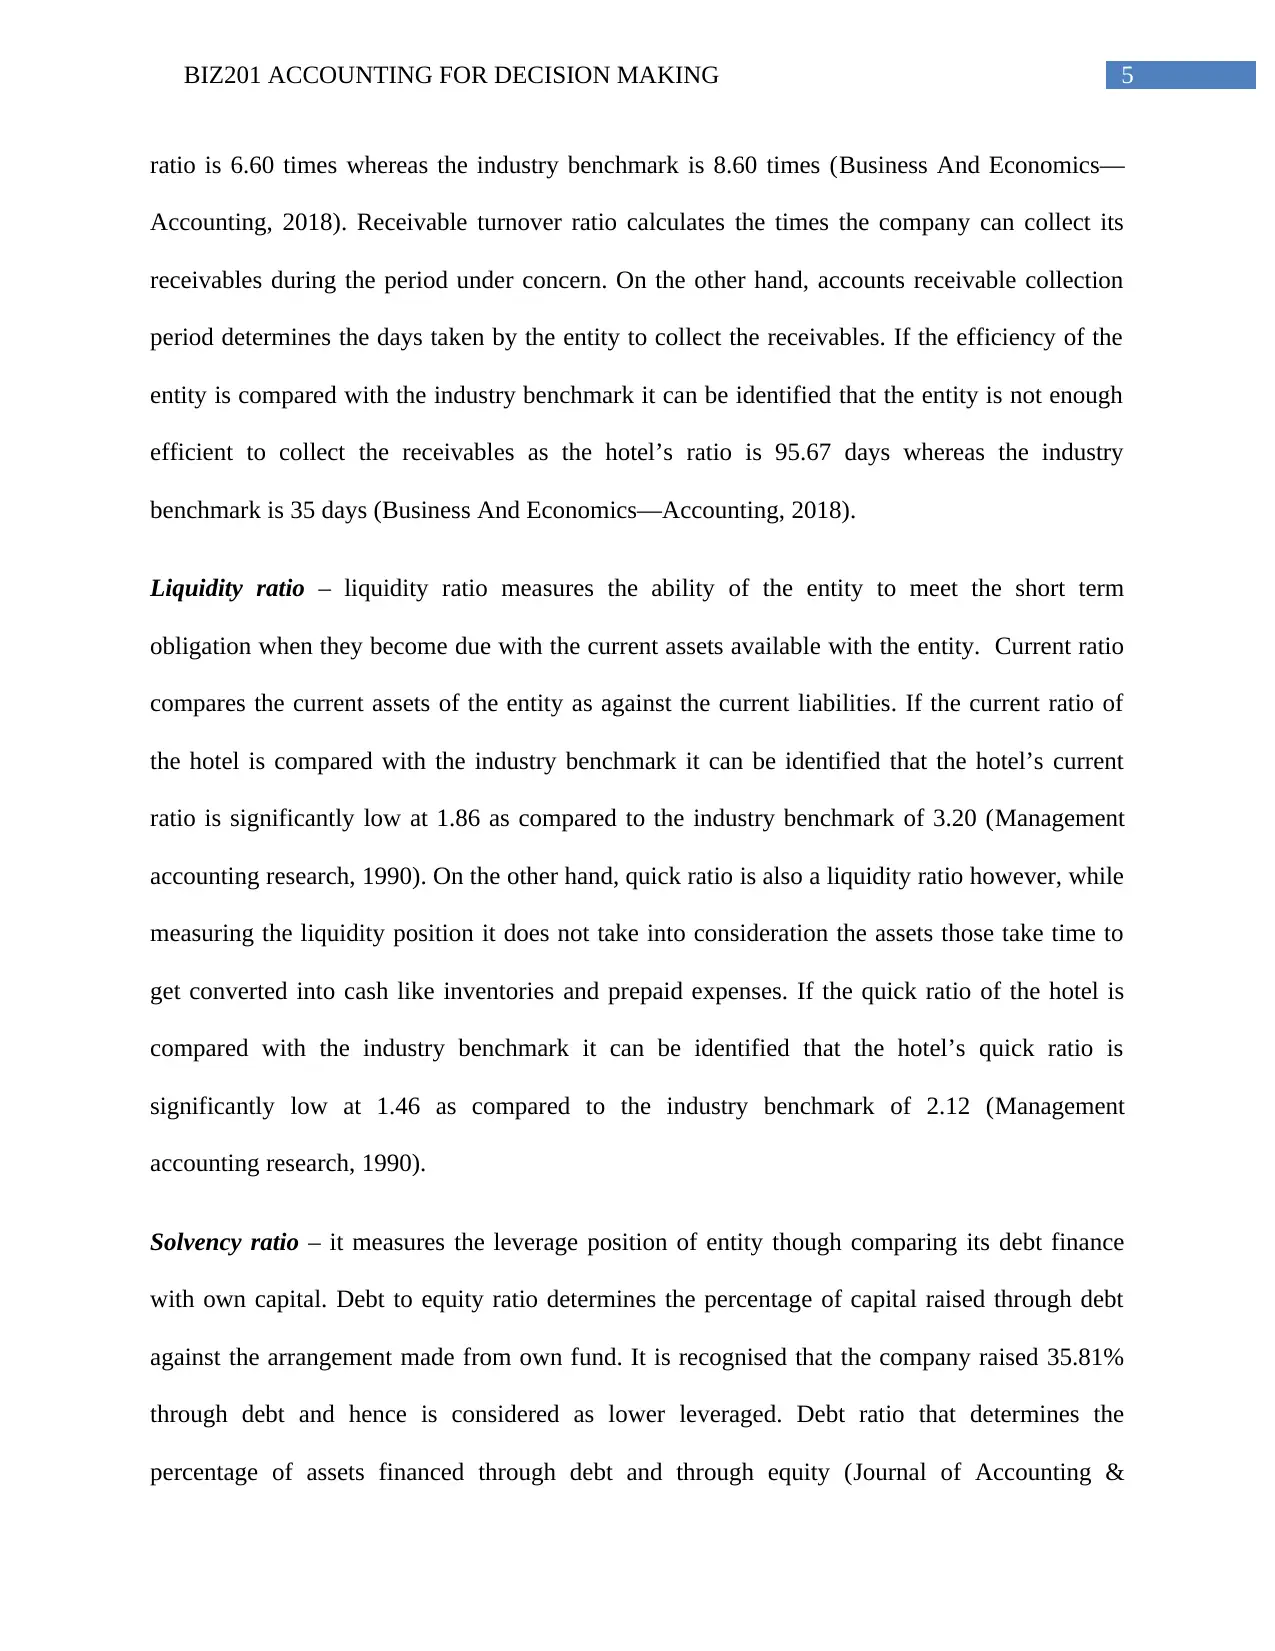
ratio is 6.60 times whereas the industry benchmark is 8.60 times (Business And Economics—
Accounting, 2018). Receivable turnover ratio calculates the times the company can collect its
receivables during the period under concern. On the other hand, accounts receivable collection
period determines the days taken by the entity to collect the receivables. If the efficiency of the
entity is compared with the industry benchmark it can be identified that the entity is not enough
efficient to collect the receivables as the hotel’s ratio is 95.67 days whereas the industry
benchmark is 35 days (Business And Economics—Accounting, 2018).
Liquidity ratio – liquidity ratio measures the ability of the entity to meet the short term
obligation when they become due with the current assets available with the entity. Current ratio
compares the current assets of the entity as against the current liabilities. If the current ratio of
the hotel is compared with the industry benchmark it can be identified that the hotel’s current
ratio is significantly low at 1.86 as compared to the industry benchmark of 3.20 (Management
accounting research, 1990). On the other hand, quick ratio is also a liquidity ratio however, while
measuring the liquidity position it does not take into consideration the assets those take time to
get converted into cash like inventories and prepaid expenses. If the quick ratio of the hotel is
compared with the industry benchmark it can be identified that the hotel’s quick ratio is
significantly low at 1.46 as compared to the industry benchmark of 2.12 (Management
accounting research, 1990).
Solvency ratio – it measures the leverage position of entity though comparing its debt finance
with own capital. Debt to equity ratio determines the percentage of capital raised through debt
against the arrangement made from own fund. It is recognised that the company raised 35.81%
through debt and hence is considered as lower leveraged. Debt ratio that determines the
percentage of assets financed through debt and through equity (Journal of Accounting &
⊘ This is a preview!⊘
Do you want full access?
Subscribe today to unlock all pages.
Trusted by 1+ million students worldwide
6BIZ201 ACCOUNTING FOR DECISION MAKING
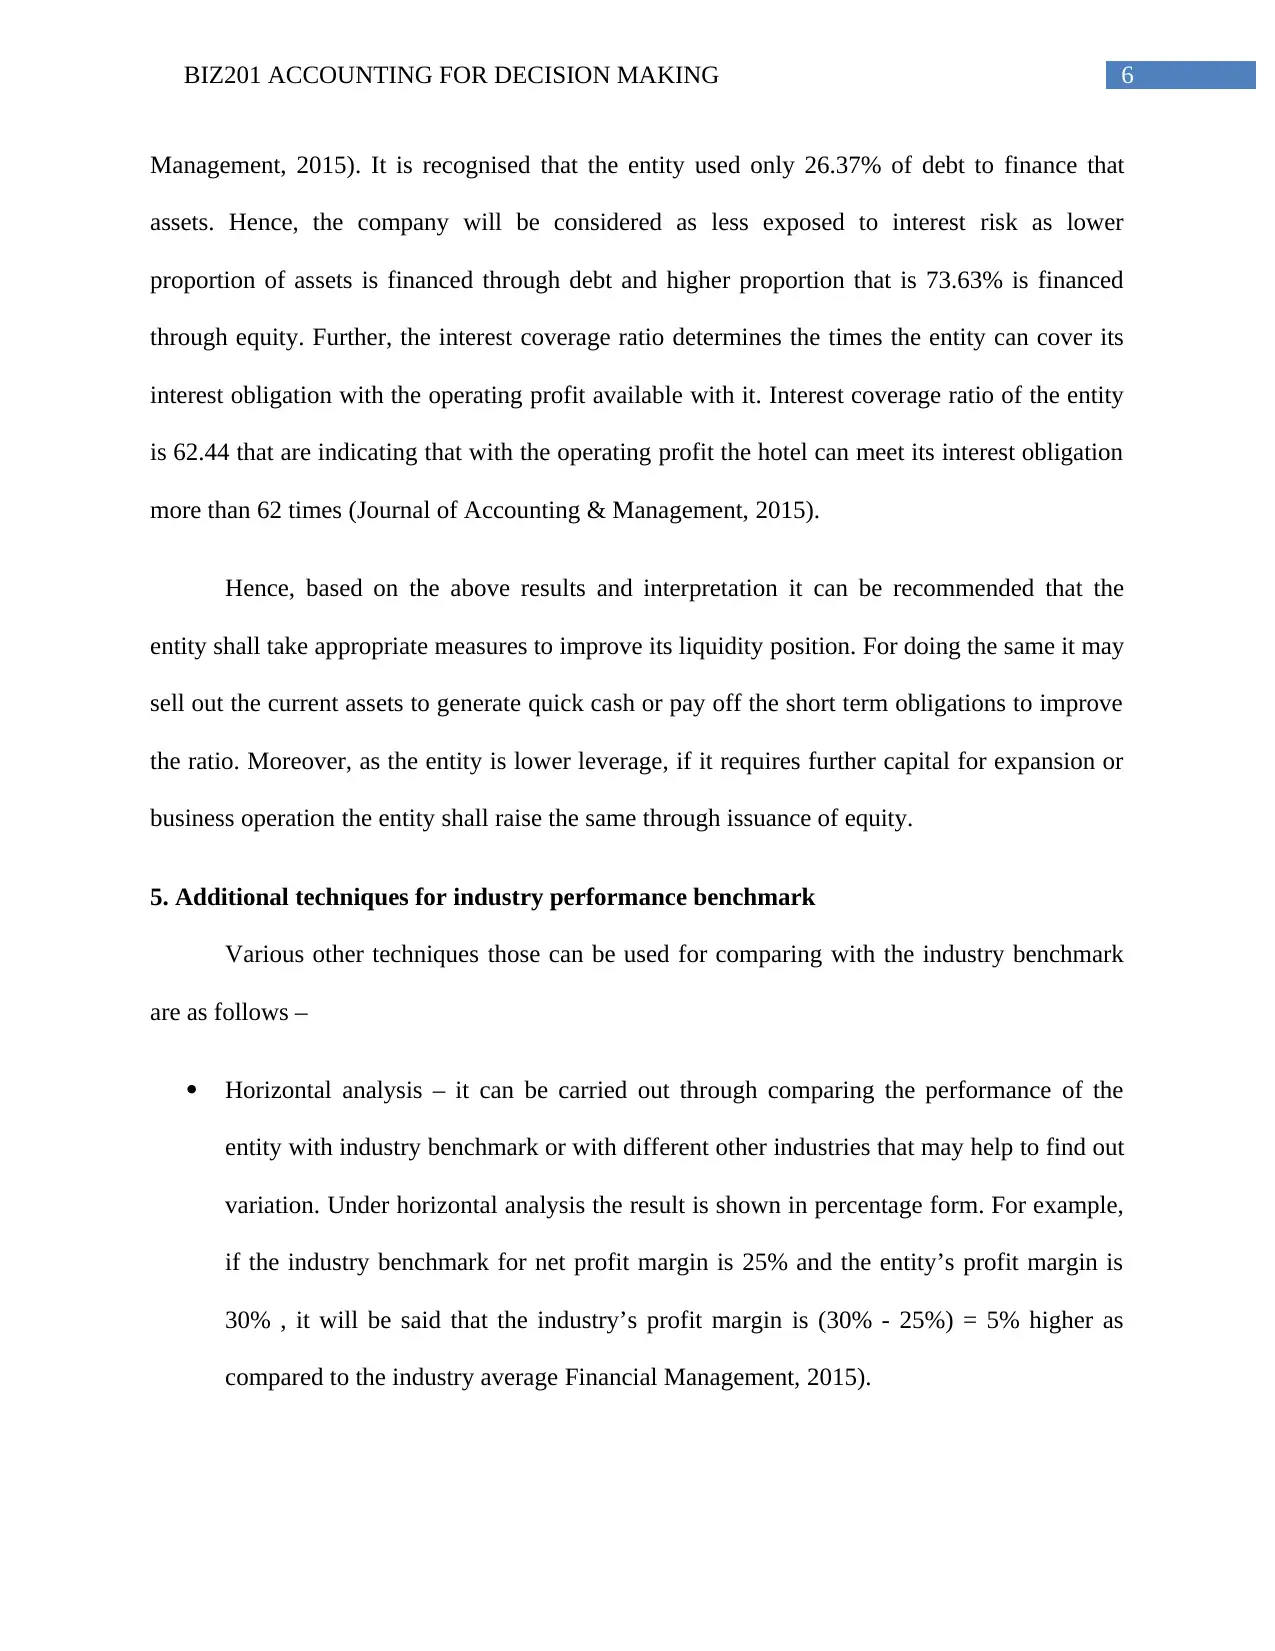
Management, 2015). It is recognised that the entity used only 26.37% of debt to finance that
assets. Hence, the company will be considered as less exposed to interest risk as lower
proportion of assets is financed through debt and higher proportion that is 73.63% is financed
through equity. Further, the interest coverage ratio determines the times the entity can cover its
interest obligation with the operating profit available with it. Interest coverage ratio of the entity
is 62.44 that are indicating that with the operating profit the hotel can meet its interest obligation
more than 62 times (Journal of Accounting & Management, 2015).
Hence, based on the above results and interpretation it can be recommended that the
entity shall take appropriate measures to improve its liquidity position. For doing the same it may
sell out the current assets to generate quick cash or pay off the short term obligations to improve
the ratio. Moreover, as the entity is lower leverage, if it requires further capital for expansion or
business operation the entity shall raise the same through issuance of equity.
5. Additional techniques for industry performance benchmark
Various other techniques those can be used for comparing with the industry benchmark
are as follows –
Horizontal analysis – it can be carried out through comparing the performance of the
entity with industry benchmark or with different other industries that may help to find out
variation. Under horizontal analysis the result is shown in percentage form. For example,
if the industry benchmark for net profit margin is 25% and the entity’s profit margin is
30% , it will be said that the industry’s profit margin is (30% - 25%) = 5% higher as
compared to the industry average Financial Management, 2015).
Paraphrase This Document
Need a fresh take? Get an instant paraphrase of this document with our AI Paraphraser
7BIZ201 ACCOUNTING FOR DECISION MAKING
Trend analysis – generally it is used as a statistical tool and is used to analyse the trend of
performance over the period under concern. It can be used under vertical analysis and
horizontal analysis to identify specific trend and finding out the reason behind such trend.
Graphical analysis – it can be used to provide visual presentation of performance and can
be easily compared over time period. Different types of graphs and chart include line
graph, bar graph and pie chart (Financial Management, 2015).
8BIZ201 ACCOUNTING FOR DECISION MAKING
Reference
Business And Economics--Accounting ; Business And Economics--Banking And Finance.
(2011). Business And Economics--Accounting ; Business And Economics--Banking And
Finance, (Dec 2010/Jan 2011).
Business And Economics--Accounting. (1986). National Association Of Accountants. NAA
Management Accounting. Retrieved from http://www.imanet.org
Business And Economics--Accounting. (2018). Business And Economics--Accounting, (Fall
2018; Vol. 30 (3).
Financial Management. (2015). Management Accounting: Magazine For Chartered Management
Accountants, (0025-1682). Retrieved from http://www.seven.co.uk/
Journal of Accounting & Management. (2015). Journal Of Accounting & Management, (1848-
137X). Retrieved from http://www.hrvatski-racunovodja.hr
Journal of Bank Cost & Management Accounting. (2004). Journal of Performance Management.
[online] Available at: http://www.amifs.org/ [Accessed 18 Apr. 2019].
Management accounting research. (1990). Management Accounting Research. Retrieved from
https://lesa.on.worldcat.org/oclc/19817960
Management Accounting. (1968). Business And Economics--Accounting. Retrieved from
http://www.imanet.org
⊘ This is a preview!⊘
Do you want full access?
Subscribe today to unlock all pages.
Trusted by 1+ million students worldwide
1 out of 9
Related Documents


Your All-in-One AI-Powered Toolkit for Academic Success.
+13062052269
info@desklib.com
Available 24*7 on WhatsApp / Email
![[object Object]](/_next/static/media/star-bottom.7253800d.svg)
Unlock your academic potential
Copyright © 2020–2026 A2Z Services. All Rights Reserved. Developed and managed by ZUCOL.