Comprehensive Equity Analysis Report: CSL Ltd Stock Valuation
VerifiedAdded on 2020/07/22
|21
|4595
|456
Report
AI Summary
This report provides a comprehensive equity analysis of CSL Ltd, a leading biotechnology company. It includes an executive summary, introduction outlining objectives and the rationale for selecting CSL Ltd, and a detailed fundamental analysis covering basic information, operational and competitive status, and a SWOT analysis. The valuation section details the methodology, assumptions, historical data, beta analysis, dividend growth rate estimation, and valuation models, culminating in a final valuation and risk analysis. The report concludes with a recommendation based on the findings, aiming to assist investors and portfolio managers in making informed decisions regarding CSL Ltd's stock. The analysis considers both fundamental and intrinsic value perspectives to assess the stock's potential for middle and long-term investment returns, highlighting key financial ratios, profitability, liquidity, and solvency metrics, as well as an assessment of the company's strengths, weaknesses, opportunities, and threats.
Equity Analysis
Paraphrase This Document
Need a fresh take? Get an instant paraphrase of this document with our AI Paraphraser
TABLE OF CONTENTS
1. Executive Summary.....................................................................................................................1
2. Introduction..................................................................................................................................1
2.1 Objectives of the report.........................................................................................................1
2.2 Reasons for selecting CSL Ltd..............................................................................................1
3.0 Fundamental analysis.................................................................................................................2
3.1 Basic information...................................................................................................................2
3.2 Operation and competitive status analysis.............................................................................2
3.3 SWOT analysis....................................................................................................................10
4 Valuation.....................................................................................................................................11
4.1Analysis methodology..........................................................................................................12
4.2Assumptions.........................................................................................................................12
4.3 Historical data......................................................................................................................12
4.4.1 Beta analysis.....................................................................................................................14
4.3 Dividend growth rate estimation.........................................................................................15
4.4.2 Valuation model...............................................................................................................16
4.4.3 Valuation...........................................................................................................................17
4.4.5 Risk analysis and assumptions..........................................................................................17
5 Recommendation........................................................................................................................17
1. Executive Summary
In the present era, investors prefer to take risk with the motive to generate high returns
from the amount invested. In this regard, equity valuation and beta assessment becomes the
priority which in turn helps in ascertaining the level of investment risk and stock’s volatility. The
main objectives of CBB investment company is to provide investors with higher returns. Hence,
for enhancing the middle and long term investment return equity analysis of CSL Ltd’s stock is
conducted by taking into account the fundamental and intrinsic value perspectives.
For this report, CSL Ltd has been selected which one of the leading biotechnology
company operating at global level. It is involved in the varied activities such as research,
development, manufacturing and marketing of products or services that helps in treating as well
as preventing serious human medical conditions. Products which are offered by CSL Ltd include
blood plasma derivatives, vaccines, research and manufacturing applications etc. It can be
concluded from the evaluation that financial position and performance of CSL is good. However,
it needs to make focus on ideal debt-equity ratio such as .5:1 which in turn helps in creating
optimal structure. Further, it can be summarized from the evaluation that beta of CSL’s stock
is .51 respectively which is not higher as compared to the market trend as whole.
2. Introduction
2.1 Objectives of the report
The main objectives of the present report are to assess intrinsic value of stock, beta and
returns that are associated with the stock of CSL Ltd. Hence, findings of the report will provide
potential investors as well as portfolio manager with the input for decision making. The present
report will provide investment management team with the strategies for effectual portfolio
management.
2.2 Reasons for selecting CSL Ltd
At the time of stock selection, high level of emphasis is placed on middle-long term
investment. In addition to this, aspect of risk minimization has also been considered while
making selection of stock for portfolio. Current portfolio of CBB does not include any
biotechnology company. Along with this, Australian Biotechnology Company has attained
leading position in the world and it is continuously growing. Thus, to strengthen the portfolio
and enhancing the associated returns CSL Ltd has been selected by analyst. Inclusion of such
company in portfolio may result into diversity and minimization of portfolio’s risk.
1 | P a g e
⊘ This is a preview!⊘
Do you want full access?
Subscribe today to unlock all pages.
Trusted by 1+ million students worldwide
3.0 Fundamental analysis
3.1 Basic information
CSL is one of largest company of Australia and is operating in biotherapeutics industry.
Firm is currently operating multiple projects under which it is developing innovative biotherapies
that save life of million of peoople. Firm have manufacturing plant in Australia, USA and some
of European nations (Corporate profile, 2017). Mentioned company is specifically focusing on
R&D so that more therapies can be developed. In current time period firm is leading producer of
plasma protein therapeutics. Firm is consistently expanding its market and have aggreive
investment plans. Thus, there is positive optimism about growth of business firm.
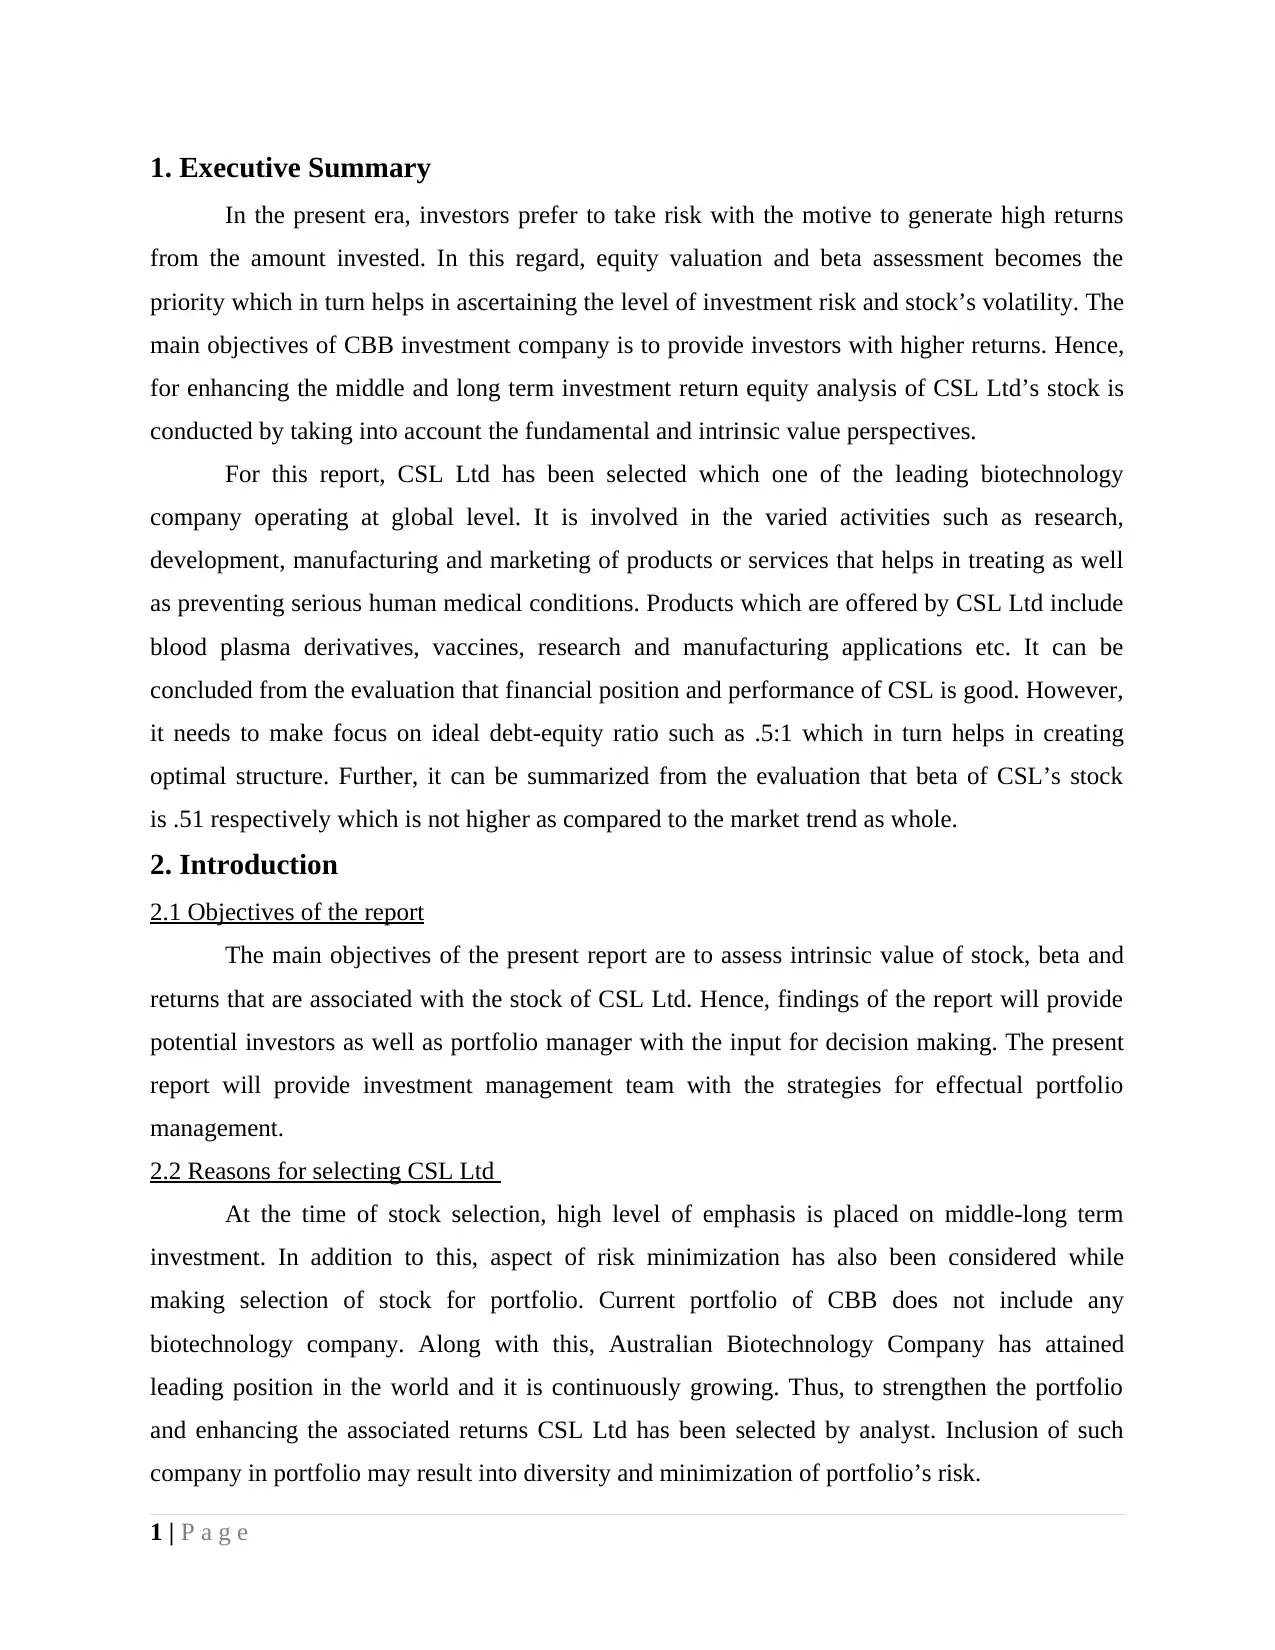
3.2 Operation and competitive status analysis
In order to measure competitiveness of CSL Ltd it can be observed that gross margin of
firm increased in past couple of years at fast rate. In 2008 gross margin percentage was 45.8%
and same increased to 52% in FY 2015. However, same declined to 49%. It can be said that firm
competitiveness declined to some extent but most of times its gross profit growth rate increase.
1 2 3 4 5 6 7 8 9 10
45.8
48.1
51
49.2
48.3
51.7 51.2
52.3
48.6
49.7
Gross profit percentage
Figure 1Gross profit ratio
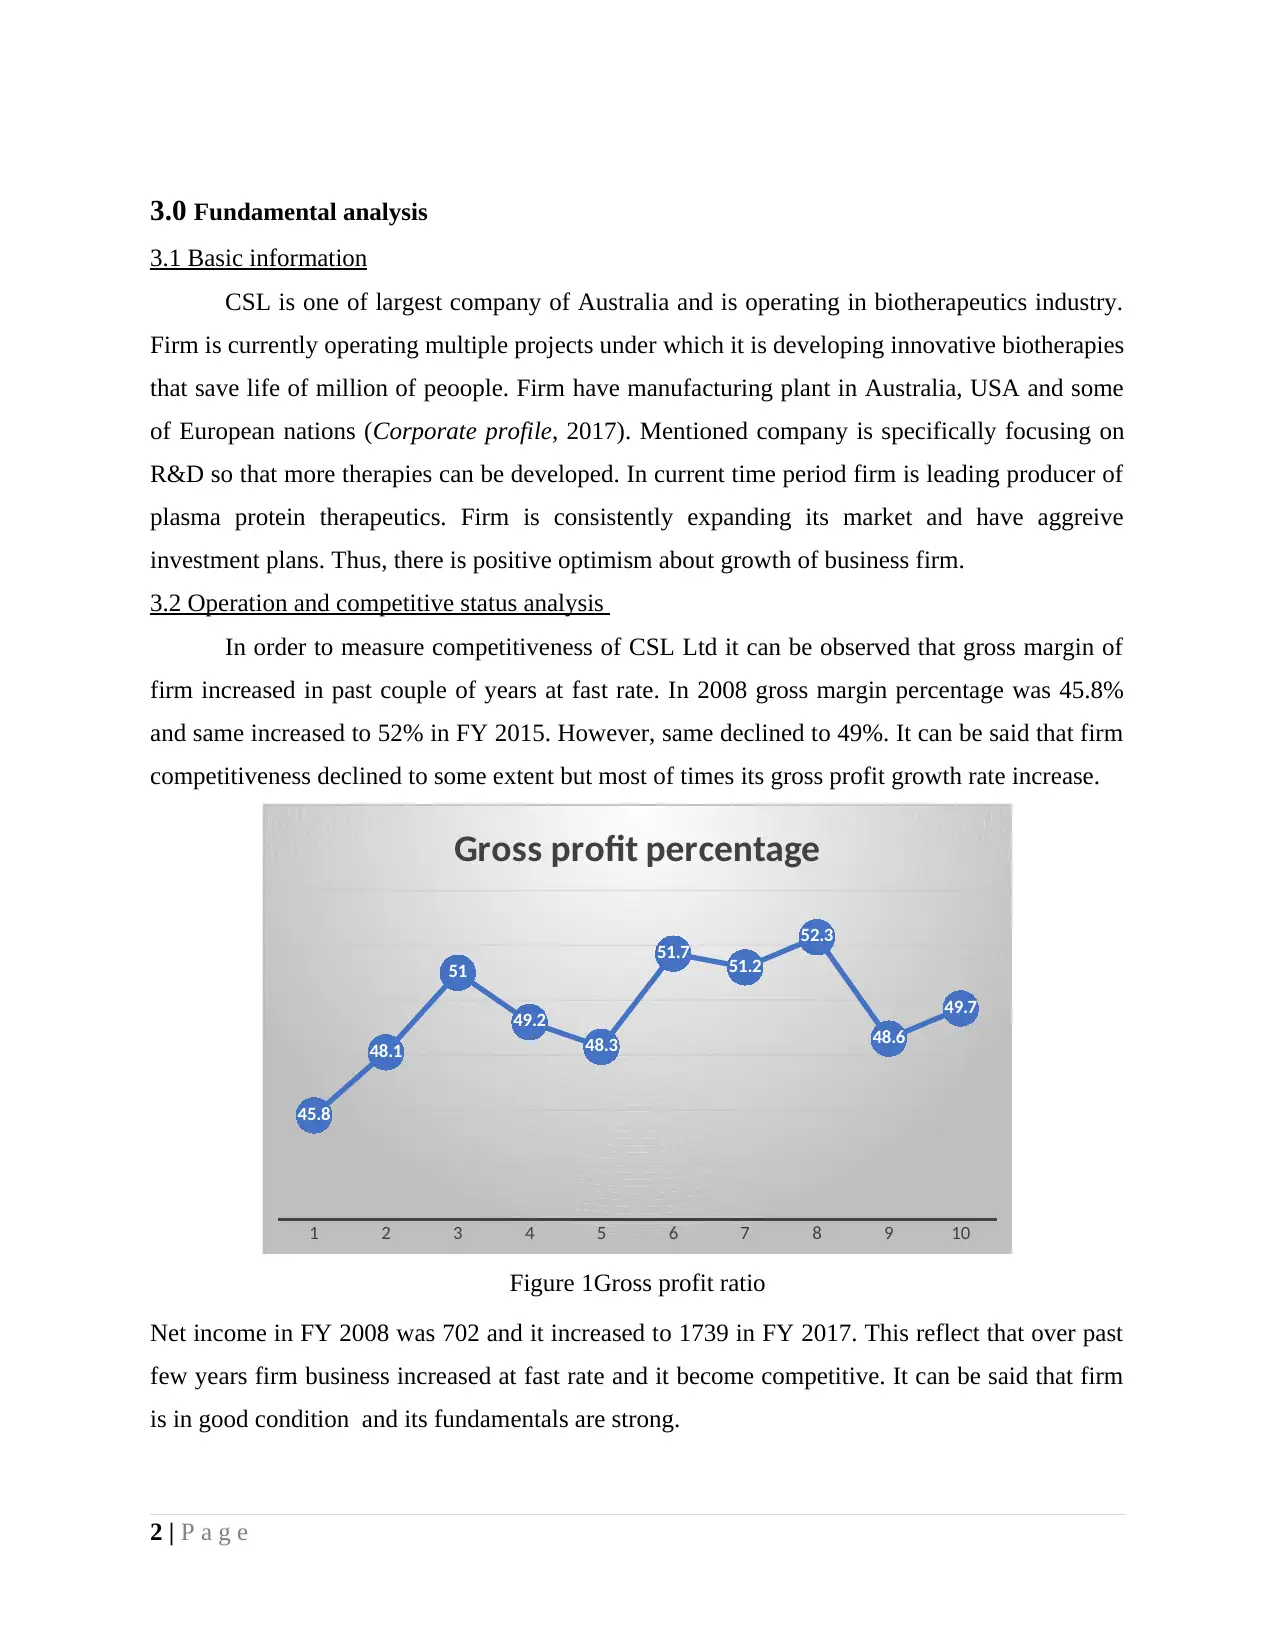
Net income in FY 2008 was 702 and it increased to 1739 in FY 2017. This reflect that over past
few years firm business increased at fast rate and it become competitive. It can be said that firm
is in good condition and its fundamentals are strong.
2 | P a g e
3.1 Basic information
CSL is one of largest company of Australia and is operating in biotherapeutics industry.
Firm is currently operating multiple projects under which it is developing innovative biotherapies
that save life of million of peoople. Firm have manufacturing plant in Australia, USA and some
of European nations (Corporate profile, 2017). Mentioned company is specifically focusing on
R&D so that more therapies can be developed. In current time period firm is leading producer of
plasma protein therapeutics. Firm is consistently expanding its market and have aggreive
investment plans. Thus, there is positive optimism about growth of business firm.
3.2 Operation and competitive status analysis
In order to measure competitiveness of CSL Ltd it can be observed that gross margin of
firm increased in past couple of years at fast rate. In 2008 gross margin percentage was 45.8%
and same increased to 52% in FY 2015. However, same declined to 49%. It can be said that firm
competitiveness declined to some extent but most of times its gross profit growth rate increase.
1 2 3 4 5 6 7 8 9 10
45.8
48.1
51
49.2
48.3
51.7 51.2
52.3
48.6
49.7
Gross profit percentage
Figure 1Gross profit ratio
Net income in FY 2008 was 702 and it increased to 1739 in FY 2017. This reflect that over past
few years firm business increased at fast rate and it become competitive. It can be said that firm
is in good condition and its fundamentals are strong.
2 | P a g e
Paraphrase This Document
Need a fresh take? Get an instant paraphrase of this document with our AI Paraphraser
1 2 3 4 5 6 7 8 9 10
0
200
400
600
800
1000
1200
1400
1600
1800
2000
702
1146 1053 941 983
1311 1387
1796
1673 1739
Net profit
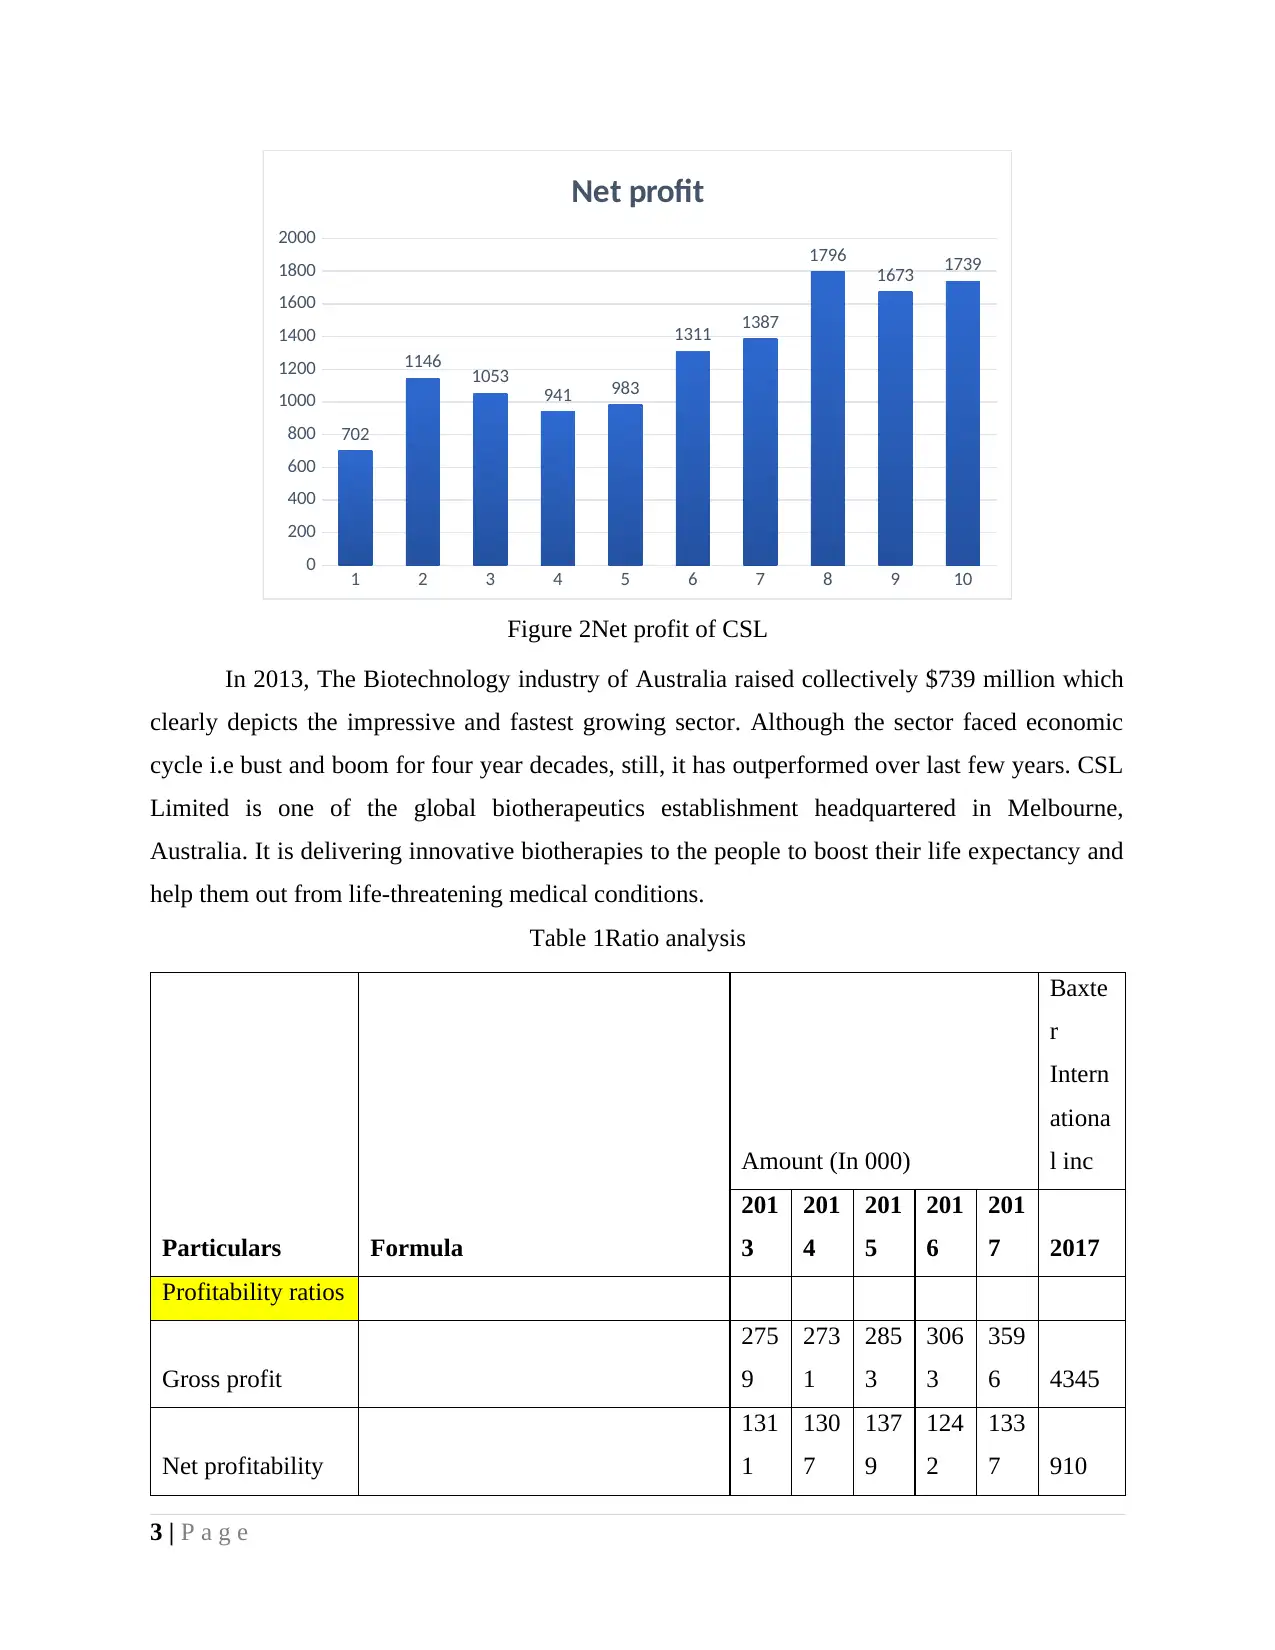
Figure 2Net profit of CSL
In 2013, The Biotechnology industry of Australia raised collectively $739 million which
clearly depicts the impressive and fastest growing sector. Although the sector faced economic
cycle i.e bust and boom for four year decades, still, it has outperformed over last few years. CSL
Limited is one of the global biotherapeutics establishment headquartered in Melbourne,
Australia. It is delivering innovative biotherapies to the people to boost their life expectancy and
help them out from life-threatening medical conditions.
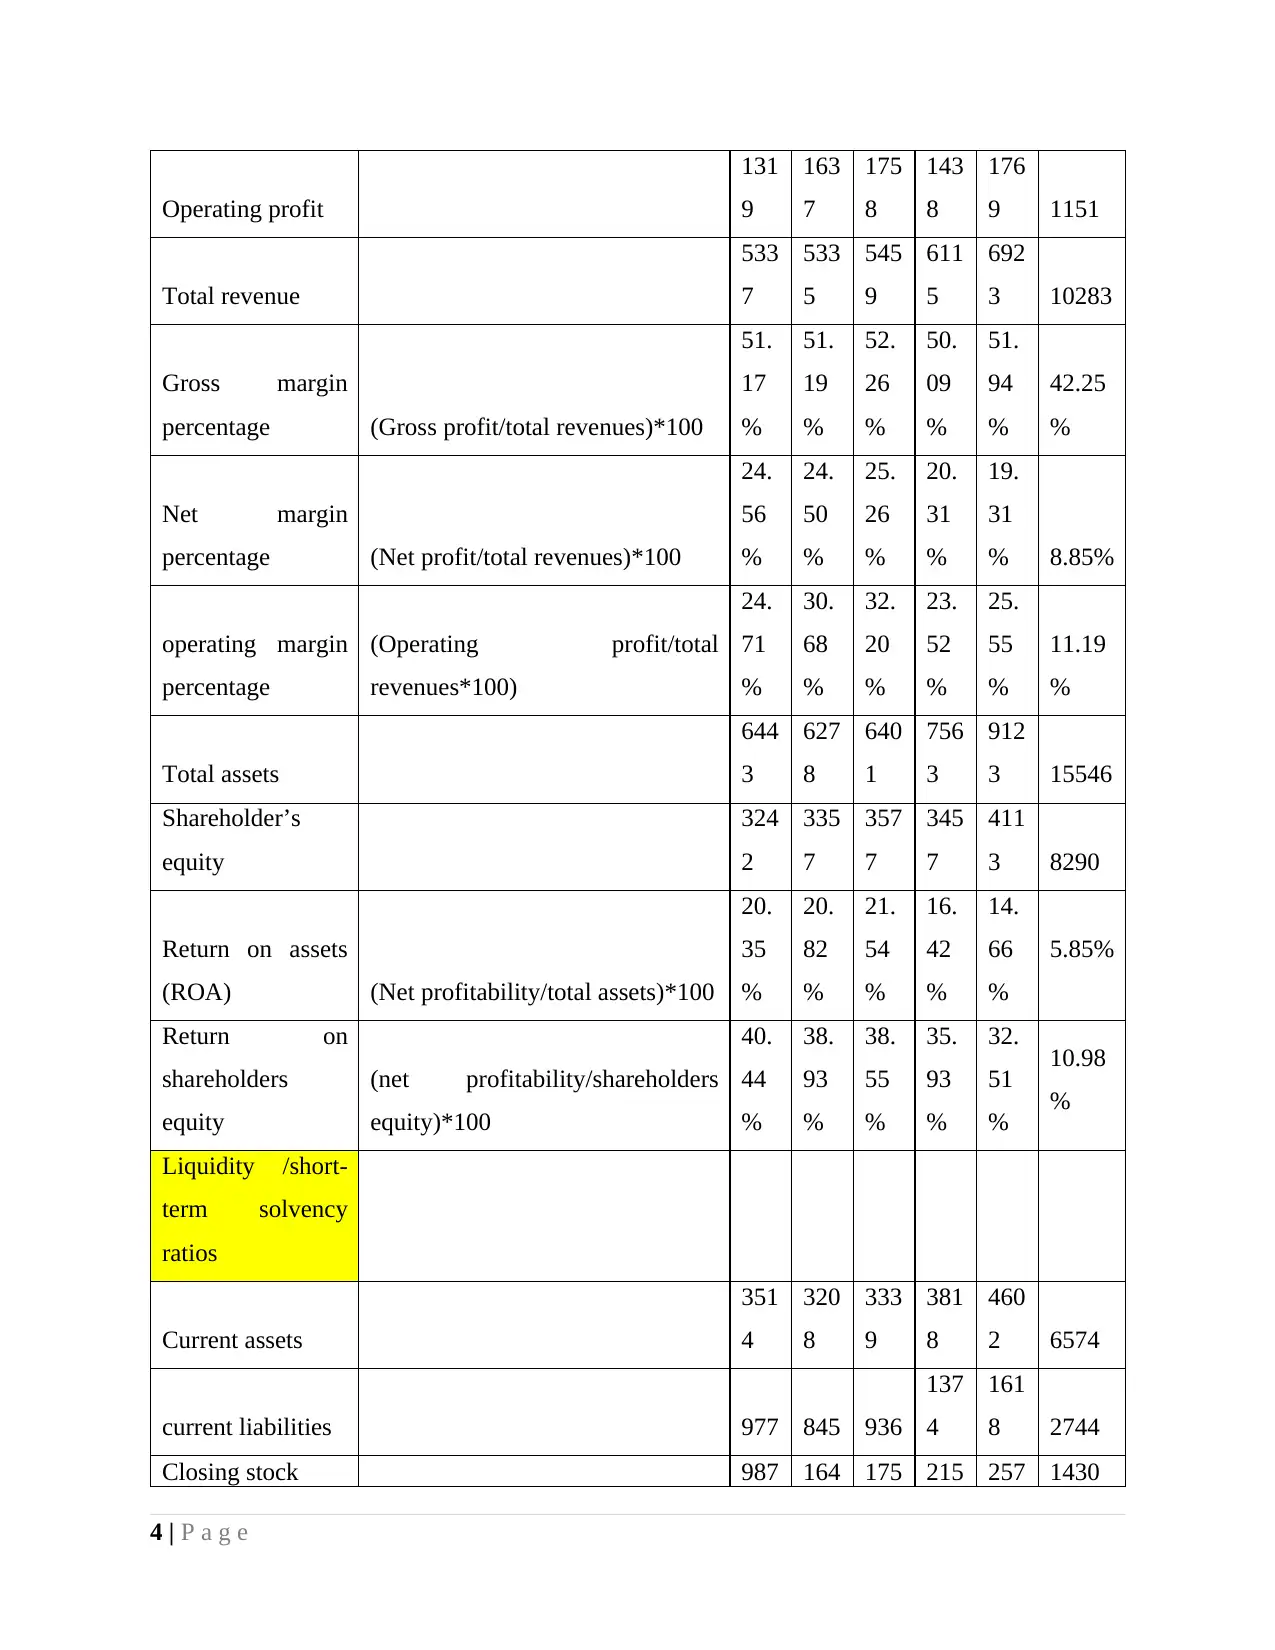
Table 1Ratio analysis
Particulars Formula
Amount (In 000)
Baxte
r
Intern
ationa
l inc
201
3
201
4
201
5
201
6
201
7 2017
Profitability ratios
Gross profit
275
9
273
1
285
3
306
3
359
6 4345
Net profitability
131
1
130
7
137
9
124
2
133
7 910
3 | P a g e
0
200
400
600
800
1000
1200
1400
1600
1800
2000
702
1146 1053 941 983
1311 1387
1796
1673 1739
Net profit
Figure 2Net profit of CSL
In 2013, The Biotechnology industry of Australia raised collectively $739 million which
clearly depicts the impressive and fastest growing sector. Although the sector faced economic
cycle i.e bust and boom for four year decades, still, it has outperformed over last few years. CSL
Limited is one of the global biotherapeutics establishment headquartered in Melbourne,
Australia. It is delivering innovative biotherapies to the people to boost their life expectancy and
help them out from life-threatening medical conditions.
Table 1Ratio analysis
Particulars Formula
Amount (In 000)
Baxte
r
Intern
ationa
l inc
201
3
201
4
201
5
201
6
201
7 2017
Profitability ratios
Gross profit
275
9
273
1
285
3
306
3
359
6 4345
Net profitability
131
1
130
7
137
9
124
2
133
7 910
3 | P a g e
Operating profit
131
9
163
7
175
8
143
8
176
9 1151
Total revenue
533
7
533
5
545
9
611
5
692
3 10283
Gross margin
percentage (Gross profit/total revenues)*100
51.
17
%
51.
19
%
52.
26
%
50.
09
%
51.
94
%
42.25
%
Net margin
percentage (Net profit/total revenues)*100
24.
56
%
24.
50
%
25.
26
%
20.
31
%
19.
31
% 8.85%
operating margin
percentage
(Operating profit/total
revenues*100)
24.
71
%
30.
68
%
32.
20
%
23.
52
%
25.
55
%
11.19
%
Total assets
644
3
627
8
640
1
756
3
912
3 15546
Shareholder’s
equity
324
2
335
7
357
7
345
7
411
3 8290
Return on assets
(ROA) (Net profitability/total assets)*100
20.
35
%
20.
82
%
21.
54
%
16.
42
%
14.
66
%
5.85%
Return on
shareholders
equity
(net profitability/shareholders
equity)*100
40.
44
%
38.
93
%
38.
55
%
35.
93
%
32.
51
%
10.98
%
Liquidity /short-
term solvency
ratios
Current assets
351
4
320
8
333
9
381
8
460
2 6574
current liabilities 977 845 936
137
4
161
8 2744
Closing stock 987 164 175 215 257 1430
4 | P a g e
⊘ This is a preview!⊘
Do you want full access?
Subscribe today to unlock all pages.
Trusted by 1+ million students worldwide
5 6 2 6
Current ratio (Current assets/current liabilities)
3.6
0
3.8
0
3.5
7
2.7
8
2.8
4 2.40
Acid test ratio
(Current assets-closing
stock)/short-term liabilities
2.5
9
1.8
5
1.6
9
1.2
1
1.2
5 1.87
Efficiency ratios
Creditors 282 214 258 304 399 791
Debtors 878 915 979
104
4
111
4 1952
Cost of sales
257
8
260
4
260
6
305
2
332
7 5938
Inventory
176
8
164
5
175
6
215
2
257
6 1430
Total assets
644
3
627
8
640
1
756
3
912
3 15546
Inventory days (Inventory/Cost of sale)*365
250
.32
230
.58
245
.95
257
.37
282
.61 87.90
Payable days
(accounts payables/cost of
sales)*365
39.
93
30.
00
36.
14
36.
36
43.
77 48.62
Receivable days Debtors/Sales*365
60.
05
62.
60
65.
46
62.
32
58.
73 69.29
Cash conversion
cycle (CCC)
270
.44
263
.18
275
.27
283
.32
297
.57
108.5
7
Assets turnover
ratio (/total assets)
0.8
3
0.8
5
0.8
5
0.8
1
0.7
6 0.66
Solvency/leverage
ratios
Long-term debts
177
9
185
9
225
5
305
9
383
0 3030
5 | P a g e
Paraphrase This Document
Need a fresh take? Get an instant paraphrase of this document with our AI Paraphraser
Shareholder’s
equity
324
2
335
7
357
7
345
7
411
3 8290
Debt-equity ratio
(Long-term debt /shareholders
equity)
0.5
5
0.5
5
0.6
3
0.8
8
0.9
3 0.37
Interest 51 53
60.
00
72.
00 90 80
Net profitability
131
1
130
7
137
9
124
2
133
7 910
Time to interest
ratio Net profit/interest
25.
71
24.
66
22.
98
17.
25
14.
86 11.38
Investment ratios
Net profit
131
1
130
7
137
9
124
2
133
7 910
Number of shares 500 486 472 463 456 552
EPS
(Total net profit available to
shareholders/number of equity
shares)
2.6
2
2.6
9
2.9
2
2.6
8
2.9
3 1.65
Dividend
distribution 480 564 656 792 784 304
DPS
(Total dividend distributed to
shareholders)/Number of equity
shares
0.9
6
1.1
6
1.3
9
1.7
1
1.7
2
0.55
6 | P a g e
2013 2014 2015 2016 2017
0.00%
10.00%
20.00%
30.00%
40.00%
50.00%
60.00%
CSL's Profitability performance
Ratio (IN percentgae)
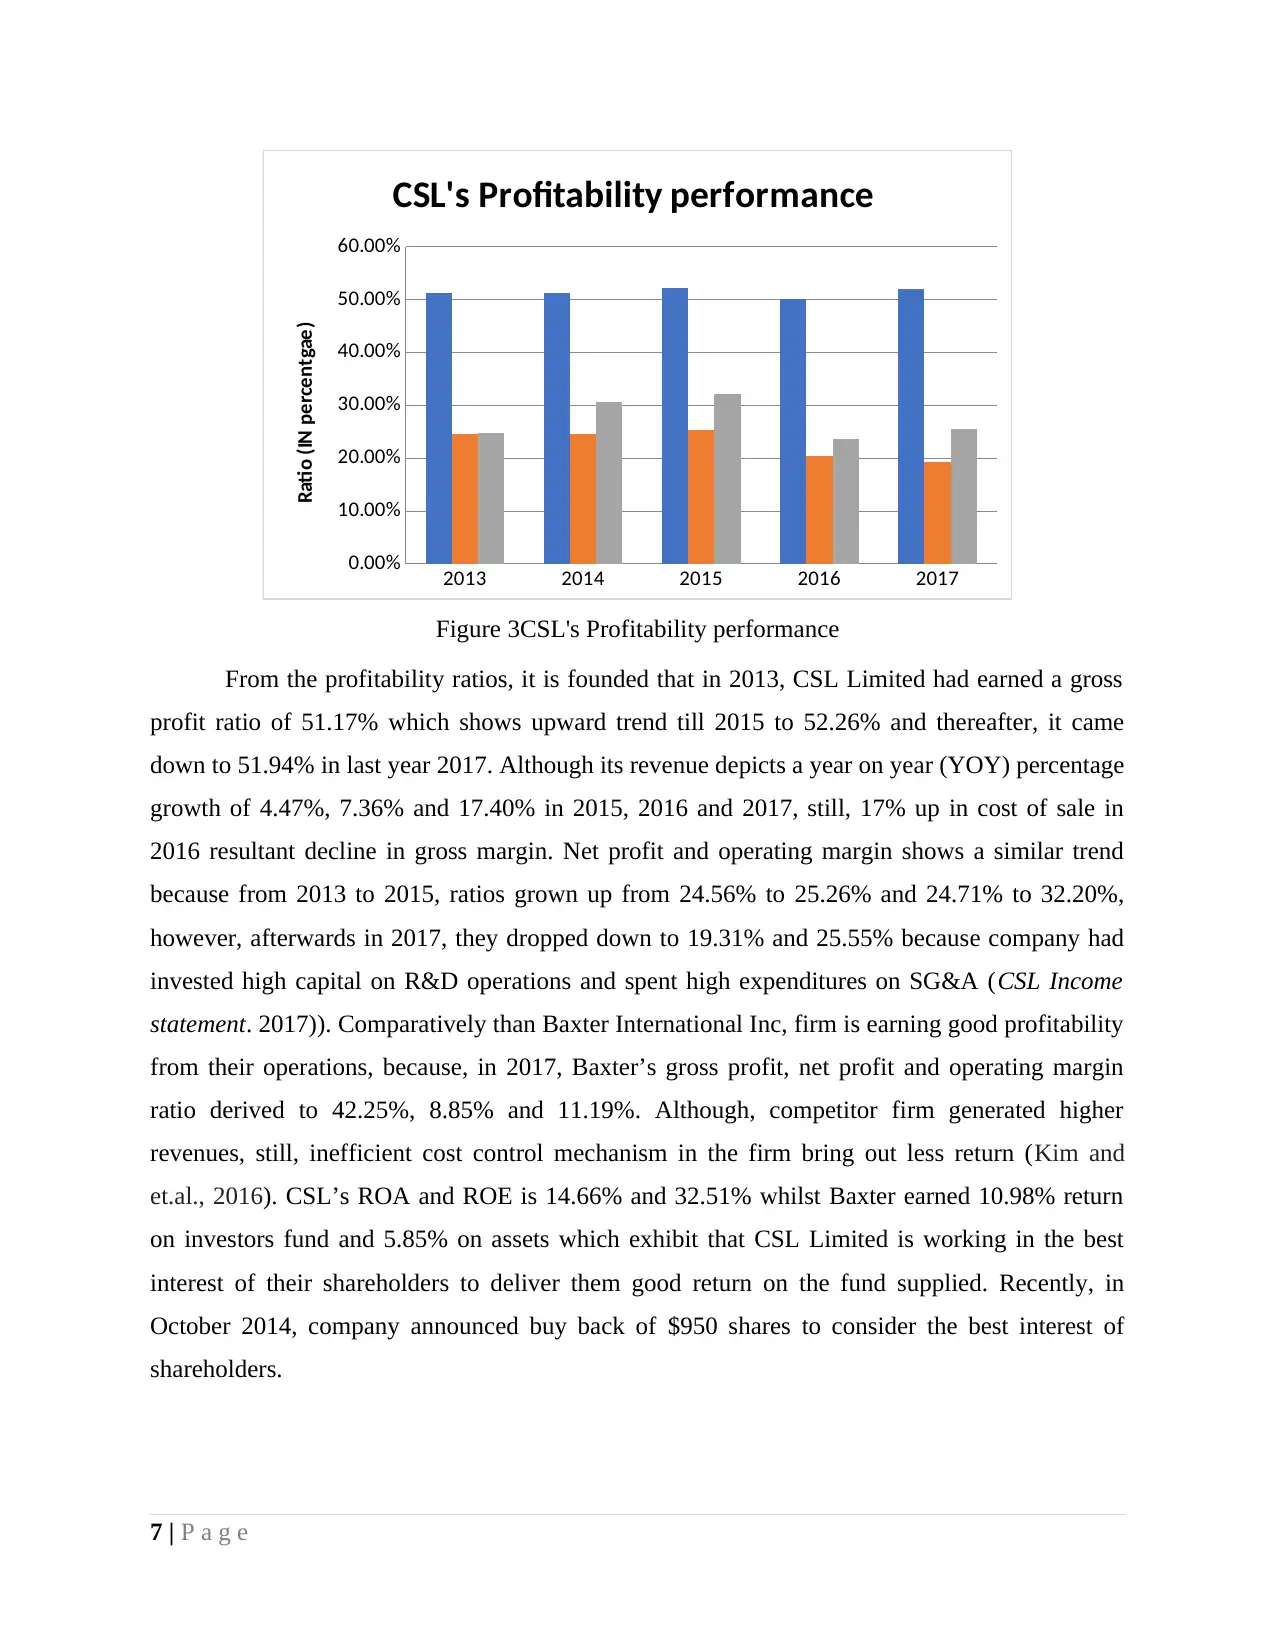
Figure 3CSL's Profitability performance
From the profitability ratios, it is founded that in 2013, CSL Limited had earned a gross
profit ratio of 51.17% which shows upward trend till 2015 to 52.26% and thereafter, it came
down to 51.94% in last year 2017. Although its revenue depicts a year on year (YOY) percentage
growth of 4.47%, 7.36% and 17.40% in 2015, 2016 and 2017, still, 17% up in cost of sale in
2016 resultant decline in gross margin. Net profit and operating margin shows a similar trend
because from 2013 to 2015, ratios grown up from 24.56% to 25.26% and 24.71% to 32.20%,
however, afterwards in 2017, they dropped down to 19.31% and 25.55% because company had
invested high capital on R&D operations and spent high expenditures on SG&A (CSL Income
statement. 2017)). Comparatively than Baxter International Inc, firm is earning good profitability
from their operations, because, in 2017, Baxter’s gross profit, net profit and operating margin
ratio derived to 42.25%, 8.85% and 11.19%. Although, competitor firm generated higher
revenues, still, inefficient cost control mechanism in the firm bring out less return (Kim and
et.al., 2016). CSL’s ROA and ROE is 14.66% and 32.51% whilst Baxter earned 10.98% return
on investors fund and 5.85% on assets which exhibit that CSL Limited is working in the best
interest of their shareholders to deliver them good return on the fund supplied. Recently, in
October 2014, company announced buy back of $950 shares to consider the best interest of
shareholders.
7 | P a g e
0.00%
10.00%
20.00%
30.00%
40.00%
50.00%
60.00%
CSL's Profitability performance
Ratio (IN percentgae)
Figure 3CSL's Profitability performance
From the profitability ratios, it is founded that in 2013, CSL Limited had earned a gross
profit ratio of 51.17% which shows upward trend till 2015 to 52.26% and thereafter, it came
down to 51.94% in last year 2017. Although its revenue depicts a year on year (YOY) percentage
growth of 4.47%, 7.36% and 17.40% in 2015, 2016 and 2017, still, 17% up in cost of sale in
2016 resultant decline in gross margin. Net profit and operating margin shows a similar trend
because from 2013 to 2015, ratios grown up from 24.56% to 25.26% and 24.71% to 32.20%,
however, afterwards in 2017, they dropped down to 19.31% and 25.55% because company had
invested high capital on R&D operations and spent high expenditures on SG&A (CSL Income
statement. 2017)). Comparatively than Baxter International Inc, firm is earning good profitability
from their operations, because, in 2017, Baxter’s gross profit, net profit and operating margin
ratio derived to 42.25%, 8.85% and 11.19%. Although, competitor firm generated higher
revenues, still, inefficient cost control mechanism in the firm bring out less return (Kim and
et.al., 2016). CSL’s ROA and ROE is 14.66% and 32.51% whilst Baxter earned 10.98% return
on investors fund and 5.85% on assets which exhibit that CSL Limited is working in the best
interest of their shareholders to deliver them good return on the fund supplied. Recently, in
October 2014, company announced buy back of $950 shares to consider the best interest of
shareholders.
7 | P a g e
⊘ This is a preview!⊘
Do you want full access?
Subscribe today to unlock all pages.
Trusted by 1+ million students worldwide
2013 2014 2015 2016 2017
0.00
0.50
1.00
1.50
2.00
2.50
3.00
3.50
4.00
Liquidity ratio
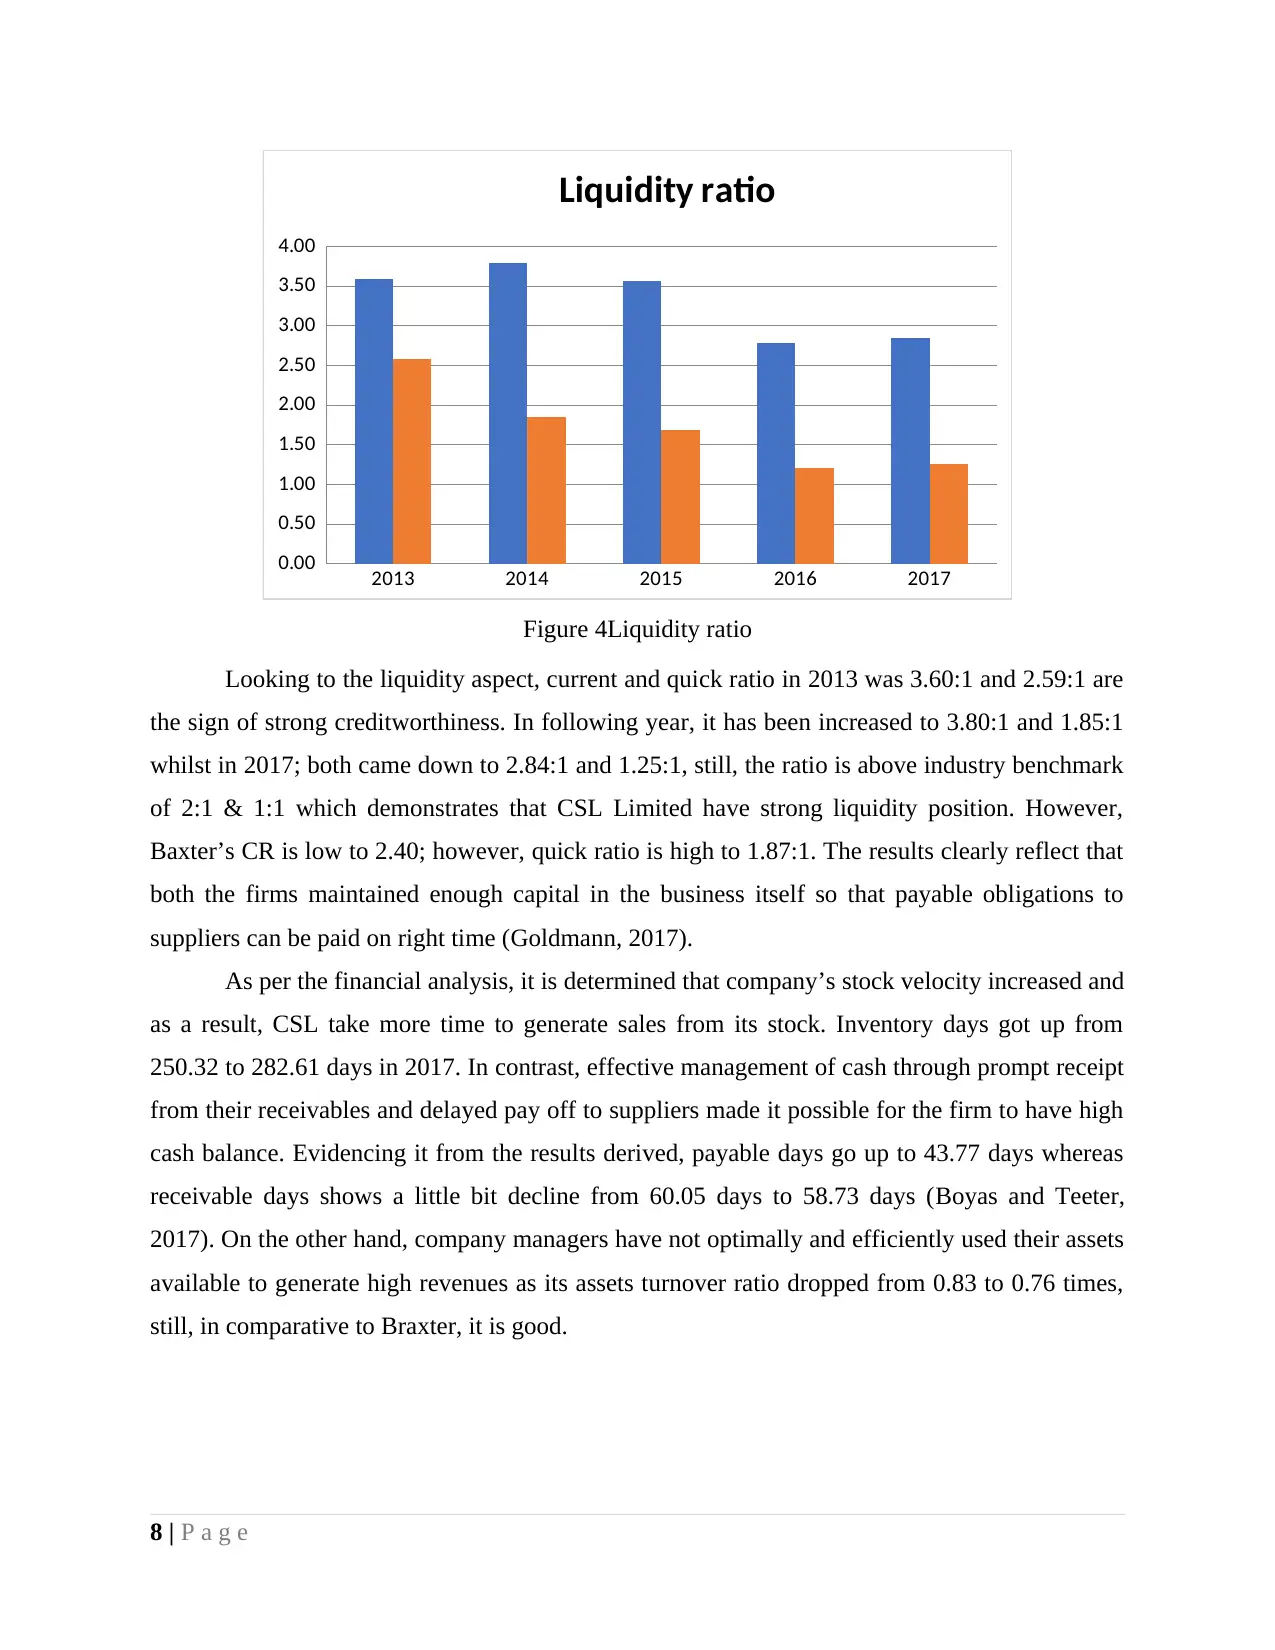
Figure 4Liquidity ratio
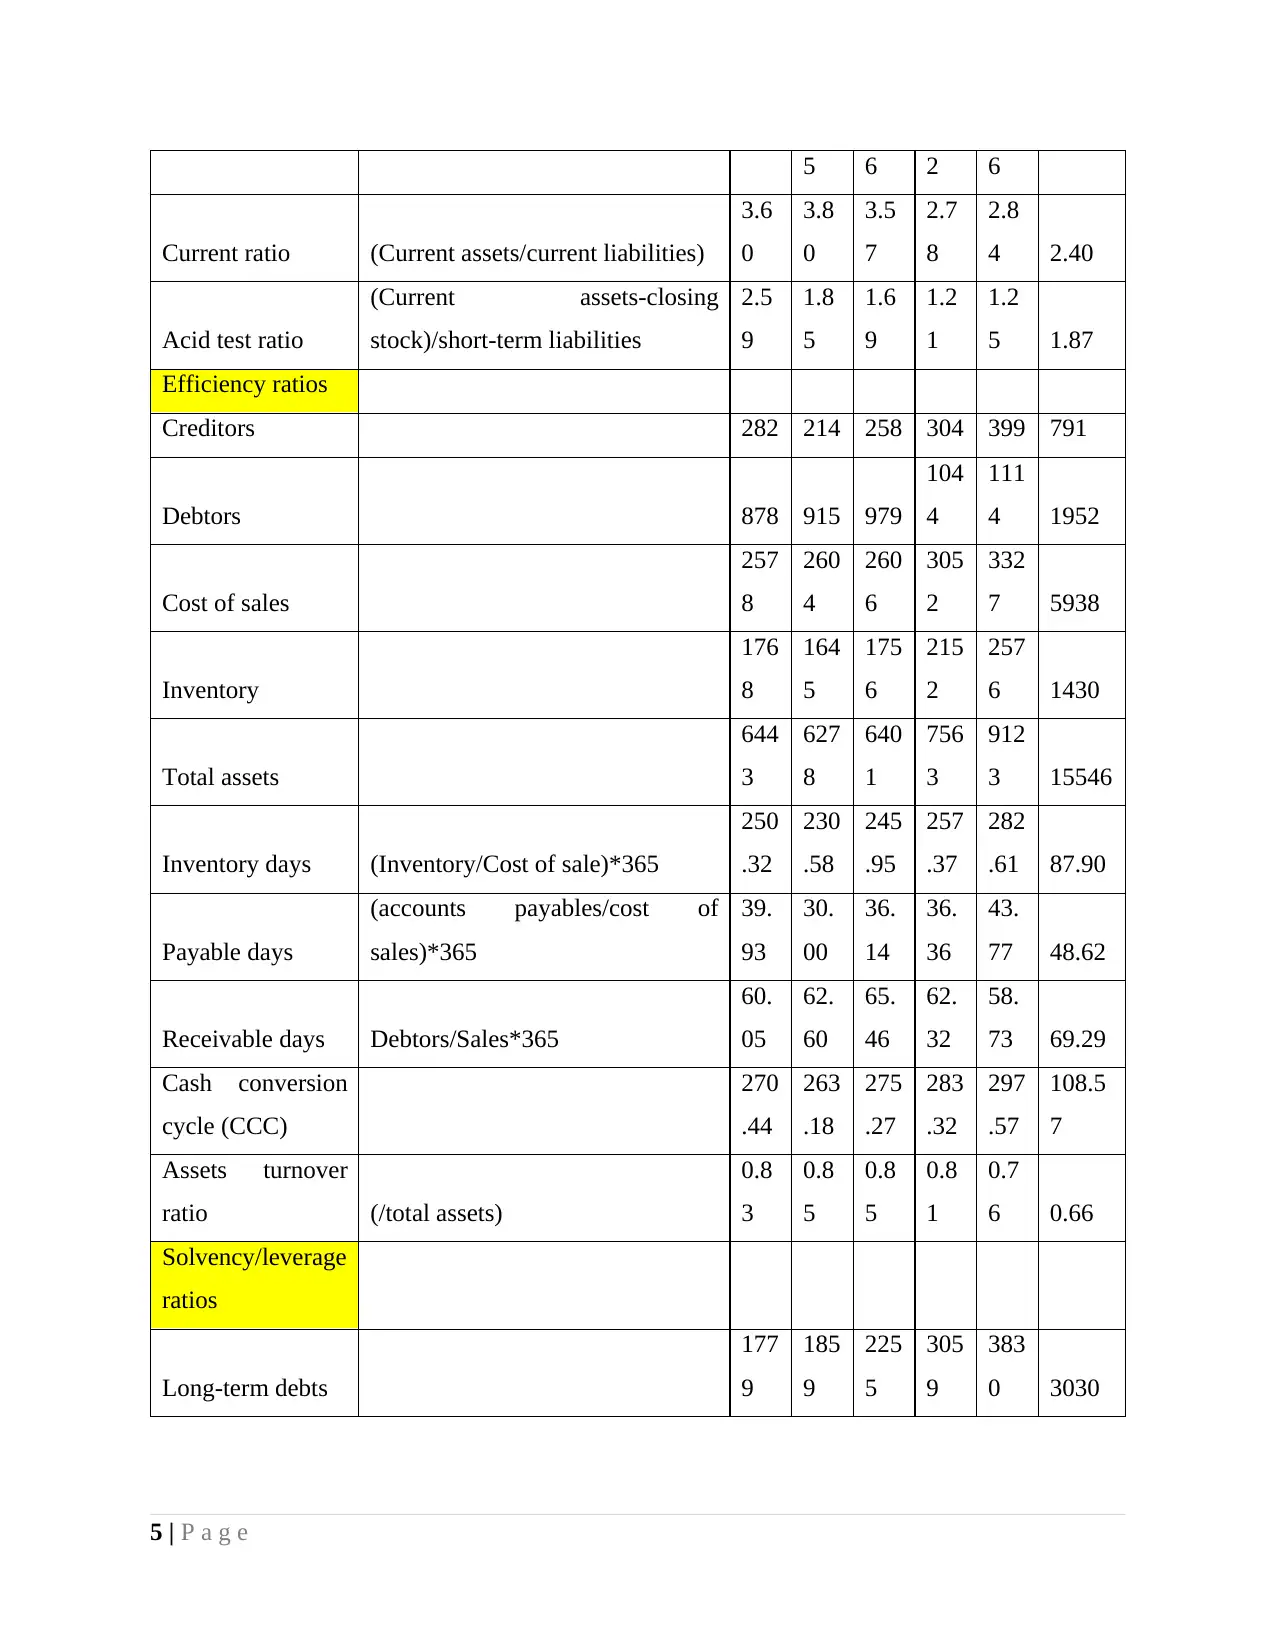
Looking to the liquidity aspect, current and quick ratio in 2013 was 3.60:1 and 2.59:1 are
the sign of strong creditworthiness. In following year, it has been increased to 3.80:1 and 1.85:1
whilst in 2017; both came down to 2.84:1 and 1.25:1, still, the ratio is above industry benchmark
of 2:1 & 1:1 which demonstrates that CSL Limited have strong liquidity position. However,
Baxter’s CR is low to 2.40; however, quick ratio is high to 1.87:1. The results clearly reflect that
both the firms maintained enough capital in the business itself so that payable obligations to
suppliers can be paid on right time (Goldmann, 2017).
As per the financial analysis, it is determined that company’s stock velocity increased and
as a result, CSL take more time to generate sales from its stock. Inventory days got up from
250.32 to 282.61 days in 2017. In contrast, effective management of cash through prompt receipt
from their receivables and delayed pay off to suppliers made it possible for the firm to have high
cash balance. Evidencing it from the results derived, payable days go up to 43.77 days whereas
receivable days shows a little bit decline from 60.05 days to 58.73 days (Boyas and Teeter,
2017). On the other hand, company managers have not optimally and efficiently used their assets
available to generate high revenues as its assets turnover ratio dropped from 0.83 to 0.76 times,
still, in comparative to Braxter, it is good.
8 | P a g e
0.00
0.50
1.00
1.50
2.00
2.50
3.00
3.50
4.00
Liquidity ratio
Figure 4Liquidity ratio
Looking to the liquidity aspect, current and quick ratio in 2013 was 3.60:1 and 2.59:1 are
the sign of strong creditworthiness. In following year, it has been increased to 3.80:1 and 1.85:1
whilst in 2017; both came down to 2.84:1 and 1.25:1, still, the ratio is above industry benchmark
of 2:1 & 1:1 which demonstrates that CSL Limited have strong liquidity position. However,
Baxter’s CR is low to 2.40; however, quick ratio is high to 1.87:1. The results clearly reflect that
both the firms maintained enough capital in the business itself so that payable obligations to
suppliers can be paid on right time (Goldmann, 2017).
As per the financial analysis, it is determined that company’s stock velocity increased and
as a result, CSL take more time to generate sales from its stock. Inventory days got up from
250.32 to 282.61 days in 2017. In contrast, effective management of cash through prompt receipt
from their receivables and delayed pay off to suppliers made it possible for the firm to have high
cash balance. Evidencing it from the results derived, payable days go up to 43.77 days whereas
receivable days shows a little bit decline from 60.05 days to 58.73 days (Boyas and Teeter,
2017). On the other hand, company managers have not optimally and efficiently used their assets
available to generate high revenues as its assets turnover ratio dropped from 0.83 to 0.76 times,
still, in comparative to Braxter, it is good.
8 | P a g e
Paraphrase This Document
Need a fresh take? Get an instant paraphrase of this document with our AI Paraphraser
2013 2014 2015 2016 2017
0.00
0.10
0.20
0.30
0.40
0.50
0.60
0.70
0.80
0.90
1.00
Debt to equity ratios
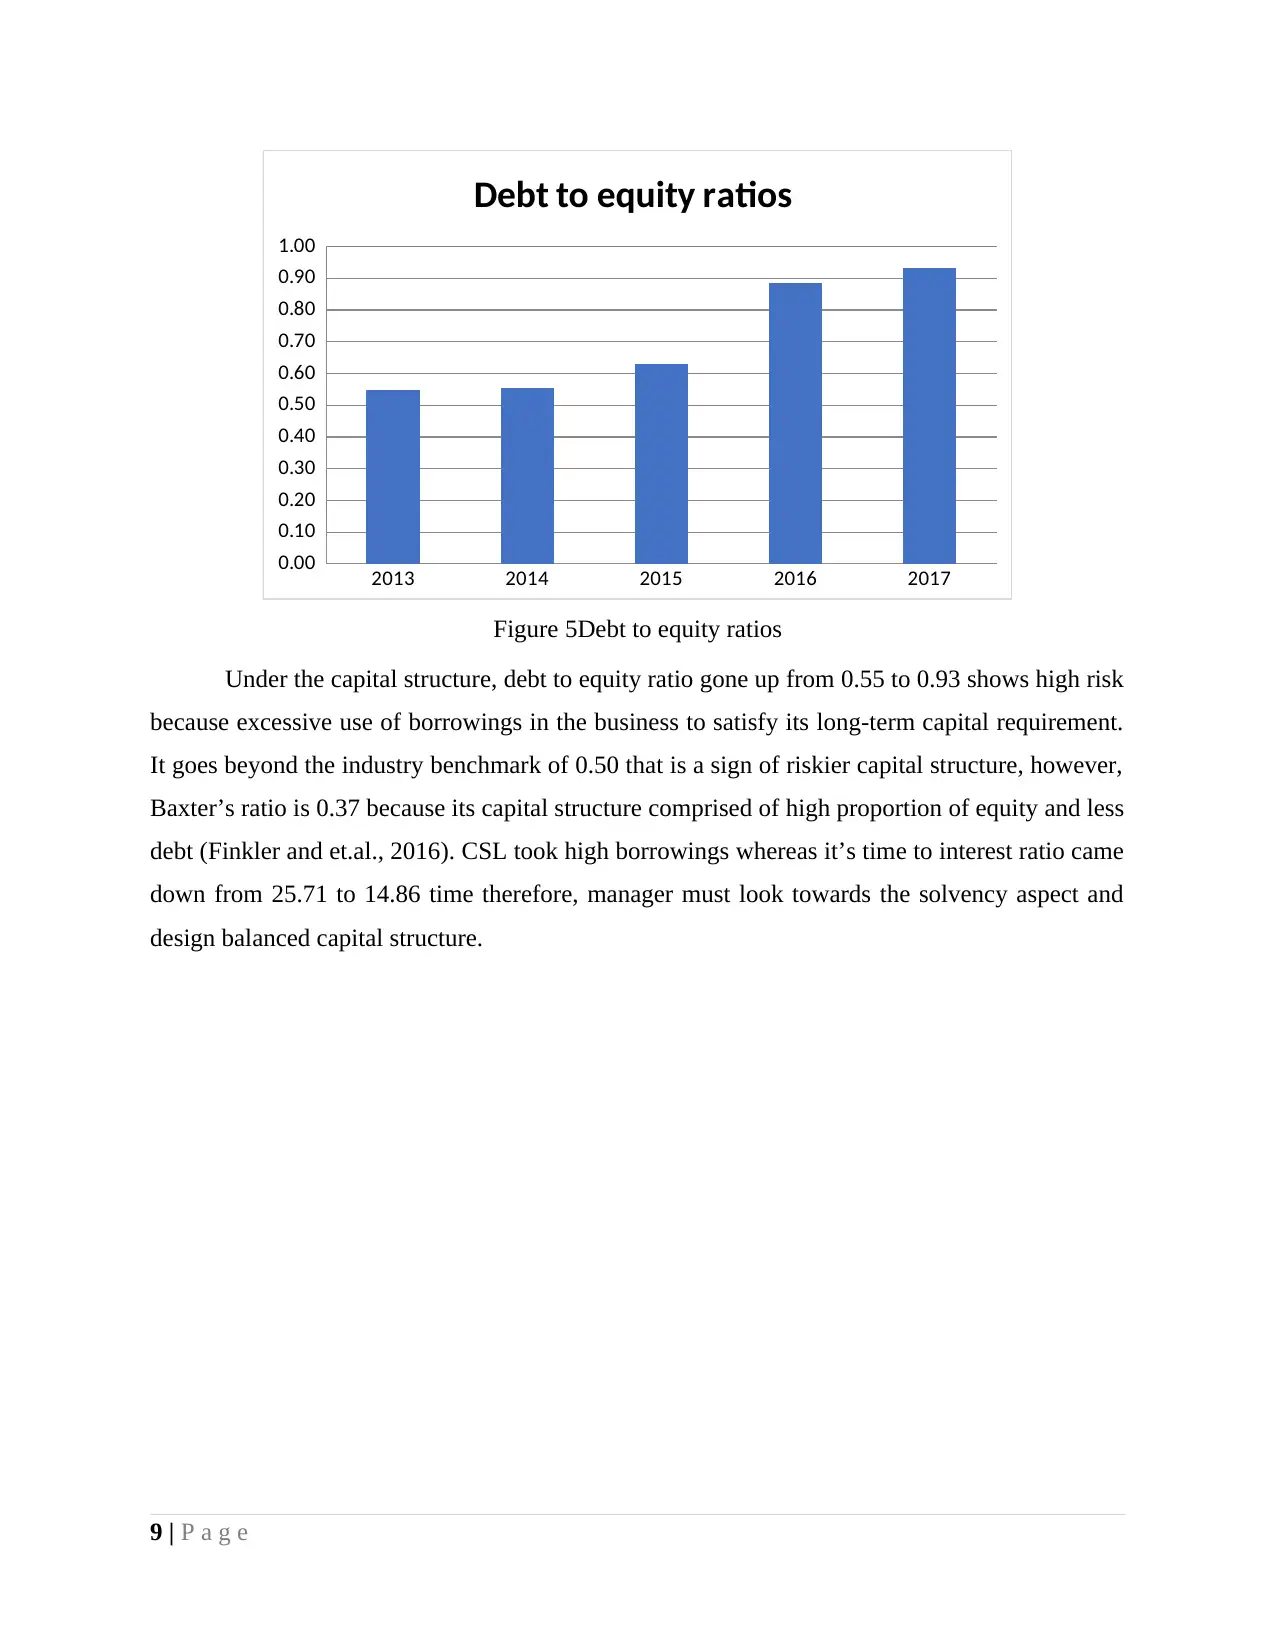
Figure 5Debt to equity ratios
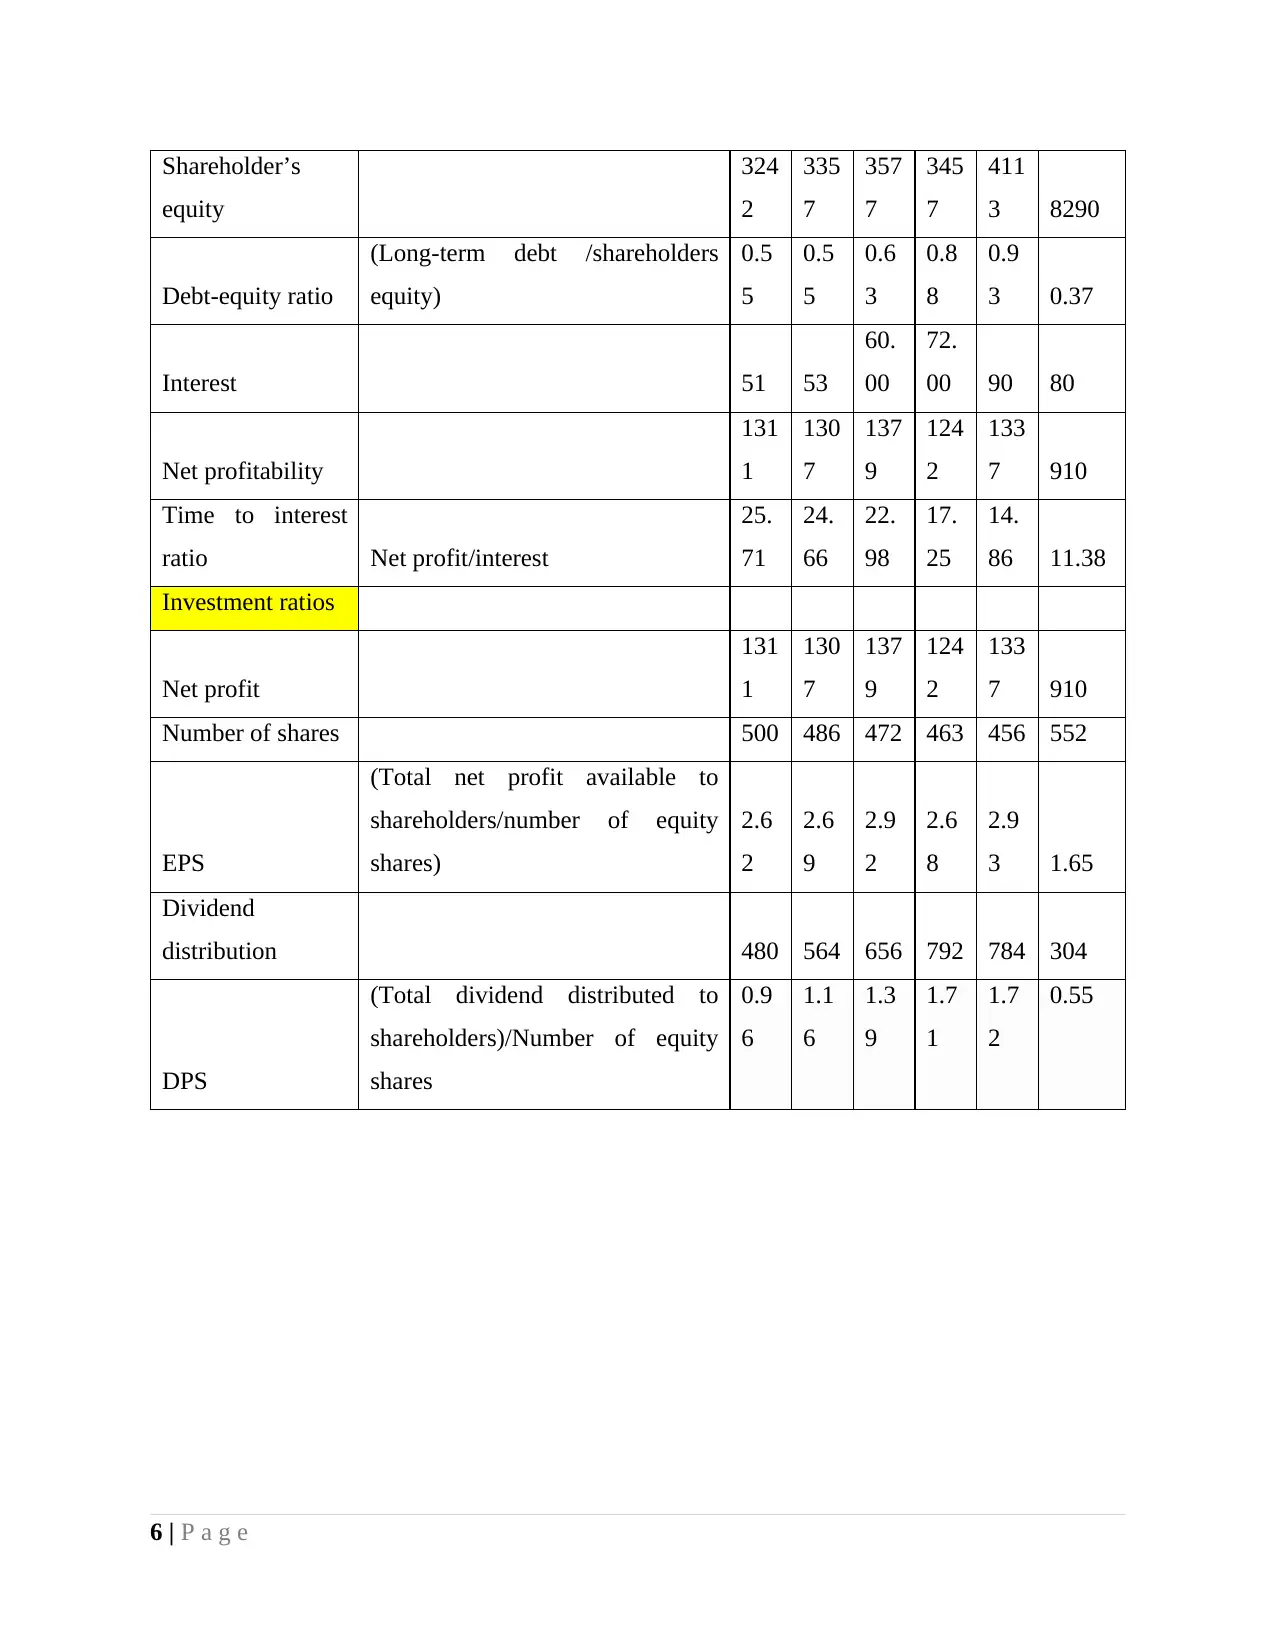
Under the capital structure, debt to equity ratio gone up from 0.55 to 0.93 shows high risk
because excessive use of borrowings in the business to satisfy its long-term capital requirement.
It goes beyond the industry benchmark of 0.50 that is a sign of riskier capital structure, however,
Baxter’s ratio is 0.37 because its capital structure comprised of high proportion of equity and less
debt (Finkler and et.al., 2016). CSL took high borrowings whereas it’s time to interest ratio came
down from 25.71 to 14.86 time therefore, manager must look towards the solvency aspect and
design balanced capital structure.
9 | P a g e
0.00
0.10
0.20
0.30
0.40
0.50
0.60
0.70
0.80
0.90
1.00
Debt to equity ratios
Figure 5Debt to equity ratios
Under the capital structure, debt to equity ratio gone up from 0.55 to 0.93 shows high risk
because excessive use of borrowings in the business to satisfy its long-term capital requirement.
It goes beyond the industry benchmark of 0.50 that is a sign of riskier capital structure, however,
Baxter’s ratio is 0.37 because its capital structure comprised of high proportion of equity and less
debt (Finkler and et.al., 2016). CSL took high borrowings whereas it’s time to interest ratio came
down from 25.71 to 14.86 time therefore, manager must look towards the solvency aspect and
design balanced capital structure.
9 | P a g e
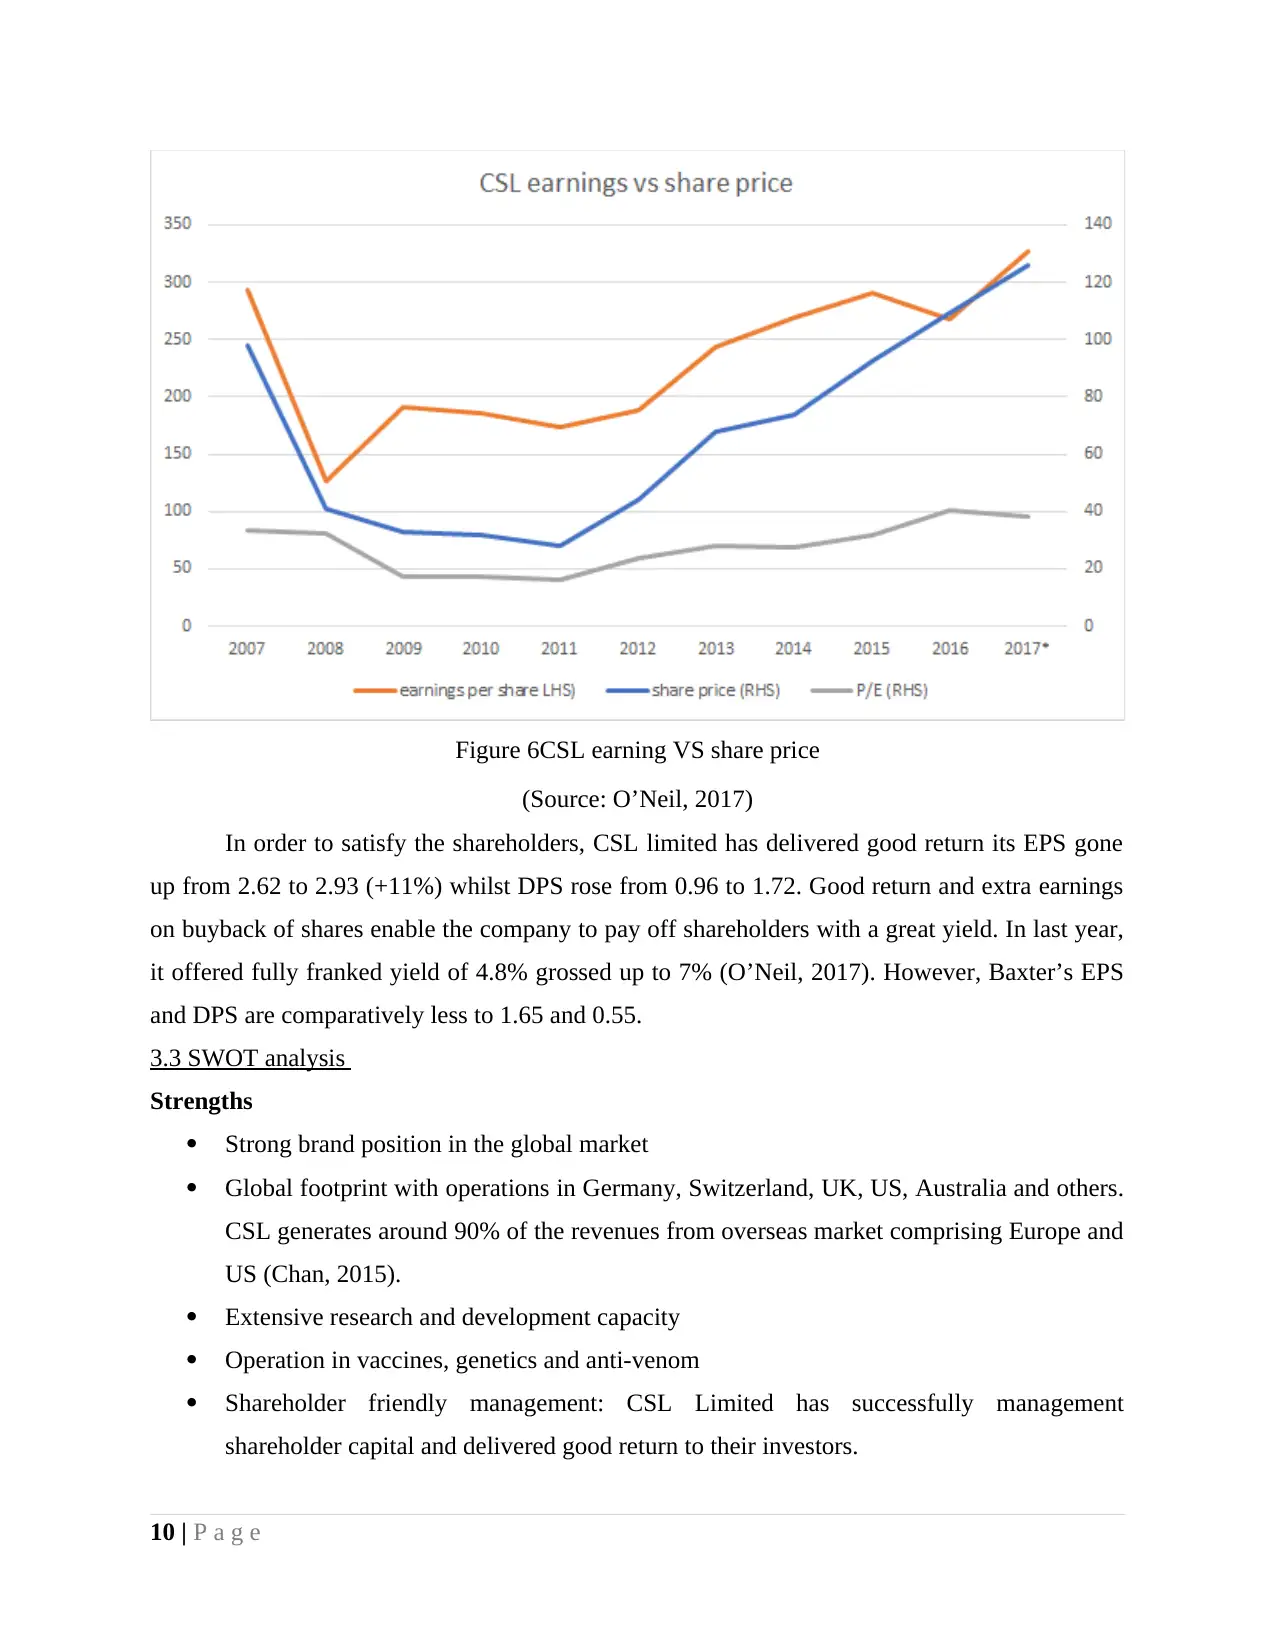
Figure 6CSL earning VS share price
(Source: O’Neil, 2017)
In order to satisfy the shareholders, CSL limited has delivered good return its EPS gone
up from 2.62 to 2.93 (+11%) whilst DPS rose from 0.96 to 1.72. Good return and extra earnings
on buyback of shares enable the company to pay off shareholders with a great yield. In last year,
it offered fully franked yield of 4.8% grossed up to 7% (O’Neil, 2017). However, Baxter’s EPS
and DPS are comparatively less to 1.65 and 0.55.
3.3 SWOT analysis
Strengths
Strong brand position in the global market
Global footprint with operations in Germany, Switzerland, UK, US, Australia and others.
CSL generates around 90% of the revenues from overseas market comprising Europe and
US (Chan, 2015).
Extensive research and development capacity
Operation in vaccines, genetics and anti-venom
Shareholder friendly management: CSL Limited has successfully management
shareholder capital and delivered good return to their investors.
10 | P a g e
⊘ This is a preview!⊘
Do you want full access?
Subscribe today to unlock all pages.
Trusted by 1+ million students worldwide
1 out of 21
Related Documents


Your All-in-One AI-Powered Toolkit for Academic Success.
+13062052269
info@desklib.com
Available 24*7 on WhatsApp / Email
![[object Object]](/_next/static/media/star-bottom.7253800d.svg)
Unlock your academic potential
Copyright © 2020–2026 A2Z Services. All Rights Reserved. Developed and managed by ZUCOL.