Impact of S&P/ASX 200 on CSL Stock Price: Regression Analysis

Verified

Added on  2023/01/23

|4
|1120
|31
Project
AI Summary
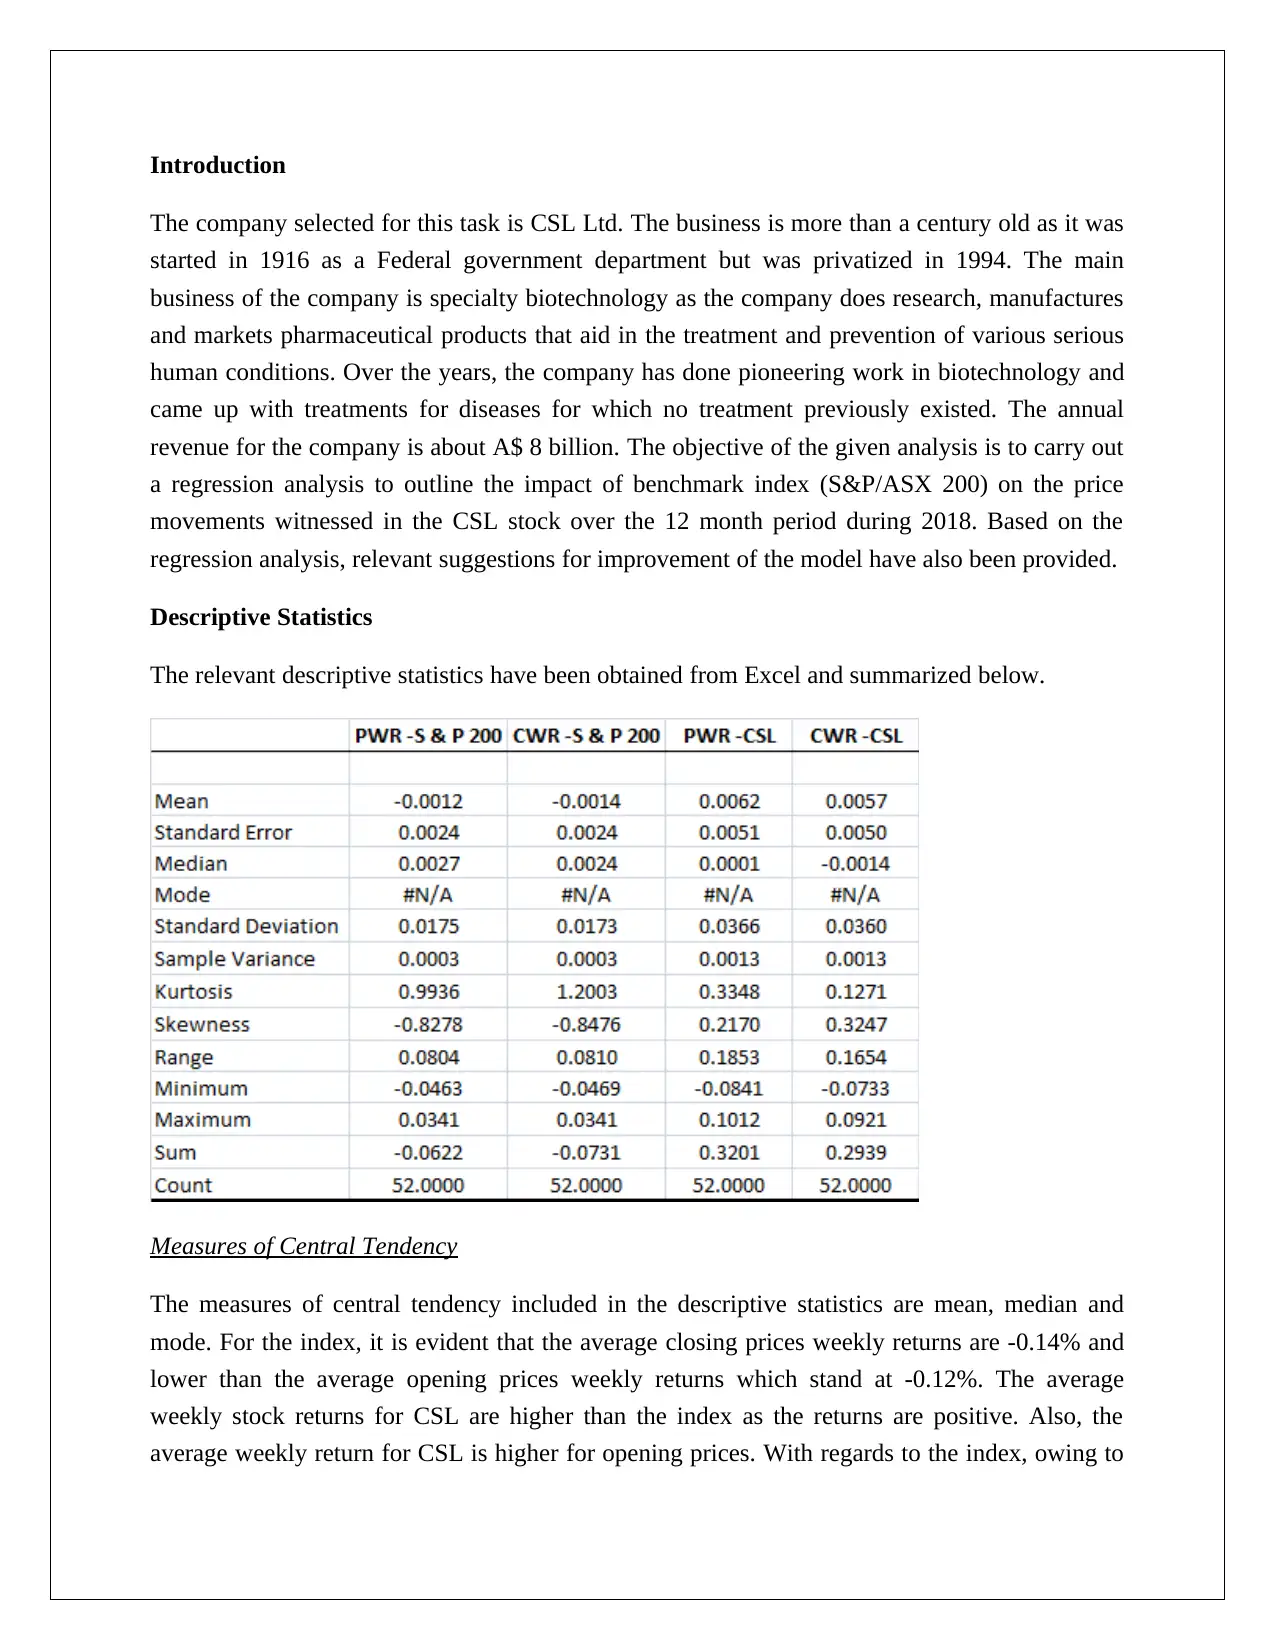
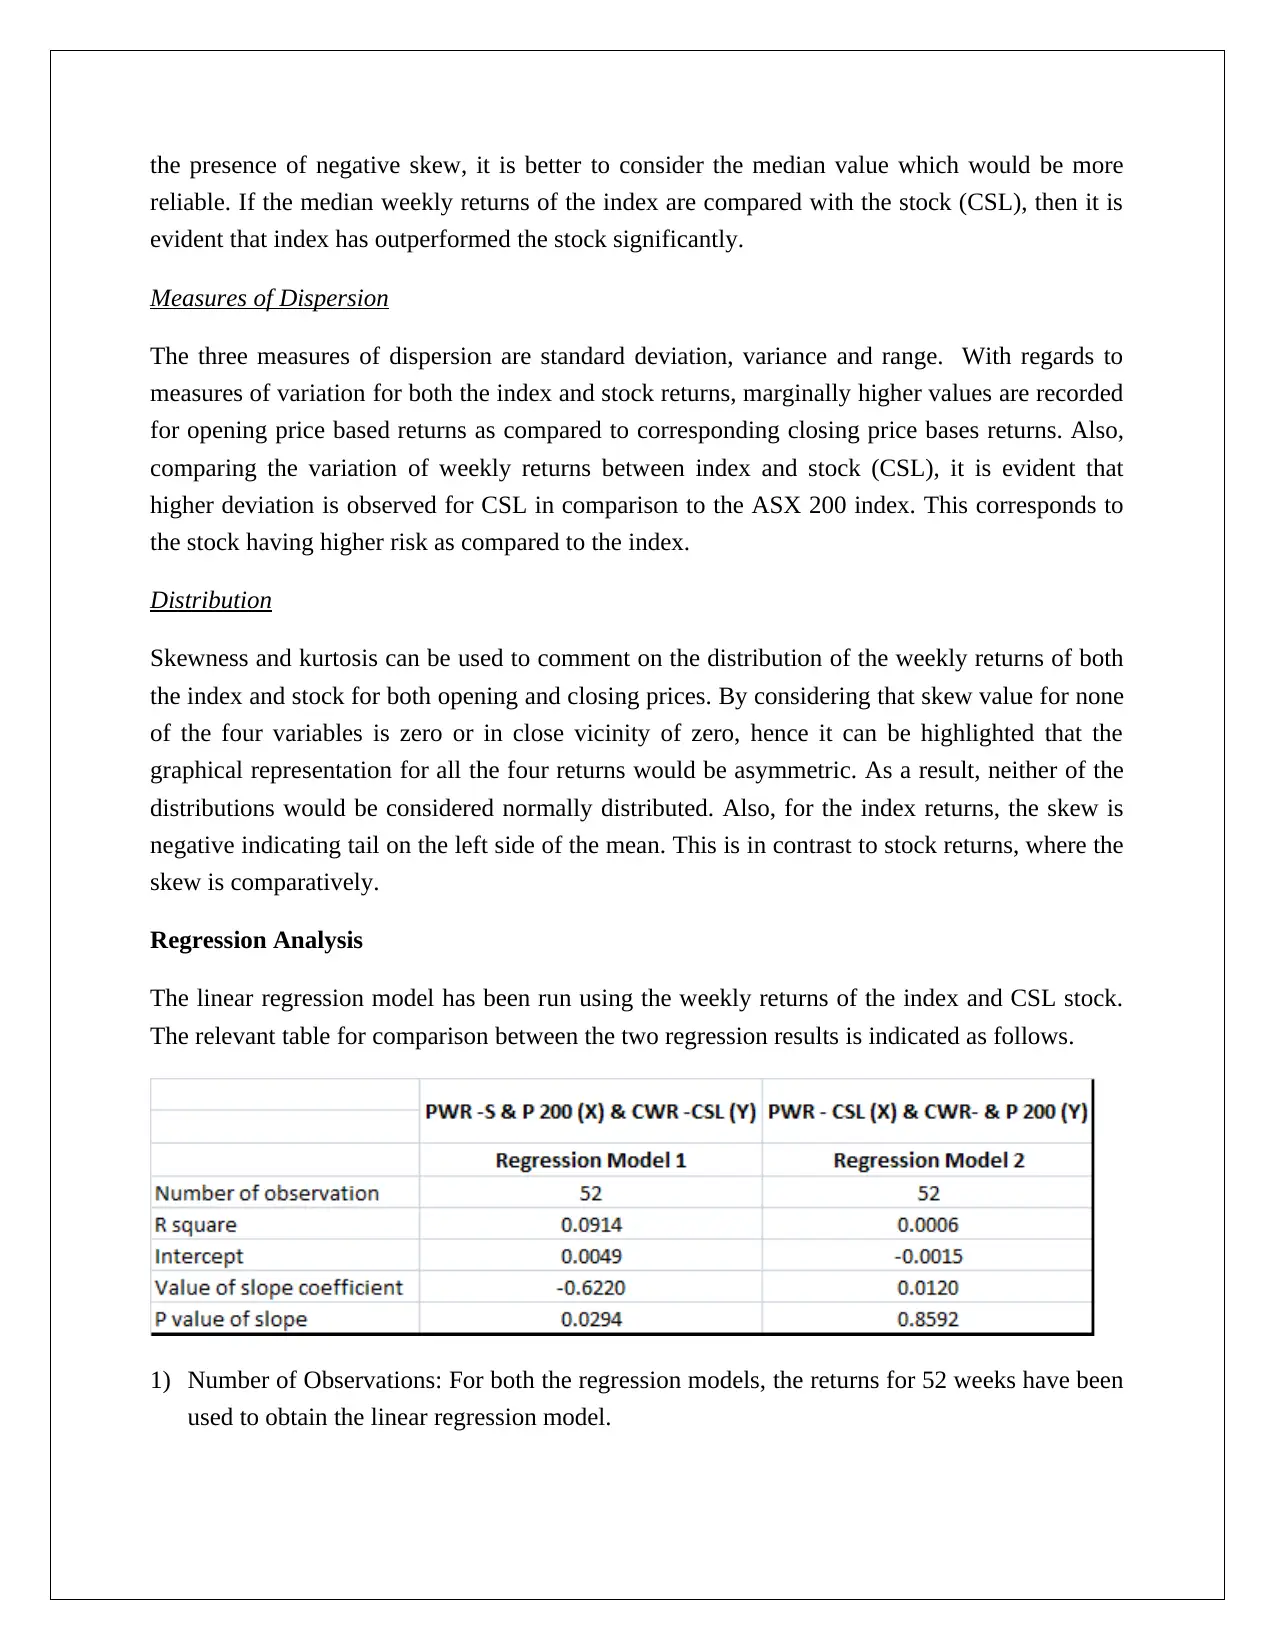
This project provides a quantitative analysis of CSL Ltd., a biotechnology company, focusing on the impact of the S&P/ASX 200 index on CSL stock price movements during 2018. The analysis employs regression models to assess the relationship between the index and the stock's weekly returns, utilizing descriptive statistics like mean, median, and measures of dispersion. The project highlights the poor fit of both regression models based on low R-squared values, though the slope is statistically significant in the first model. The findings indicate higher risk for CSL compared to the index. The conclusion suggests improvements to the models, including incorporating relevant predictor variables and, in one case, interchanging the dependent and independent variables. The project's objective is to provide insights into financial modeling and stock performance analysis.
Document Page
QUANTIATIVE METHOD FOR ECONOMIC ANALYSIS
STUDENT ID:
[Pick the date]
tabler-icon-diamond-filled.svg

Paraphrase This Document

Need a fresh take? Get an instant paraphrase of this document with our AI Paraphraser
Document Page
Introduction
The company selected for this task is CSL Ltd. The business is more than a century old as it was
started in 1916 as a Federal government department but was privatized in 1994. The main
business of the company is specialty biotechnology as the company does research, manufactures
and markets pharmaceutical products that aid in the treatment and prevention of various serious
human conditions. Over the years, the company has done pioneering work in biotechnology and
came up with treatments for diseases for which no treatment previously existed. The annual
revenue for the company is about A$ 8 billion. The objective of the given analysis is to carry out
a regression analysis to outline the impact of benchmark index (S&P/ASX 200) on the price
movements witnessed in the CSL stock over the 12 month period during 2018. Based on the
regression analysis, relevant suggestions for improvement of the model have also been provided.
Descriptive Statistics
The relevant descriptive statistics have been obtained from Excel and summarized below.
Measures of Central Tendency
The measures of central tendency included in the descriptive statistics are mean, median and
mode. For the index, it is evident that the average closing prices weekly returns are -0.14% and
lower than the average opening prices weekly returns which stand at -0.12%. The average
weekly stock returns for CSL are higher than the index as the returns are positive. Also, the
average weekly return for CSL is higher for opening prices. With regards to the index, owing to
Document Page
the presence of negative skew, it is better to consider the median value which would be more
reliable. If the median weekly returns of the index are compared with the stock (CSL), then it is
evident that index has outperformed the stock significantly.
Measures of Dispersion
The three measures of dispersion are standard deviation, variance and range. With regards to
measures of variation for both the index and stock returns, marginally higher values are recorded
for opening price based returns as compared to corresponding closing price bases returns. Also,
comparing the variation of weekly returns between index and stock (CSL), it is evident that
higher deviation is observed for CSL in comparison to the ASX 200 index. This corresponds to
the stock having higher risk as compared to the index.
Distribution
Skewness and kurtosis can be used to comment on the distribution of the weekly returns of both
the index and stock for both opening and closing prices. By considering that skew value for none
of the four variables is zero or in close vicinity of zero, hence it can be highlighted that the
graphical representation for all the four returns would be asymmetric. As a result, neither of the
distributions would be considered normally distributed. Also, for the index returns, the skew is
negative indicating tail on the left side of the mean. This is in contrast to stock returns, where the
skew is comparatively.
Regression Analysis
The linear regression model has been run using the weekly returns of the index and CSL stock.
The relevant table for comparison between the two regression results is indicated as follows.
1) Number of Observations: For both the regression models, the returns for 52 weeks have been
used to obtain the linear regression model.
Document Page
2) R Square- For the regression model 1, R2 value is 0.0914 which implies that only 9.14% of
the changes in CWR-CSL can be explained on the basis of corresponding movements in
PWR-S&P 200. For the regression model 2, R2 value is 0.0006 which implies that only
0.06% of the changes in CWR-S&P 200 can be explained on the basis of corresponding
movements in PWR-CSL. It is evident that the prediction power for both the models is quite
poor. Both the models do not represent a good fit.
3) Intercept – This is defined as the value of the dependent variable when independent variable
value is zero. For the regression model 1, when PWR-S&P 200 would be zero, then value of
CWR-CSL would be 0.49%. For the regression model 2, when PWR-CSL would be zero,
then value of CWR-S&P 200 would be 0.15%.
4) Value of slope coefficient – Regression model 1 indicates that an increase in PWR-S&P 200
returns by 1% would result in decline of 0.622% in CWR-CSL. Regression model 2 indicates
that an increase in PWR-CSL returns by 1% would result in increase of 1.20% in CWR- S&P
200.
5) P value of slope- The p value of slope for regression 1 is 0.0294 which is lower than the
assumed significance level of 5%. As a result, the slope is considered to be statistically
significant. This would not be true for regression 2 where the p value of 0.8592 is greater
than 0.05 and hence hints at the slope coefficient being statistically insignificant.
Conclusion
From the above results, it can be concluded that both the regressions have a poor fit owing to
abysmally low R2 value. However, the slope for regression model 1 is significant which is not
the case for regression model 2. Besides, the median returns for the index are higher than the
corresponding returns for CSL stock. However the risk is higher for CSL in comparison to the
index. With regards to improving the regression 1, it is imperative relevant predictor variables
ought to be inserted so as to improve R2. These may be in the form of returns on rival stocks
coupled with breakout of any deadly disease. With regards to the regression 2 model, it is evident
that the slope itself is insignificant. As a result, it is necessary that the dependent and
independent variable need to be interchanged for the regression model 2. This is because the
performance of index would not be determined by the performance of an individual stock which
has a very small weight in the index. Additionally, relevant predictor variables similar to those
identified for regression model 1 should be inserted.
chevron_up_icon
1 out of 4
circle_padding
hide_on_mobile
zoom_out_icon
[object Object]