ELEC3500 Telecommunications Networks: Bus and Hub CSMA/CD Analysis
VerifiedAdded on 2023/06/03
|11
|1948
|143
Practical Assignment
AI Summary
This assignment analyzes the performance of bus and hub-based CSMA/CD networks using OMNET++ simulation models. The study, conducted for ELEC3500 at Monash University, investigates the impact of CSMA/CD on network efficiency, focusing on load versus delay and collision plots. Four simulations were performed, varying parameters like traffic load and packet length. The results highlight similarities in the performance of both network configurations, with CSMA/CD significantly improving overall performance by minimizing collisions. The report includes detailed discussions on the effect of bus segment length, packet length, and traffic intensity on network behavior, supported by graphical representations and answers to specific questions regarding network performance and efficiency.
ELEC3500 Surname
Monash University
Faculty of Engineering
ELEC3500 Telecommunications Networks
Performance Analysis of Bus and Hub Based CSMA/CD Networks
Student’s Name:
Registration Number:
Date:
i
Monash University
Faculty of Engineering
ELEC3500 Telecommunications Networks
Performance Analysis of Bus and Hub Based CSMA/CD Networks
Student’s Name:
Registration Number:
Date:
i
Paraphrase This Document
Need a fresh take? Get an instant paraphrase of this document with our AI Paraphraser
ELEC3500 Surname
2. Summary
Carrier sense multiple access with collision detection (CSMA/CD) networks are mostly used to
control access in Ethernets for local area networks (LAN). It immediately terminates the
transmission of any data or information upon detection of any collision. In this lab experiment,
the performance of bus and hub configurations based CSMA/CD networks are analyzed using
OMNET++ simulation models that were developed previously.
The models are run in either hub or bus network configurations. Four simulations are conducted
based on the given parameters to obtain the desired results for analysis. From the results
obtained, a plot of load versus delay, the number of collisions are generated and analyzed.
The simulation results show more similarities in the performance of both bus and hub
configurations. With the inclusion of the CSMA/CD, both the performance of the bus and hub
configurations improve significantly.
ii
ELEC3500 Surname
Table of Contents
2. Summary......................................................................................................................................ii
3. Introduction..................................................................................................................................1
4. Methodology................................................................................................................................2
4.1 Objectives...............................................................................................................................2
4.2 Model description..................................................................................................................2
4.2 Procedure...............................................................................................................................3
5. Results and discussion.................................................................................................................3
6. Questions.....................................................................................................................................6
6. Conclusion...................................................................................................................................7
7. References....................................................................................................................................8
iii
⊘ This is a preview!⊘
Do you want full access?
Subscribe today to unlock all pages.
Trusted by 1+ million students worldwide
ELEC3500 Surname
3. Introduction
CSMA/CD detects collisions in the transmitting station through the carrier sensing that enables
the transmitting station to detect transmissions from other stations [2]. Upon detection of the
collision, the transmission process is stopped and the station waits for a random interval of time
before resending the frame again [7]. Generally, CSMA/CD is a medication to improve the
efficiency of the original CSMA by shortening the required time to resend a frame after collision
detection.
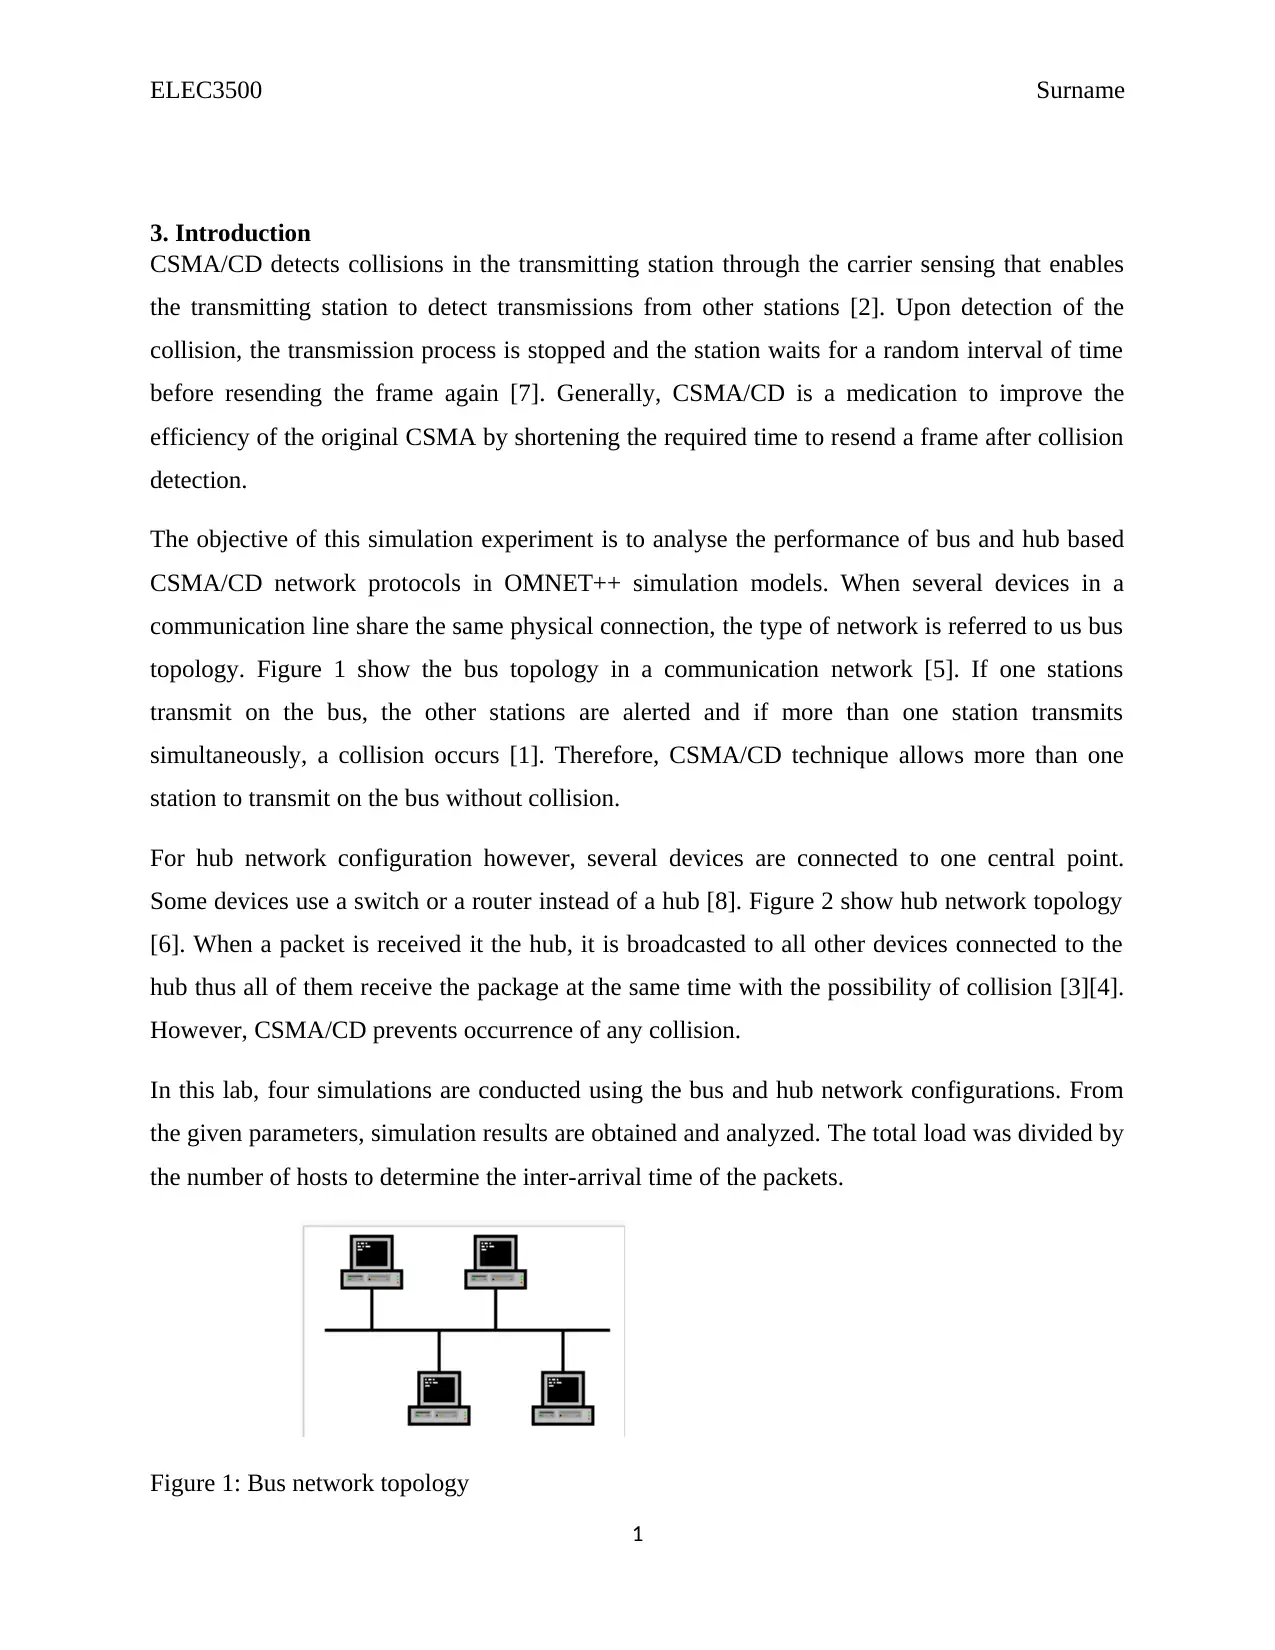
The objective of this simulation experiment is to analyse the performance of bus and hub based
CSMA/CD network protocols in OMNET++ simulation models. When several devices in a
communication line share the same physical connection, the type of network is referred to us bus
topology. Figure 1 show the bus topology in a communication network [5]. If one stations
transmit on the bus, the other stations are alerted and if more than one station transmits
simultaneously, a collision occurs [1]. Therefore, CSMA/CD technique allows more than one
station to transmit on the bus without collision.
For hub network configuration however, several devices are connected to one central point.
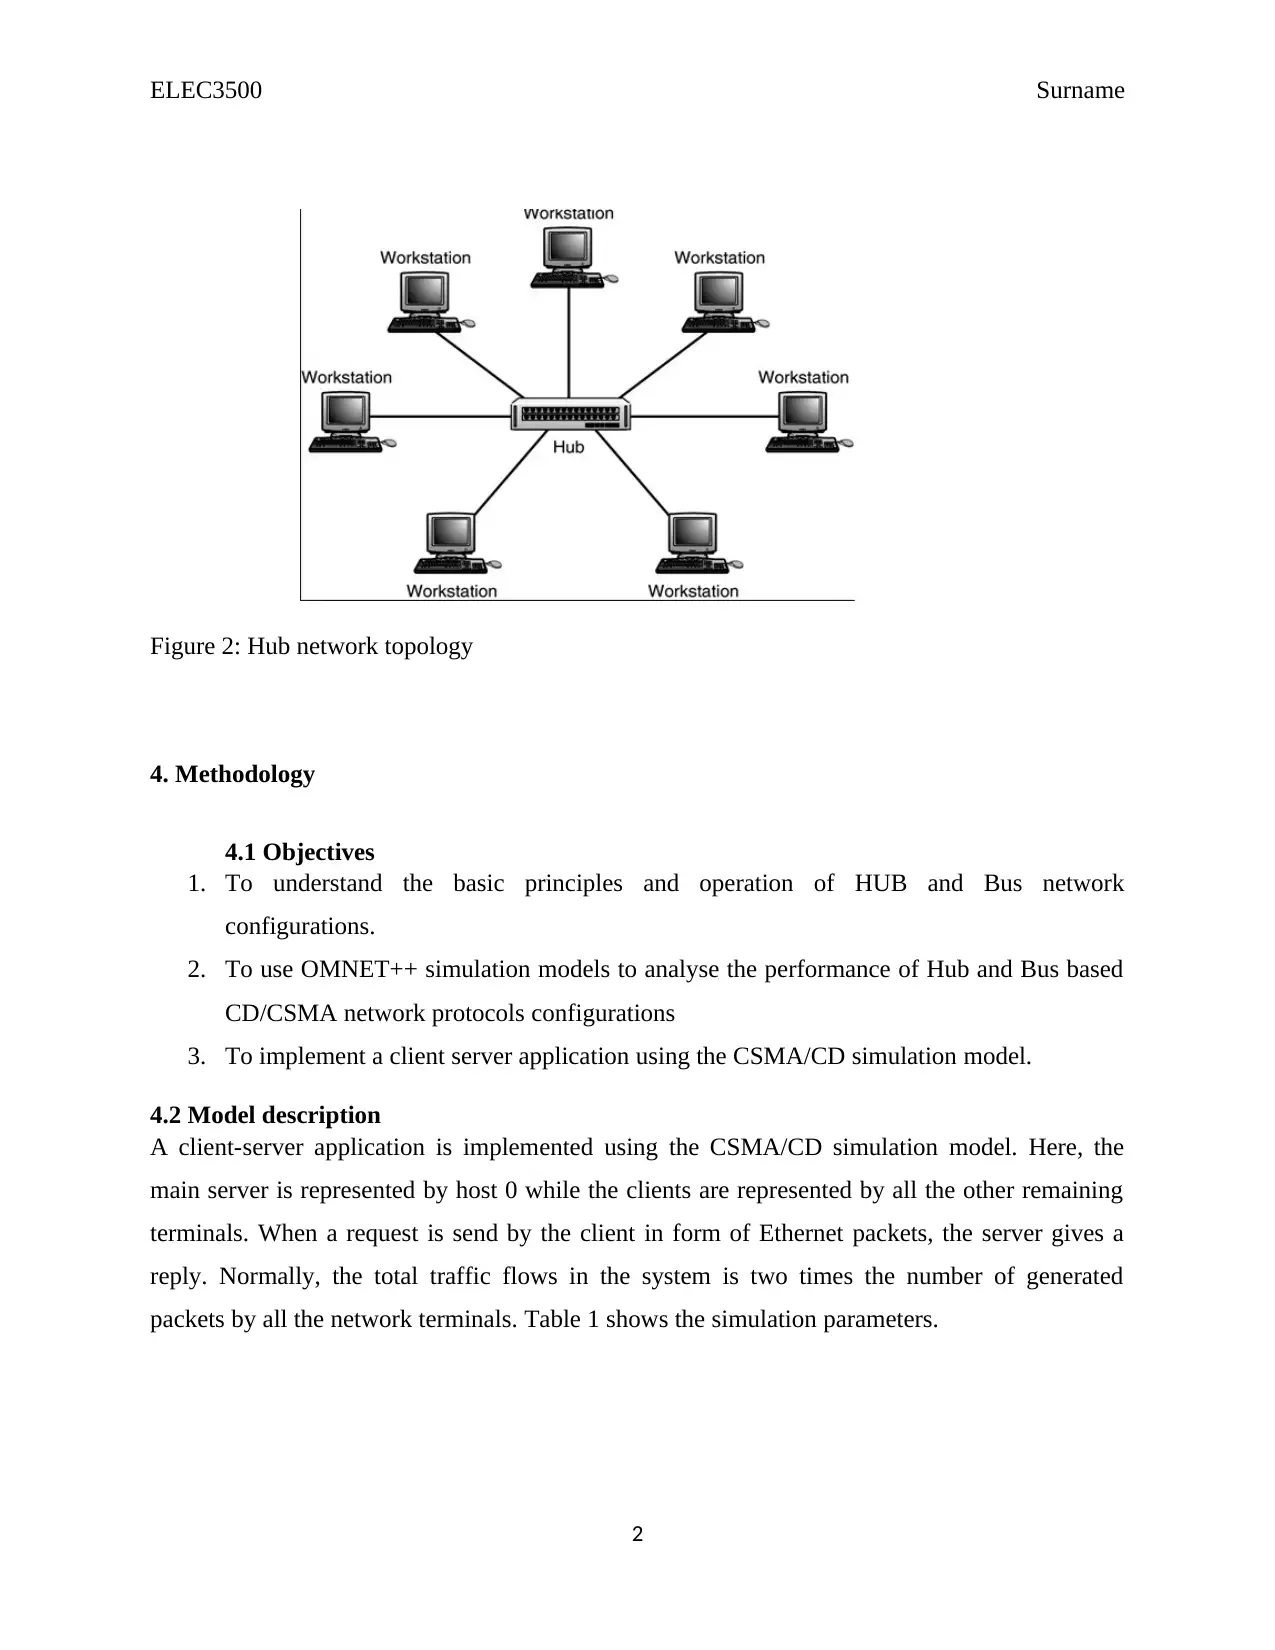
Some devices use a switch or a router instead of a hub [8]. Figure 2 show hub network topology
[6]. When a packet is received it the hub, it is broadcasted to all other devices connected to the
hub thus all of them receive the package at the same time with the possibility of collision [3][4].
However, CSMA/CD prevents occurrence of any collision.
In this lab, four simulations are conducted using the bus and hub network configurations. From
the given parameters, simulation results are obtained and analyzed. The total load was divided by
the number of hosts to determine the inter-arrival time of the packets.
Figure 1: Bus network topology
1
3. Introduction
CSMA/CD detects collisions in the transmitting station through the carrier sensing that enables
the transmitting station to detect transmissions from other stations [2]. Upon detection of the
collision, the transmission process is stopped and the station waits for a random interval of time
before resending the frame again [7]. Generally, CSMA/CD is a medication to improve the
efficiency of the original CSMA by shortening the required time to resend a frame after collision
detection.
The objective of this simulation experiment is to analyse the performance of bus and hub based
CSMA/CD network protocols in OMNET++ simulation models. When several devices in a
communication line share the same physical connection, the type of network is referred to us bus
topology. Figure 1 show the bus topology in a communication network [5]. If one stations
transmit on the bus, the other stations are alerted and if more than one station transmits
simultaneously, a collision occurs [1]. Therefore, CSMA/CD technique allows more than one
station to transmit on the bus without collision.
For hub network configuration however, several devices are connected to one central point.
Some devices use a switch or a router instead of a hub [8]. Figure 2 show hub network topology
[6]. When a packet is received it the hub, it is broadcasted to all other devices connected to the
hub thus all of them receive the package at the same time with the possibility of collision [3][4].
However, CSMA/CD prevents occurrence of any collision.
In this lab, four simulations are conducted using the bus and hub network configurations. From
the given parameters, simulation results are obtained and analyzed. The total load was divided by
the number of hosts to determine the inter-arrival time of the packets.
Figure 1: Bus network topology
1
Paraphrase This Document
Need a fresh take? Get an instant paraphrase of this document with our AI Paraphraser
ELEC3500 Surname
Figure 2: Hub network topology
4. Methodology
4.1 Objectives
1. To understand the basic principles and operation of HUB and Bus network
configurations.
2. To use OMNET++ simulation models to analyse the performance of Hub and Bus based
CD/CSMA network protocols configurations
3. To implement a client server application using the CSMA/CD simulation model.
4.2 Model description
A client-server application is implemented using the CSMA/CD simulation model. Here, the
main server is represented by host 0 while the clients are represented by all the other remaining
terminals. When a request is send by the client in form of Ethernet packets, the server gives a
reply. Normally, the total traffic flows in the system is two times the number of generated
packets by all the network terminals. Table 1 shows the simulation parameters.
2
ELEC3500 Surname
Simulation parameters Value
Rate of transmission (R) 10 Mbits/ second
Packet length (L) Server: 1000B and Client: 200B
Simulation length 800 seconds
Positions 0,50 and 100
Table 1: Simulation parameters.
4.2 Procedure
The previously developed OMNET++ simulation models found in the ELEC3500 folder were
utilized in this experiment. By selecting a model in the run window, the model was run both in
the Hub and Bus configurations mode. In cases of switched Lan selection, the line simulation
initial time was reduced.
For SIMULATION I, from the traffic load values given, results for both bus and hub models
were obtained. They included received channel collision and utilization, number of collisions and
packet delay versus traffic lad values. The packet inter-arrival time was varied to vary the traffic
load. For the hub model, server statistics and any other available terminal was used. For the bus
model, server statistics, statistics of two different terminals together with a terminal at the middle
and the end of the bus were utilized to obtain simulation results.
For SIMULATION II, the results of simulation I were obtained using different traffic loads and
terminal numbers.
SIMULATION III, was conducted using the bus mode only to determine the effects of the bus
length such as delay variability and propagation delay. The delay variabilities were compared
from the vector plots.
SIMULATION IV was conducted to determine the effects of packet length on collisions and
delay using the bus model by changing the size of the requested packet from the client. Two
different client packets were used to determine the collision numbers and delay vector plots from
the server and one of the bus terminals.
3
⊘ This is a preview!⊘
Do you want full access?
Subscribe today to unlock all pages.
Trusted by 1+ million students worldwide
ELEC3500 Surname
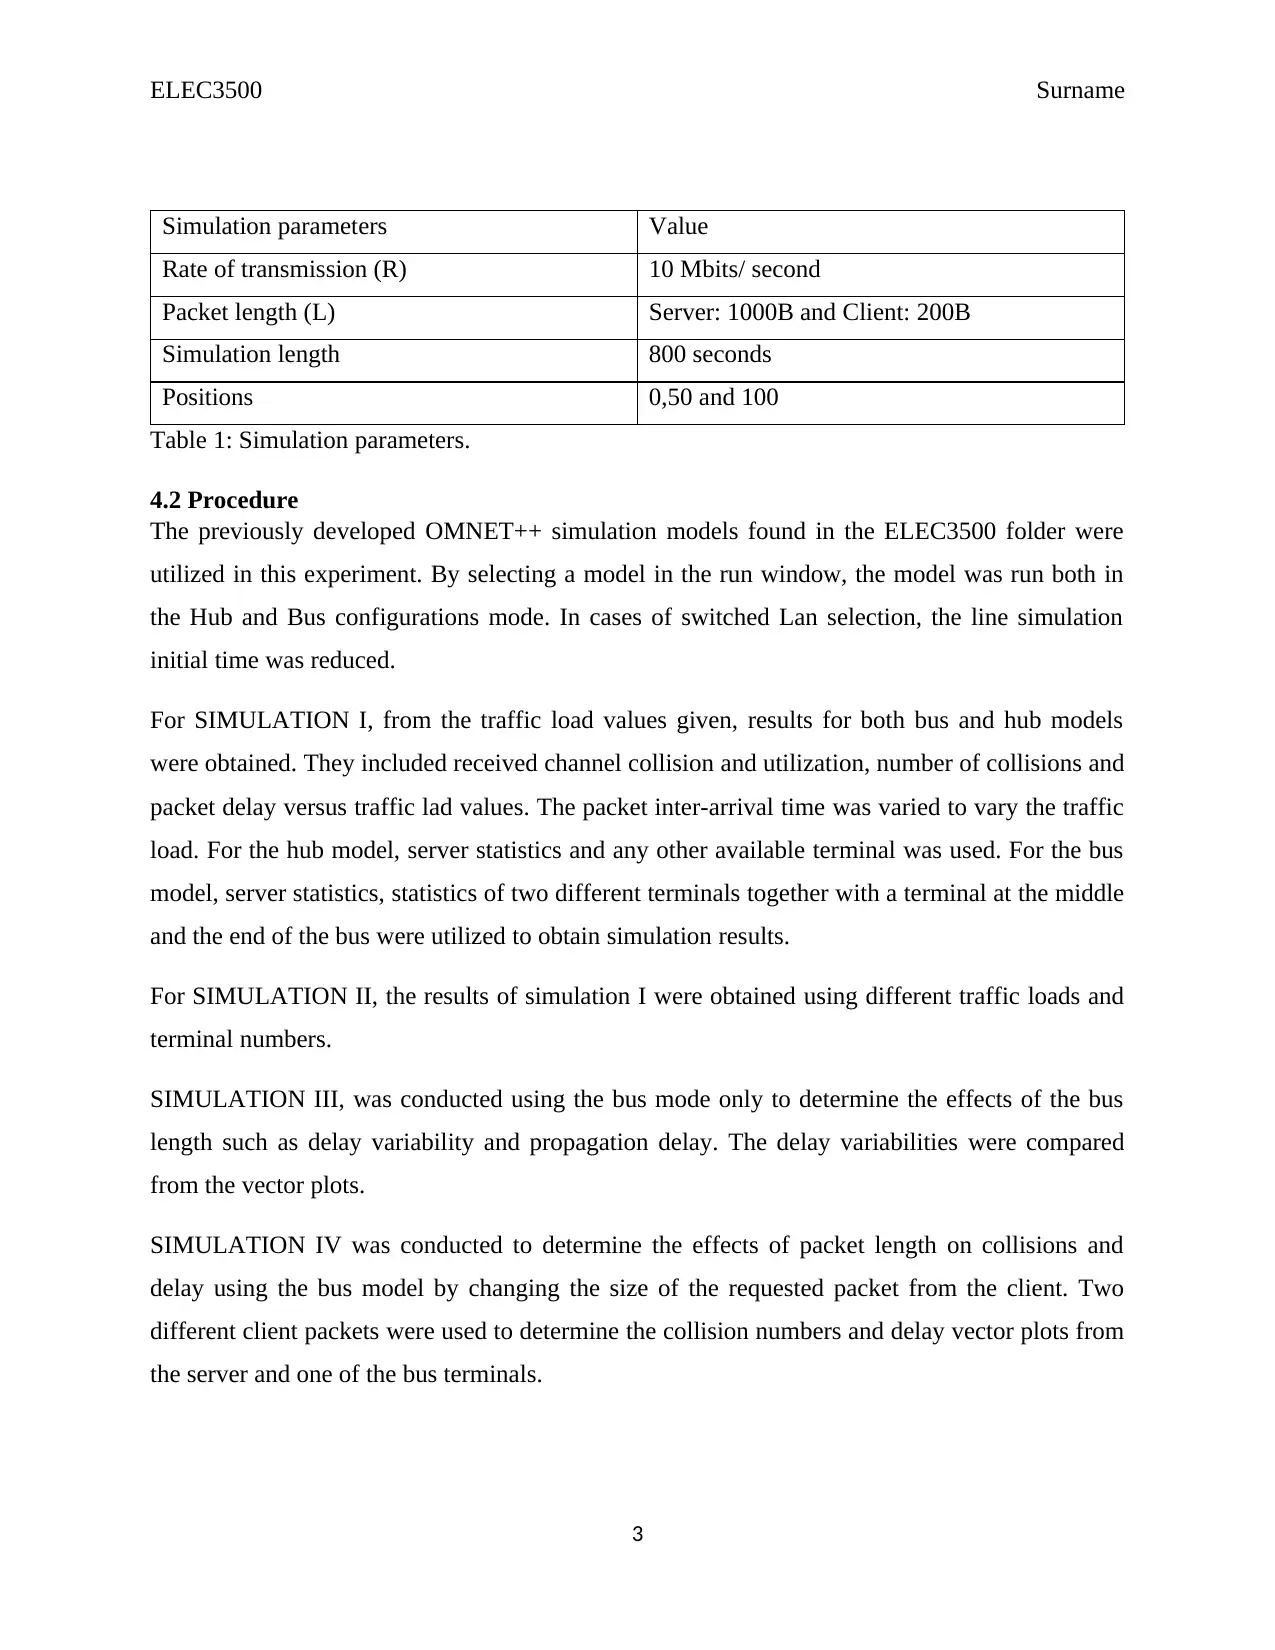
5. Results and discussion
Load vs delay and load vs collisions delay plots for both hub and bus configurations are
represented in the figures 3,4,5 and 6.
Figure 3: Load vs Delay plot for hub network configuration
4
5. Results and discussion
Load vs delay and load vs collisions delay plots for both hub and bus configurations are
represented in the figures 3,4,5 and 6.
Figure 3: Load vs Delay plot for hub network configuration
4
Paraphrase This Document
Need a fresh take? Get an instant paraphrase of this document with our AI Paraphraser
ELEC3500 Surname
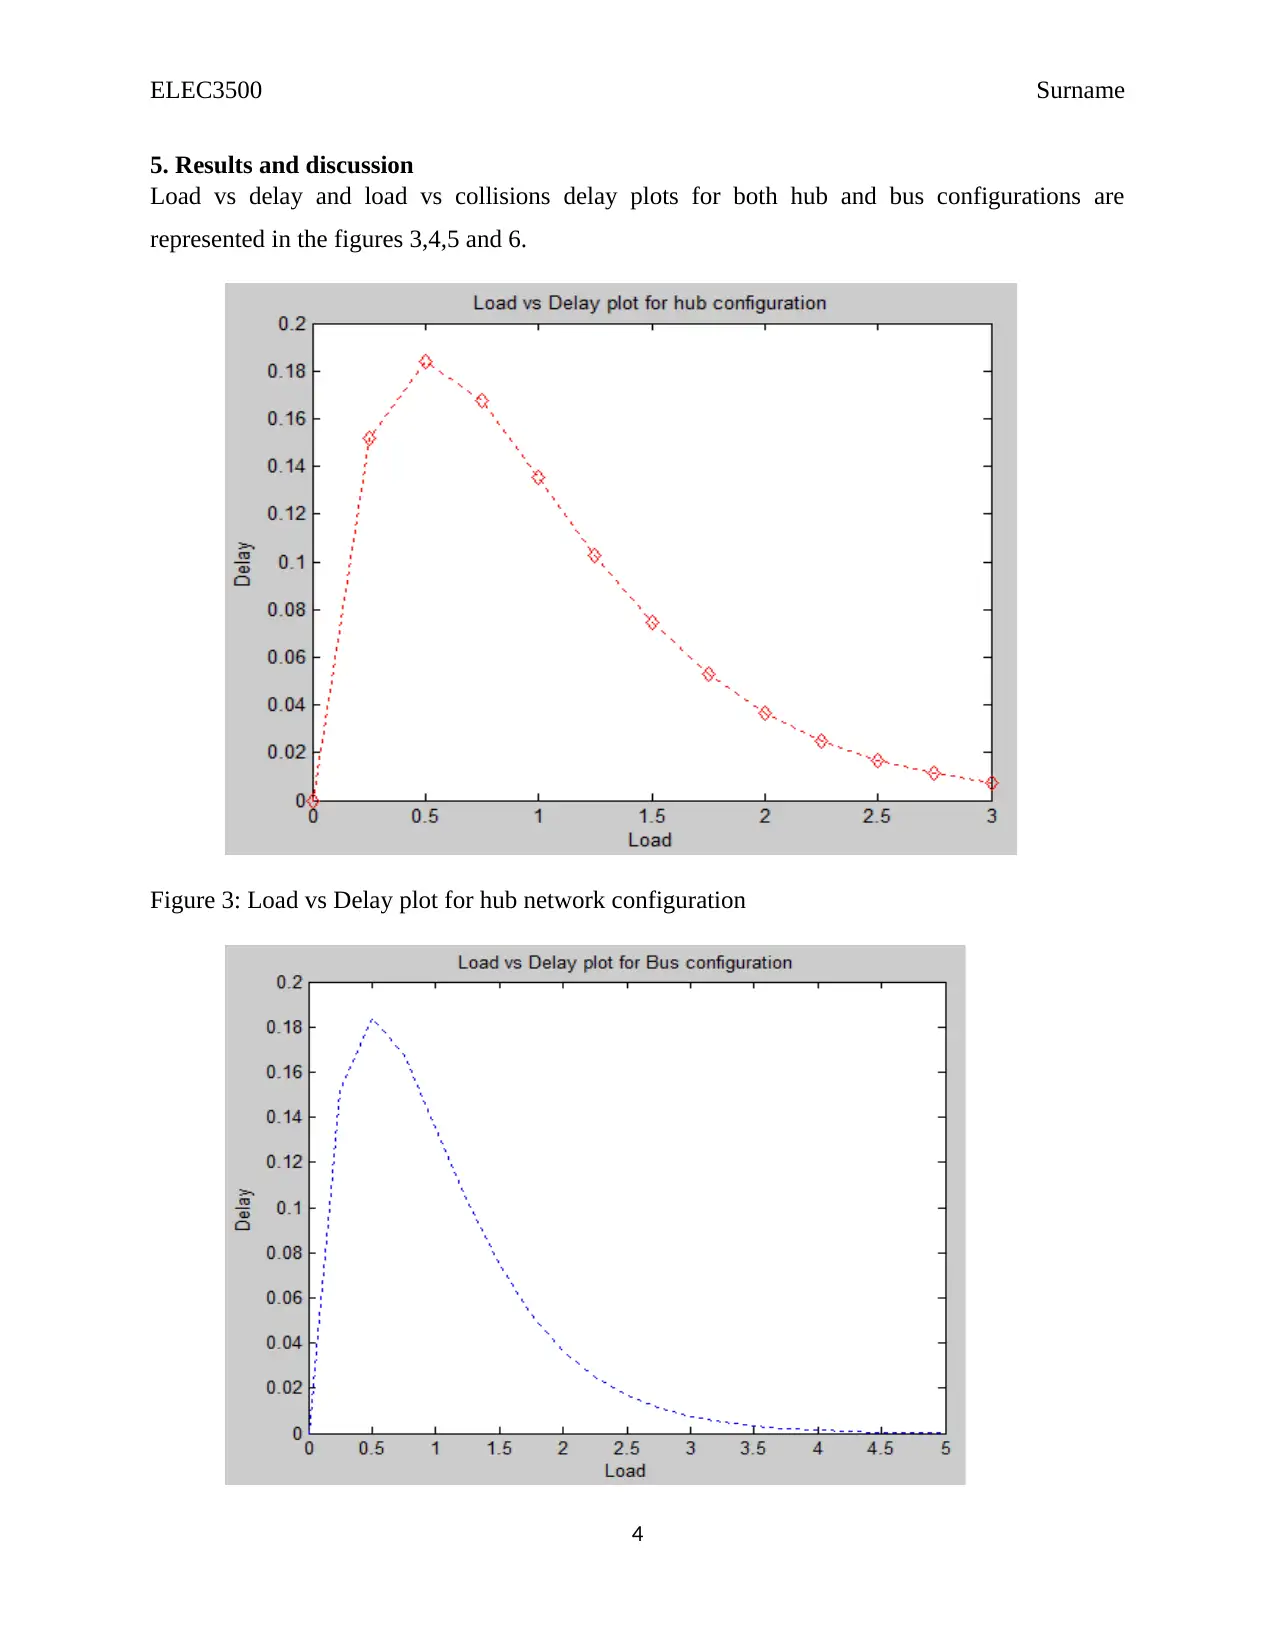
Figure 4: Load vs Delay plot for Bus network configuration
Figure 5: Load vs Collision plot for Bus network configuration
5
Figure 4: Load vs Delay plot for Bus network configuration
Figure 5: Load vs Collision plot for Bus network configuration
5
ELEC3500 Surname
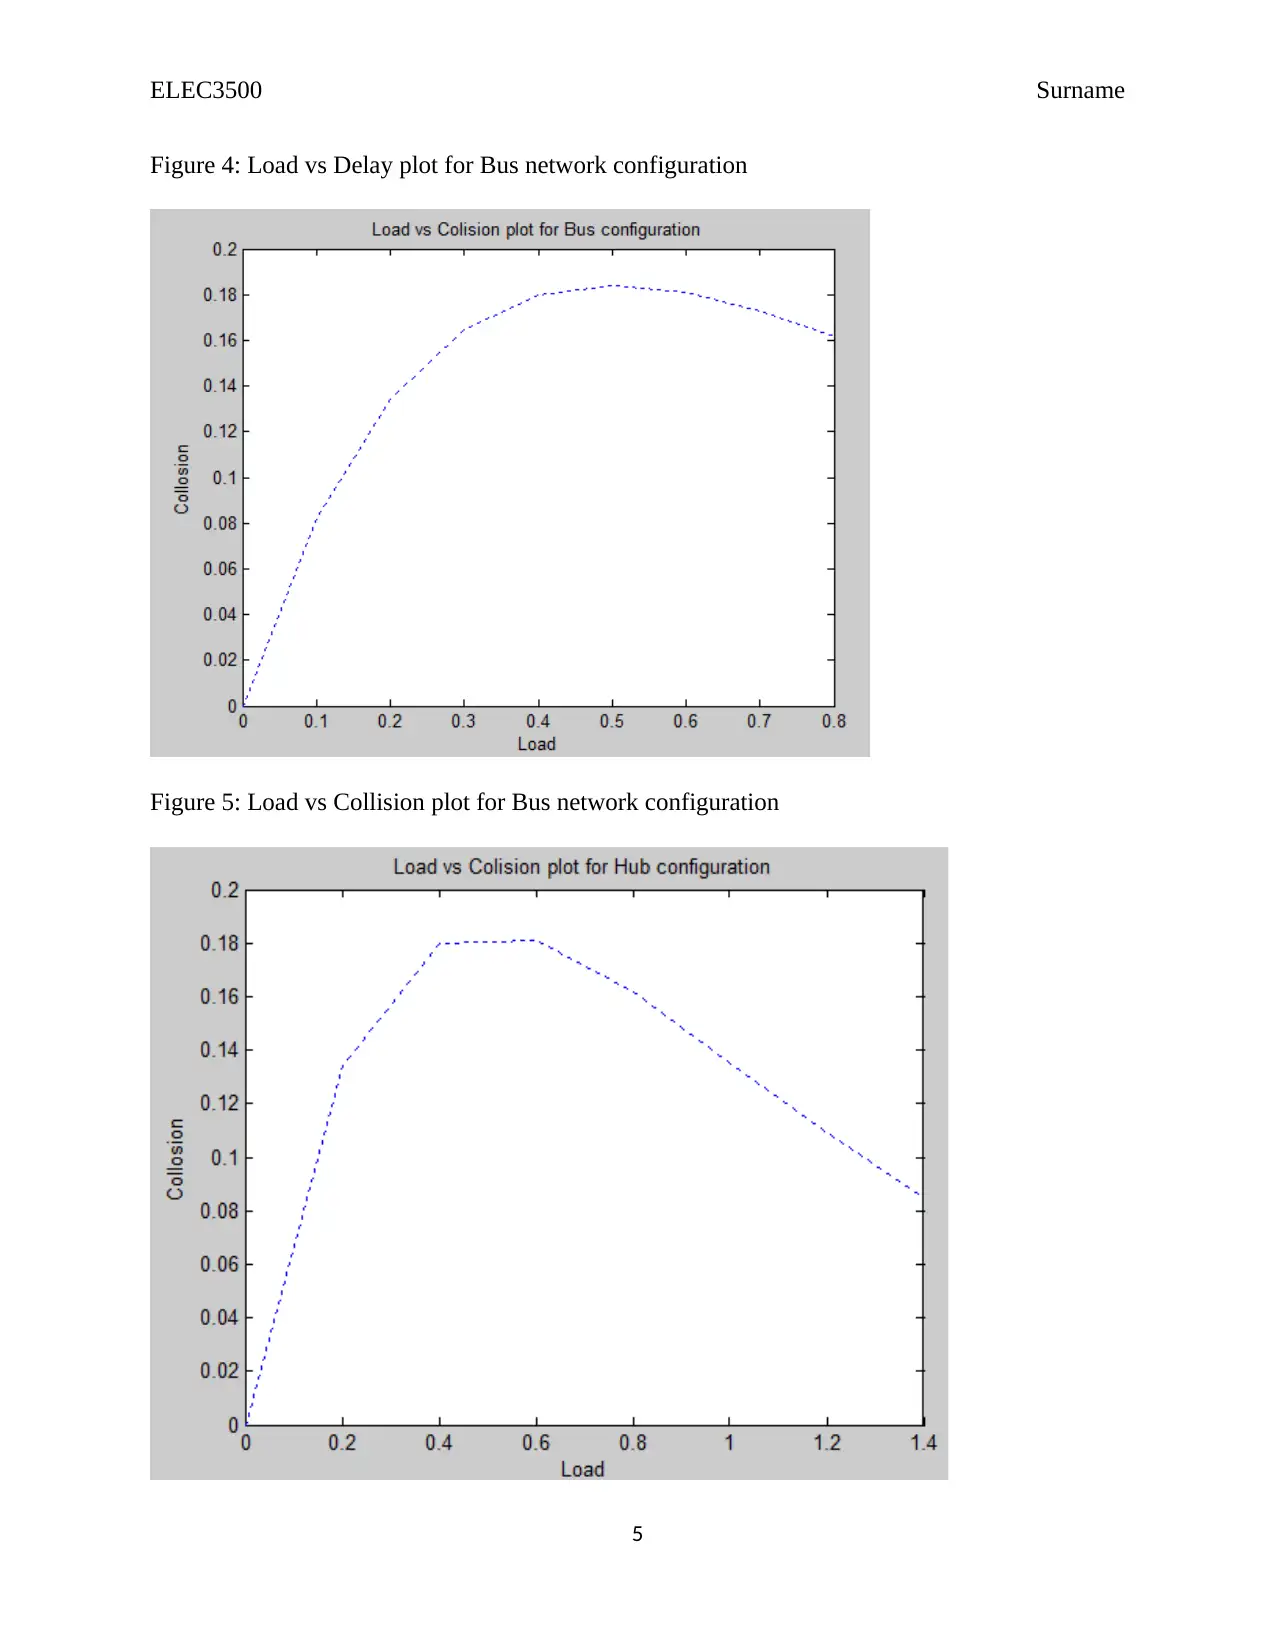
Figure 6: Load vs Collision plot for Hub network configuration
6. Questions
1. Consider the load vs delay and load vs collision plots for simulation no. 1. Use plots for
both Hub and Bus networks. Considering these plots identify the similarities and
differences between the hub and bus networks.
From the plotted graphs, there is much similarities between the hub and bus network
configuration as compared to the differences. The response is almost linear for both cases.
2. Consider the end to end delay vector plots, and receive channel utilization data from
simulation no. 3. Explain the effect of bus segment length on the performance (delay and
collision levels) of a bus network.
The shorter the bus segment length the higher the performance. On the other hand, longer bus
segment length leads to lower performance. This is because a shorter length permits first
transmission of data packages thus minimizing collision and package loss.
3. Comments on the receive link utilization vs the traffic intensity result. Does the link
utilization vary linearly or non-linearly with the traffic intensity? Briefly explain the
result.
The receive link utilization varies non-linearly with the traffic intensity due to package losses
and high collision possibility that occurs at high traffic intensity.
4. Using the simulation no. 4 statistics explain the effect of packet length on the bus
network performance.
A packet is generally a single unit that is transferred over time. A small packet length will take a
shorter time to be transmitted thus resulting to less number of collisions as compared to a packet
with longer length size. A larger packet also inhibits other devices from using the bus and it also
requires larger memory size.
5. Compare the delay variabilities values of hub and bus networks. Explain if there are any
major differences.
6
⊘ This is a preview!⊘
Do you want full access?
Subscribe today to unlock all pages.
Trusted by 1+ million students worldwide
ELEC3500 Surname
The delay variabilities values of the bus and hub networks are approximately the same as they
represent the time that a packet takes to be transmitted from one station to another.
6. Is it possible to achieve 100% efficiency using a bus based Ethernet LAN? Justify your
answer. (Hint: Efficiency is the ratio of the total no. of bits transmitted and the
transmission bit rate).
Generally, it is difficult to achieve 100% efficiency using bus based Ethernet LAN because of
the possible collisions and package loss that may occur when the other devices sharing the line
transmit data simultaneously. Also, in case of a line breakdown, the systems will not access the
network.
6. Conclusion
CSMA/CD minimizes the number of collisions both in the hub and bus network configurations.
It is generally and improvement of the initial CSMA protocol. The simulation results show more
similarities in the performance of both bus and hub configurations. With the inclusion of the
CSMA/CD, both the performance of the bus and hub configurations improve significantly.
7
Paraphrase This Document
Need a fresh take? Get an instant paraphrase of this document with our AI Paraphraser
ELEC3500 Surname
7. References
[1] U. Black, Data communications and distributed networks. New Delhi, India: Prentice-Hall
of India, 2008.
[2] S. P. H. and M. S. K., "Performance Analysis of CSMA, MACA and MACAW Protocols for
VANETs", International Journal of Future Computer and Communication, pp. 129-134, 2014.
[3] R. Moraes, F. Vasques and P. Portugal, "Survey of Real-Time Communication in CSMA-
Based Networks", Network Protocols and Algorithms, vol. 2, no. 1, 2010.
[4] S. Alumur, B. Kara and O. Karasan, "Multimodal hub location and hub network
design", Omega, vol. 40, no. 6, pp. 927-939, 2012.
[5] T. Wang, B. Zhang, Z. Yao and H. Mouftah, "Network coding based adaptive CSMA for
network utility maximization", Computer Networks, vol. 126, pp. 31-43, 2017.
[6] M. Löblich and S. Pfaff-Rüdiger, "Network analysis", International Communication Gazette,
vol. 73, no. 7, pp. 630-647, 2011.
[7] P. Gonçalves, J. Oliveira and R. Aguiar, "A study of encoding overhead in network
management protocols", International Journal of Network Management, vol. 22, no. 6, pp. 435-
450, 2012.
[8] H. Singh, "Comparison of CSMA Based MAC Protocols of Wireless Sensor
Networks", International Journal on AdHoc Networking Systems, vol. 2, no. 2, pp. 11-20, 2012.
8
1 out of 11
Related Documents


Your All-in-One AI-Powered Toolkit for Academic Success.
+13062052269
info@desklib.com
Available 24*7 on WhatsApp / Email
![[object Object]](/_next/static/media/star-bottom.7253800d.svg)
Unlock your academic potential
Copyright © 2020–2026 A2Z Services. All Rights Reserved. Developed and managed by ZUCOL.