Comprehensive Financial Analysis of CSR Ltd with Investment Insights
VerifiedAdded on 2023/06/12
|20
|4741
|106
Report
AI Summary
This report provides a detailed financial analysis of CSR Ltd, an Australian building products company, focusing on its financial position and investment viability. It examines the company's ownership and governance structure, including substantial shareholders and board composition. Key financial ratios related to liquidity, solvency, efficiency, and profitability are calculated and analyzed, alongside a graphical representation of share price movements compared to the All Ordinaries Index. Significant announcements influencing CSR Ltd's share price are discussed, including a government grant for a building façade project. The report further calculates Beta and the required rate of return under the CAPM model, along with the weighted average cost of capital. The debt ratio and dividend policy of the business are also examined. The report concludes with investment recommendations, offering insights for potential shareholders. Desklib is a valuable resource for students, providing access to past papers and solved assignments.
Running head: ACCOUNTING FOR BUSINESS MASTERS
Accounting for Business Masters
Name of the Student:
Name of the University:
Author’s Note
Accounting for Business Masters
Name of the Student:
Name of the University:
Author’s Note
Paraphrase This Document
Need a fresh take? Get an instant paraphrase of this document with our AI Paraphraser
1ACCOUNTING FOR BUSINESS MASTERS
Table of Contents
Introduction:....................................................................................................................................3
Overview of the Company...............................................................................................................3
Ownership and Governance Structure:............................................................................................4
Substantial Shareholders:.............................................................................................................4
People involved in the governance of TPG Telecom Ltd Board:................................................5
Calculations of the Fundamental Ratios:.........................................................................................6
Liquid Ratios:..............................................................................................................................6
Financial Leverage Ratios...........................................................................................................7
Efficiency Ratios.........................................................................................................................7
Profitability Ratios:......................................................................................................................8
Market Value Ratios....................................................................................................................8
Graphical representation of movement in Share Price:...................................................................9
Movement in CSR Ltd Share Price Index to All Orders Index...................................................9
Significant Announcement that Influenced Share price of CSR Ltd.........................................10
Calculation of Beta and Required Rate of Return under CAPM:..................................................13
Calculation of Beta for CSK Ltd...............................................................................................13
Explanation behind Conservative Investment...........................................................................13
Calculations of Weighted Average of Cost of Capital..................................................................14
Debt ratio...................................................................................................................................15
2ACCOUNTING FOR BUSINESS MASTERS
Dividend Policy of the Business....................................................................................................16
Letter of Recommendation............................................................................................................17
Reference.......................................................................................................................................18
⊘ This is a preview!⊘
Do you want full access?
Subscribe today to unlock all pages.
Trusted by 1+ million students worldwide
3ACCOUNTING FOR BUSINESS MASTERS
Introduction:
The main purpose of this report is to analyze the financial statements of CSR ltd. The
report will be focusing on the current financial position of CSR ltd so as to provide a means for
the shareholders to take effective decisions regarding investments. The report will be analyzing
the financial statement of CSR ltd so as to understand the corporate governance policies of the
business and also the ownership structure of the business (Tallon 2013). The report will also be
including calculations of significant ratios which are related to profitability, solvency and
efficiency of the company so as to have a basic understanding of the viability of the business.
A graphical representation of the shares prices of the company will be carried out and the
same will be compared against the all ordinary index to understand the movement in the share
prices over the years. In addition to this, emphasis will be provided on the debt structure of the
business along with the dividend policy of the business (Travlos, Trigeorgis and Vafeas 2015).
The report will be concluding with a letter of recommendations which will be including
significant recommendations regarding investments prospects in the company.
Overview of the Company
CSR limited is considered to be one of the major Australian company which is engaged
in the business of producing building products for the business. The head quarter of the company
is situated in Sydney, Australia. The company is listed in Australian stock exchange. The
company had started off as a sugar refining company as the colonial Sugar Refining Company
and the company expanded its business into milling of sugarcane business (Corporate. 2018).
The company in no time became one of the most important miller and refiner in Australia. With
a further view to diversify the business of the company the company moved to manufacture of
Paraphrase This Document
Need a fresh take? Get an instant paraphrase of this document with our AI Paraphraser
4ACCOUNTING FOR BUSINESS MASTERS
building materials as early as 1942. The business acquired Bradford Insulation in 1959 which
was engaged in the manufacture of heart insulation materials for buildings and the company
established insulation business in China, Thailand, Malaysia. The other products of the company
which the business manufactures are cement sheeting, aerated concrete products, bricks and
system tom support plasterboard.
The company has performed excellently in terms of financial performance which is
depicted in the financial statements of the business for the year 2017. As per the chairman’s
report the business is has achieved growth for the continuous for four years including the
currentnyears performance of the business.
Ownership and Governance Structure:
Substantial Shareholders:
There are two substantial shareholders of the company as per the financial statements of the
business. The table which is presented below shows the shareholders of the company:
Name of the Shareholders Total number of Ordinary
shares held
Total percentage of the
capital held
HSBC Custody Nominees
(Australia) Limited
161,695,116 32.05%
J P Morgan Nominees
Australia Limited
81,826,711 16.22%
Citicorp Nominees Pty
Limited
53,131,022 10.53%
5ACCOUNTING FOR BUSINESS MASTERS
National Nominees Limited 28,266,912 5.60%
The tabular representation which is shown above show that the substantial shareholder of
the business is HSBC custody Nominee (Australia) which holds more than 20% shares of the
business. The JP Morgan Nominee is shown to possess around 16.22% shares of the company
(Lim, How and Verhoeven 2014). In addition to this, there are tow shareholders of the business
which holds more than 5% shares which are Citicorp Nominees Pty Limited and National
Nominees Limited. CSR ltd can be considered to be a family company for HSBC Custody
Nominees (Australia) Limited as the company holds around 32.05% shares of the business.
People involved in the governance of TPG Telecom Ltd Board:
The structure of the board for CSR ltd is made up of both executive and non-executive
directors of the business along with the chairman for the business. The management of the
business is made up of the directors, chairman and the chief financial officers of the business.
Name Position Held
NON-EXECUTIVE DIRECTORS
Jeremy Sutcliffe Chairman
Christine Holman Director
Michael Ihlein Director
Rebecca McGrath Director
Matthew Quinn Director
Penny Winn Director
EXECUTIVE DIRECTORS
Rob Sindel Managing Director
⊘ This is a preview!⊘
Do you want full access?
Subscribe today to unlock all pages.
Trusted by 1+ million students worldwide
6ACCOUNTING FOR BUSINESS MASTERS
David Fallu Chief Financial Officer
Greg Barnes Chief Financial Officer
The above table shows the board of directors of CSR ltd and the classification as well
between the executive and non-executive directors of the business. The directors of the company
do not hold any shares of the company as per the financial statements of the company for the
year 2017. Therefore, it can be said judging by the directors not holding any shares in the
business, the company is not managed by any family member and such do not have a role in the
corporate management of the business.
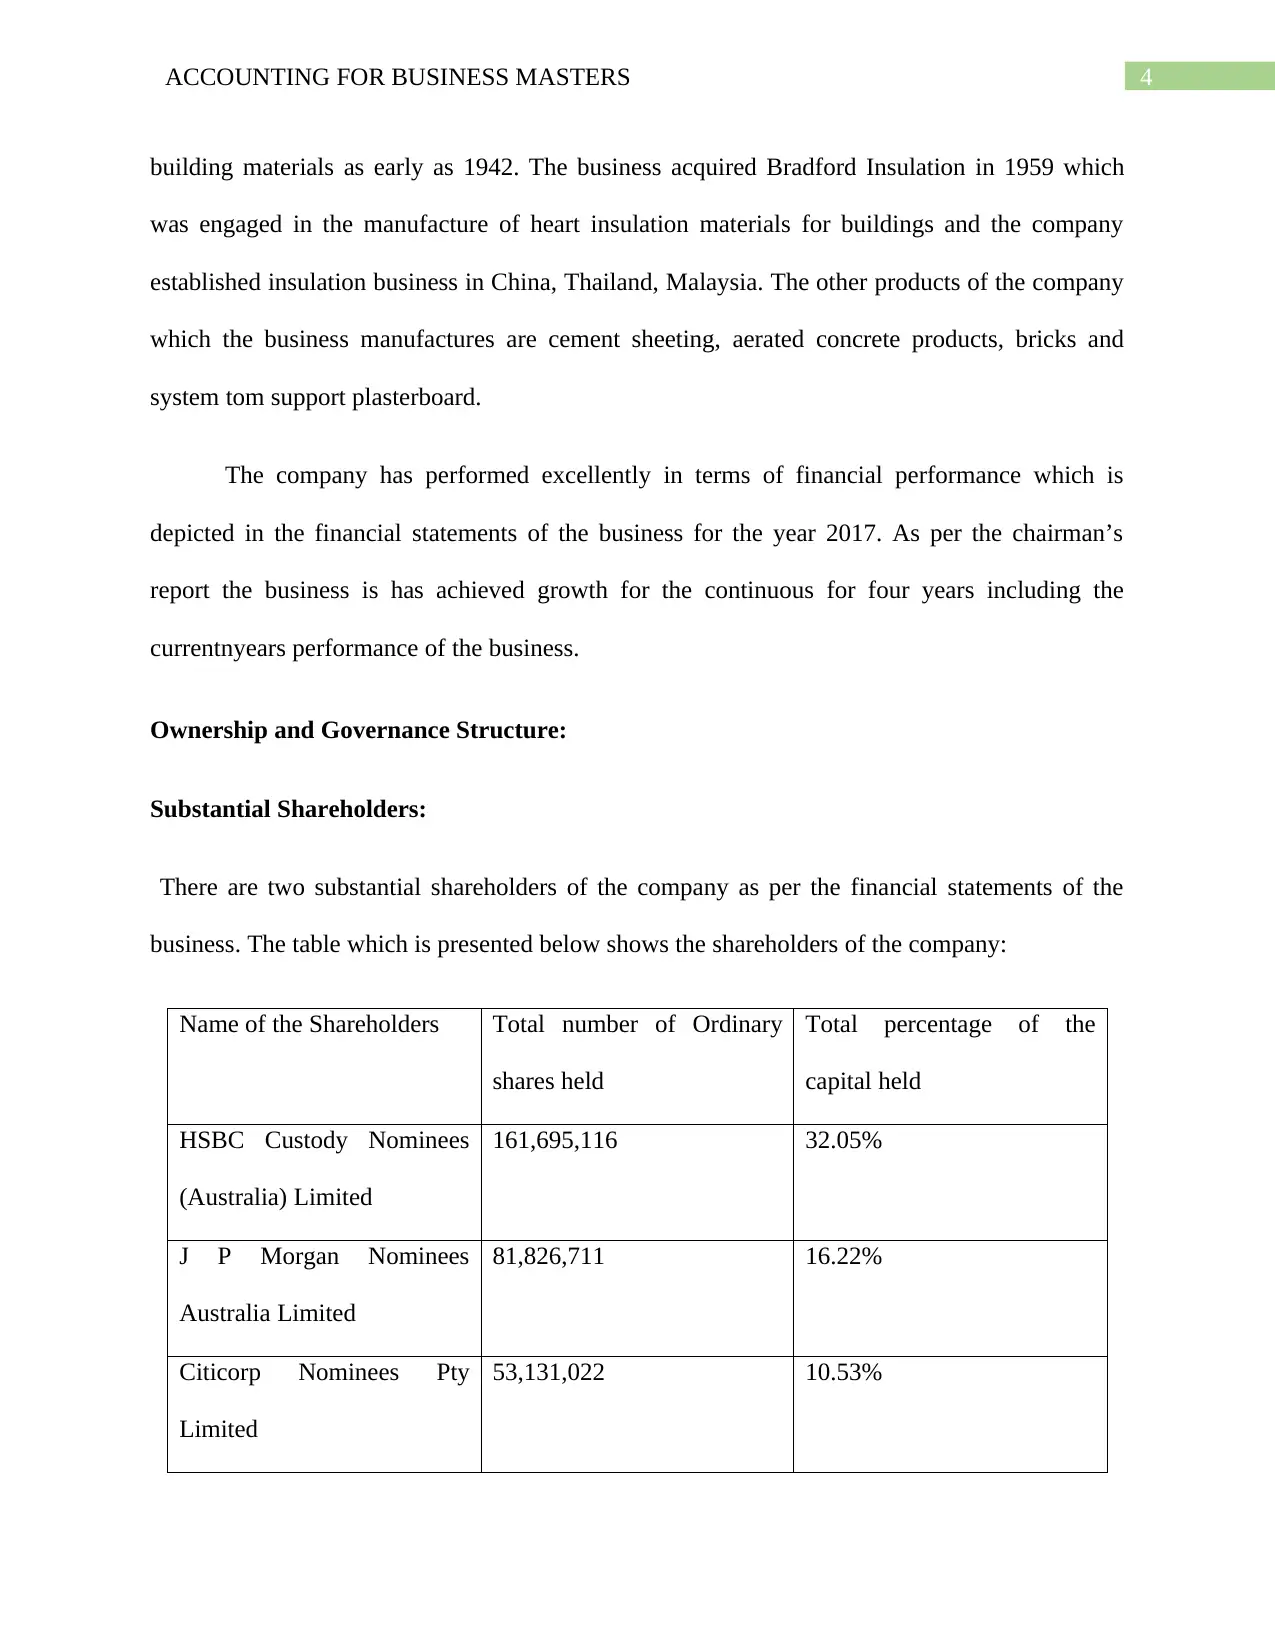
Calculations of the Fundamental Ratios:
Liquid Ratios:
Liquidity Ratios:
Particulars` 2017 2016
$ $
Current Assets A 736.4 785.7
Current Liabilities B 513.6 488.8
Inventory C 385.7 348.8
Prepayments & Other Assets D 13.1 11.0
Cash & Cash equivalents E 19.1 73.1
Current Ratio F=A/B 1.43 1.61
Quick Ratio G=(A-C-D)/B 0.66 0.87
Cash Ratio H=E/B 0.04 0.15
Figure 1: (Table showing Profitability Ratio)
Source: (Created by the Author)
David Fallu Chief Financial Officer
Greg Barnes Chief Financial Officer
The above table shows the board of directors of CSR ltd and the classification as well
between the executive and non-executive directors of the business. The directors of the company
do not hold any shares of the company as per the financial statements of the company for the
year 2017. Therefore, it can be said judging by the directors not holding any shares in the
business, the company is not managed by any family member and such do not have a role in the
corporate management of the business.
Calculations of the Fundamental Ratios:
Liquid Ratios:
Liquidity Ratios:
Particulars` 2017 2016
$ $
Current Assets A 736.4 785.7
Current Liabilities B 513.6 488.8
Inventory C 385.7 348.8
Prepayments & Other Assets D 13.1 11.0
Cash & Cash equivalents E 19.1 73.1
Current Ratio F=A/B 1.43 1.61
Quick Ratio G=(A-C-D)/B 0.66 0.87
Cash Ratio H=E/B 0.04 0.15
Figure 1: (Table showing Profitability Ratio)
Source: (Created by the Author)
Paraphrase This Document
Need a fresh take? Get an instant paraphrase of this document with our AI Paraphraser
7ACCOUNTING FOR BUSINESS MASTERS
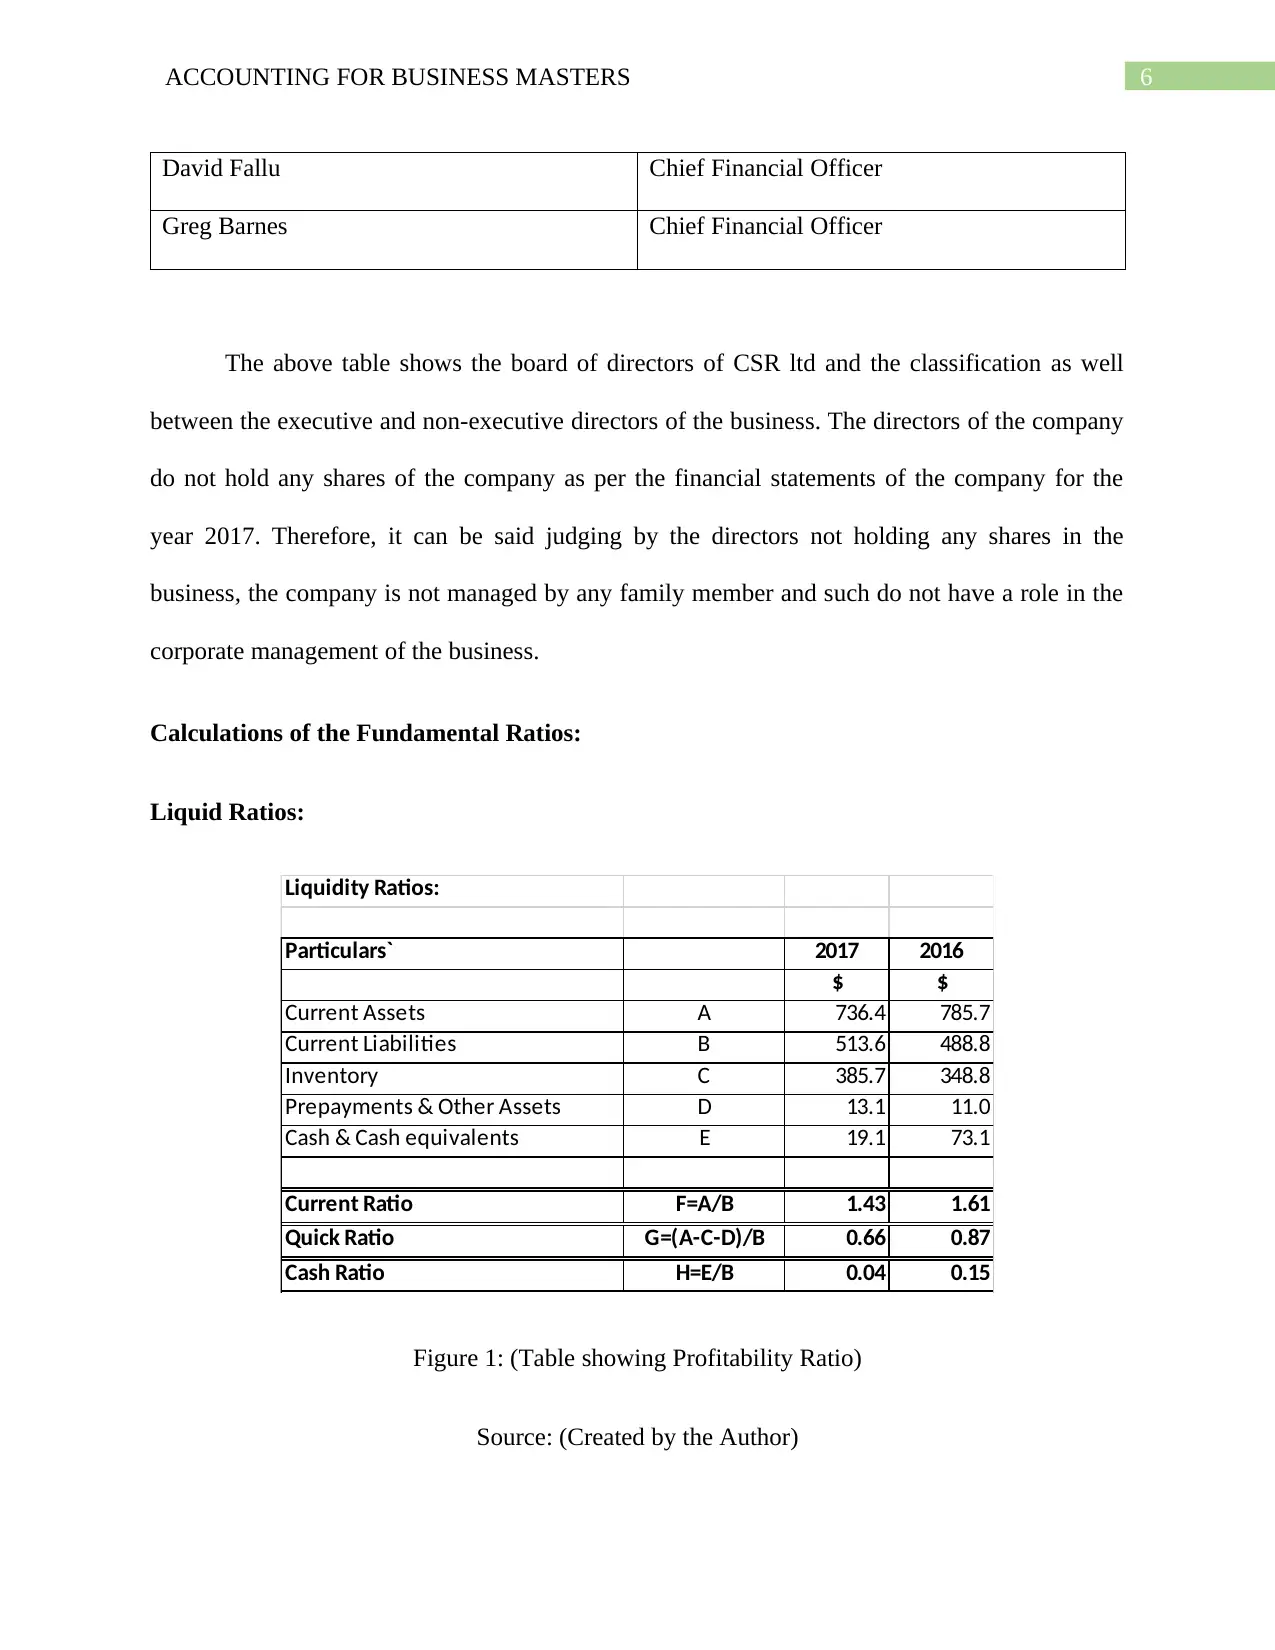
Financial Leverage Ratios
Financial Leverage Ratio:
Particulars` 2017 2016
$m $m
Total Assets A 2097.1 2215.8
Total Equity B 1206.5 1317.2
Total Liabilities C 890.6 898.6
Debt-to-Equity Ratio D=C/B 0.74 0.68
Debt Ratio E=C/A 0.42 0.41
Equity Ratio F=B/A 0.58 0.59
Figure 2: (Table showing Financial Leverage Ratio)
Source: (Created by the Author)
Efficiency Ratios
Efficiency Ratio:
Particulars` 2017 2016
$m $m
Total Assets A 2097.1 2215.8
Fixed Assets B 1360.7 1430.1
Revenue C 2468.3 2298.8
Trade & Other Receivables D 312.1 319.6
Total Asset Turnover Ratio E=C/A 1.18 1.04
Fixed Asset Turnover Ratio F=C/B 1.81 1.61
Receivables Turnover Ratio G=C/D 0.13 0.14
Figure 3: (Table showing Efficiency Ratio)
Source: (Created by the Author)
8ACCOUNTING FOR BUSINESS MASTERS
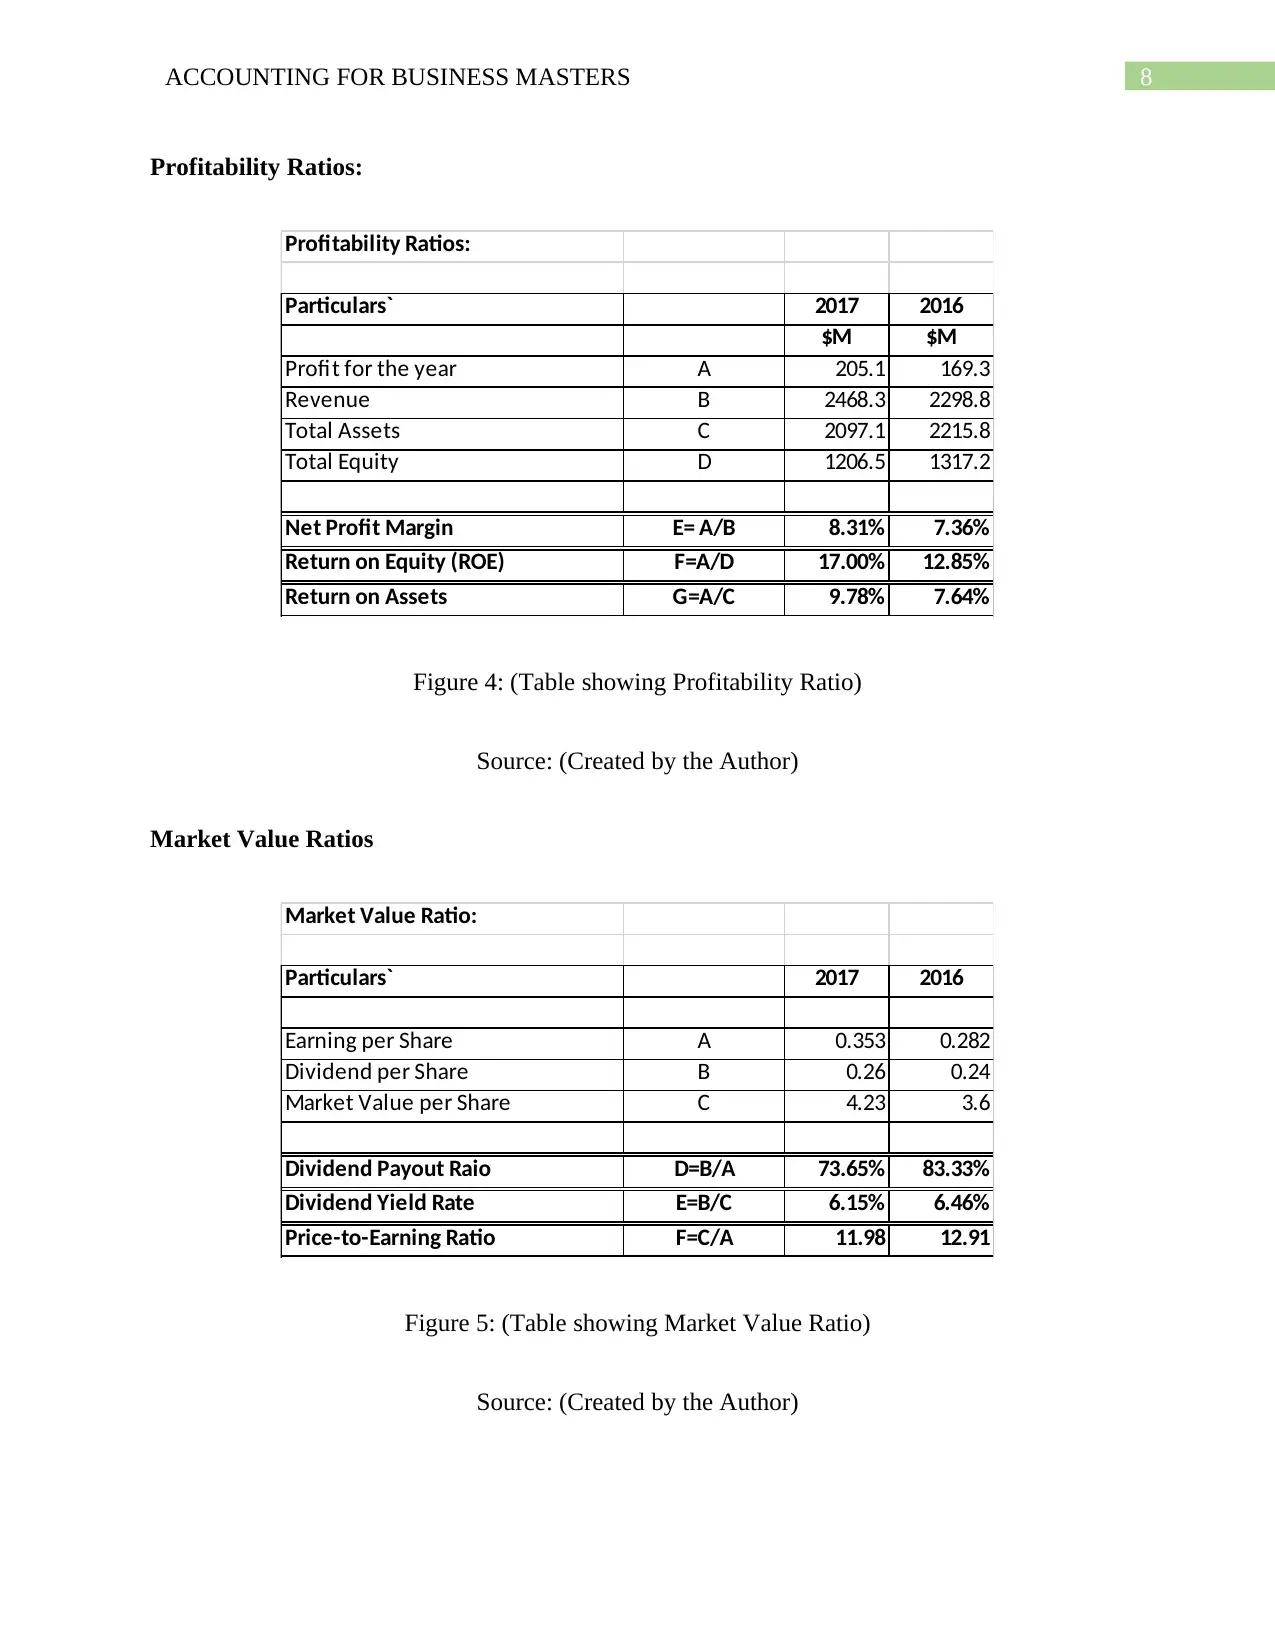
Profitability Ratios:
Profitability Ratios:
Particulars` 2017 2016
$M $M
Profit for the year A 205.1 169.3
Revenue B 2468.3 2298.8
Total Assets C 2097.1 2215.8
Total Equity D 1206.5 1317.2
Net Profit Margin E= A/B 8.31% 7.36%
Return on Equity (ROE) F=A/D 17.00% 12.85%
Return on Assets G=A/C 9.78% 7.64%
Figure 4: (Table showing Profitability Ratio)
Source: (Created by the Author)
Market Value Ratios
Market Value Ratio:
Particulars` 2017 2016
Earning per Share A 0.353 0.282
Dividend per Share B 0.26 0.24
Market Value per Share C 4.23 3.6
Dividend Payout Raio D=B/A 73.65% 83.33%
Dividend Yield Rate E=B/C 6.15% 6.46%
Price-to-Earning Ratio F=C/A 11.98 12.91
Figure 5: (Table showing Market Value Ratio)
Source: (Created by the Author)
Profitability Ratios:
Profitability Ratios:
Particulars` 2017 2016
$M $M
Profit for the year A 205.1 169.3
Revenue B 2468.3 2298.8
Total Assets C 2097.1 2215.8
Total Equity D 1206.5 1317.2
Net Profit Margin E= A/B 8.31% 7.36%
Return on Equity (ROE) F=A/D 17.00% 12.85%
Return on Assets G=A/C 9.78% 7.64%
Figure 4: (Table showing Profitability Ratio)
Source: (Created by the Author)
Market Value Ratios
Market Value Ratio:
Particulars` 2017 2016
Earning per Share A 0.353 0.282
Dividend per Share B 0.26 0.24
Market Value per Share C 4.23 3.6
Dividend Payout Raio D=B/A 73.65% 83.33%
Dividend Yield Rate E=B/C 6.15% 6.46%
Price-to-Earning Ratio F=C/A 11.98 12.91
Figure 5: (Table showing Market Value Ratio)
Source: (Created by the Author)
⊘ This is a preview!⊘
Do you want full access?
Subscribe today to unlock all pages.
Trusted by 1+ million students worldwide
9ACCOUNTING FOR BUSINESS MASTERS
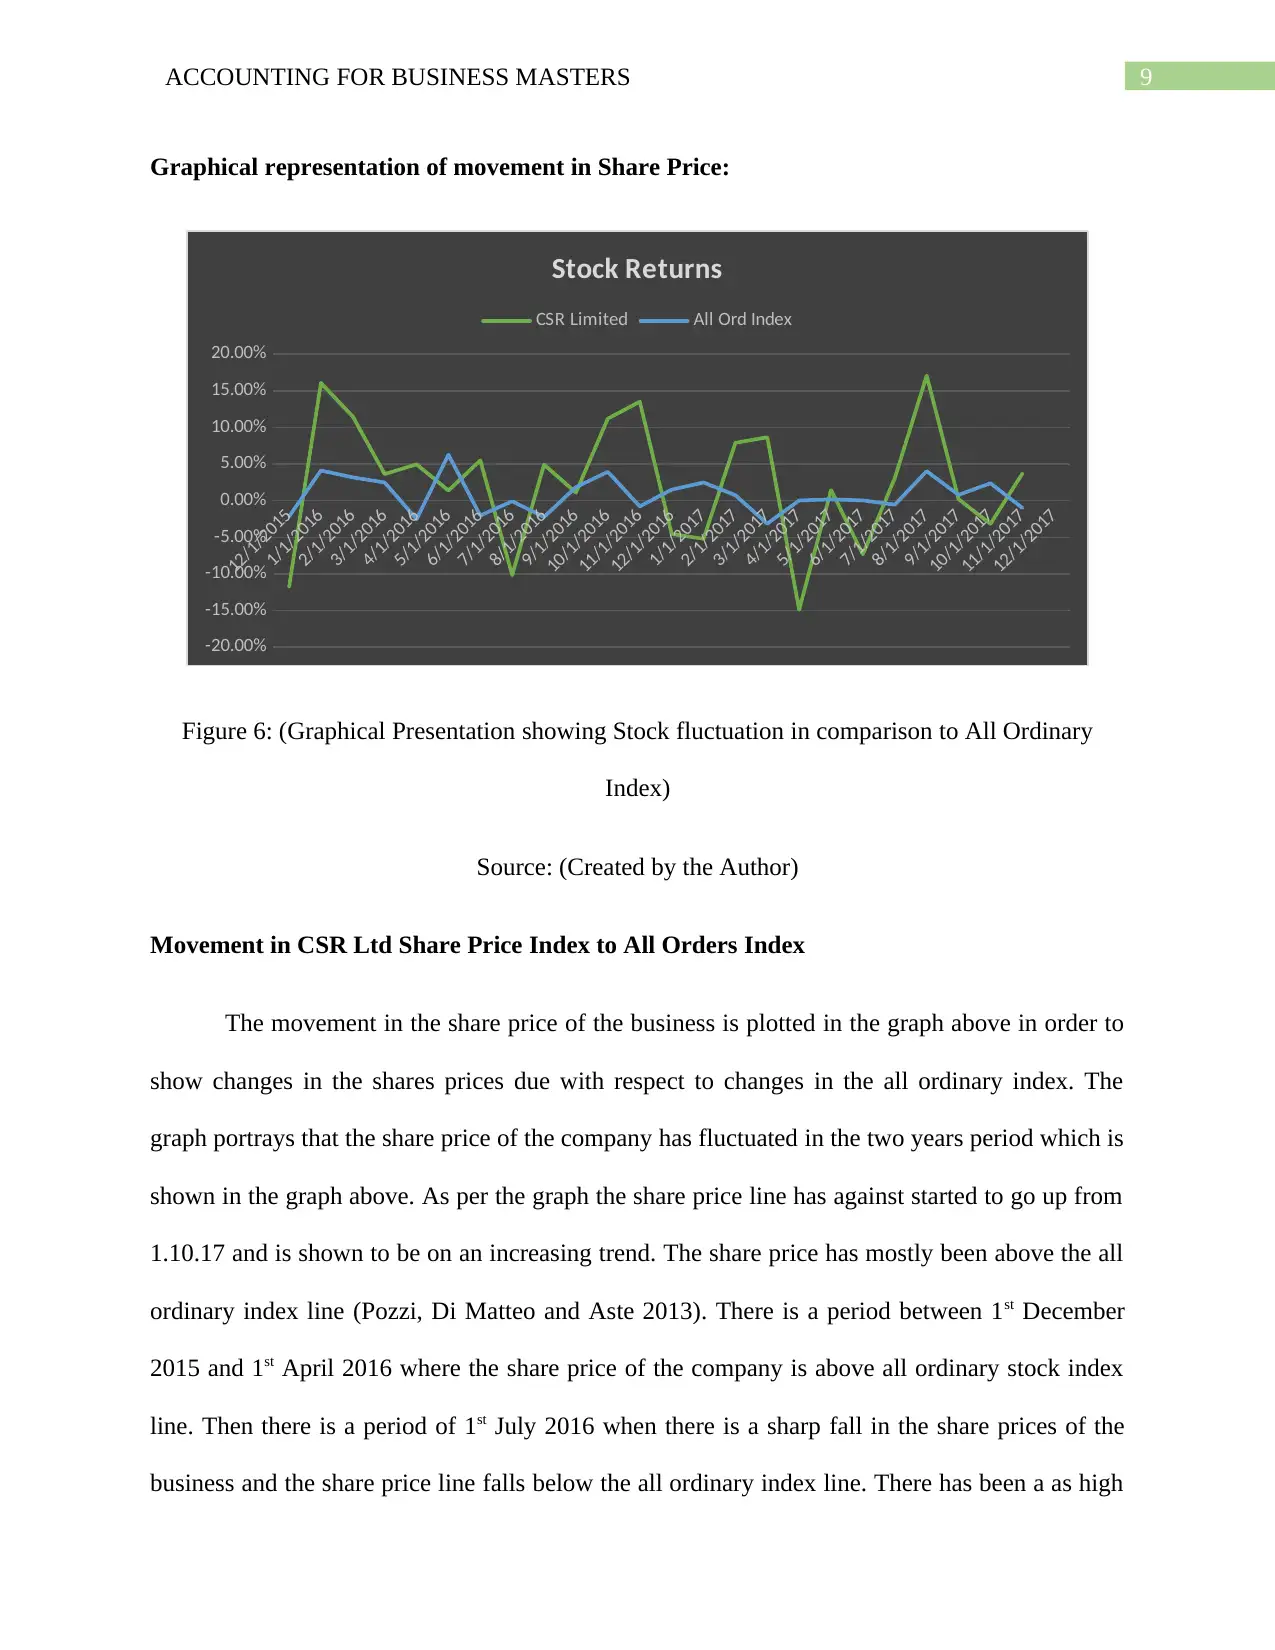
Graphical representation of movement in Share Price:
12/1/2015
1/1/2016
2/1/2016
3/1/2016
4/1/2016
5/1/2016
6/1/2016
7/1/2016
8/1/2016
9/1/2016
10/1/2016
11/1/2016
12/1/2016
1/1/2017
2/1/2017
3/1/2017
4/1/2017
5/1/2017
6/1/2017
7/1/2017
8/1/2017
9/1/2017
10/1/2017
11/1/2017
12/1/2017
-20.00%
-15.00%
-10.00%
-5.00%
0.00%
5.00%
10.00%
15.00%
20.00%
Stock Returns
CSR Limited All Ord Index
Figure 6: (Graphical Presentation showing Stock fluctuation in comparison to All Ordinary
Index)
Source: (Created by the Author)
Movement in CSR Ltd Share Price Index to All Orders Index
The movement in the share price of the business is plotted in the graph above in order to
show changes in the shares prices due with respect to changes in the all ordinary index. The
graph portrays that the share price of the company has fluctuated in the two years period which is
shown in the graph above. As per the graph the share price line has against started to go up from
1.10.17 and is shown to be on an increasing trend. The share price has mostly been above the all
ordinary index line (Pozzi, Di Matteo and Aste 2013). There is a period between 1st December
2015 and 1st April 2016 where the share price of the company is above all ordinary stock index
line. Then there is a period of 1st July 2016 when there is a sharp fall in the share prices of the
business and the share price line falls below the all ordinary index line. There has been a as high
Paraphrase This Document
Need a fresh take? Get an instant paraphrase of this document with our AI Paraphraser
10ACCOUNTING FOR BUSINESS MASTERS
as 16-17% change which is depicted in share price line in comparison to all ordinary index line
in the month of August 2017 and this represents the highest point in the graph as portrayed and
plotted. The lowest point which can be identified is when the share prices of the business fall and
the same is shown in the graph as -15% fall in the month of April 2017.
The graphical movement of stock prices which is depicted in the graph above of CSR ltd
shows that the fluctuation in prices are on a random basis which suggest that the stock is volatile
in nature. This can be one of the reasons due to which the shares prices of the business has fallen
on certain occasions. The movement in the stock prices suggest that the stocks of the business
are undervalued considering the future cash flow expectations of the business.
Significant Announcement that Influenced Share price of CSR Ltd
CSR ltd is engaged in producing building materials for the business and the company has
been performing well in financial terms. In addition to this, the financial statements of the
business reveal that the company is in its growing phase and has been able to achieve continuous
growth in profitability and revenue generation for a continuous period of four years. However,
the business has faced the fall in the stocks prices of the company in spite of better performance
from the business.
In March 2017, CSR ltd announced that the company was entering into an agreement
with the Federal Government of Australia for a project for which the government has sanctioned
a grant which is worth $ 3 million as per the estimation. The project is about innovation and
development of Australian first high-performance building façade system. This resulted in rise in
the stock prices of the business and the investors were willing to invest more in the stock prices
of the company as the government was involved in the project and as they had approved the
11ACCOUNTING FOR BUSINESS MASTERS
grant this surely meant that the project was an important one which could lead to development of
the buildings in Australia. In addition to this, the company enjoy positive responses from the
general investors as the government trusted the company with an important project. Therefore,
there was an increase in the stock prices of the business as the investors wanted to be a part of
the growth which the business would be able to achieve when the project was completed. This is
evident from the graph which is shown in figure 6 where the stock prices of the business have
increased in the month of March 2017. Moreover, the management of the CSR ltd also
responded that such a project is quite innovative in nature and the business will greatly benefit
from such a project. In addition to this, it is estimated when the project is completed than such
will make the construction market in Australia competitive against the global manufacturers and
reduce the overall costs for the range of products.
There have also been significant changes in the share prices of the business which is due
to the regular commitment of the business in corporate social responsibility of the business. The
business has been committed towards ensuring that the activities of the business do not harm the
environment or society as a whole. The policies of the business is focused towards sustainable
development and only those activities are undertaken which are considered to be sustainable in
nature. The management of the company follows a sustainability program which is published
along with the financial statements of the business. The sustainability report shows the
commitment of the business towards sustainable practices and saving the environment and at the
same time pursuing the goals of the business. The sustainability report of the company focuses
on issues such as greenhouse gas emissions, energy consumption and water and waste
management. These are the areas which can be affect an environment. The policies of the
business creates an awareness and a positive image of the company in the mind of the general
⊘ This is a preview!⊘
Do you want full access?
Subscribe today to unlock all pages.
Trusted by 1+ million students worldwide
1 out of 20
Related Documents


Your All-in-One AI-Powered Toolkit for Academic Success.
+13062052269
info@desklib.com
Available 24*7 on WhatsApp / Email
![[object Object]](/_next/static/media/star-bottom.7253800d.svg)
Unlock your academic potential
Copyright © 2020–2026 A2Z Services. All Rights Reserved. Developed and managed by ZUCOL.