Charlie's Toys and Equipment Limited Financial Statement Analysis
VerifiedAdded on 2021/05/30
|18
|4255
|131
Report
AI Summary
This report presents a detailed analysis of the financial statements of Charlie’s Toys and Equipment Limited for the year ended March 31, 2017. The analysis includes the Statement of Profit or Loss and Other Comprehensive Income, Statement of Changes in Equity, Statement of Financial Position, and Statement of Cash Flow, along with the notes to the financial statements. The report covers key financial metrics, including sales, cost of sales, gross profit, operating profit, and profit for the year, as well as the company's assets, liabilities, and equity. It also includes ratio calculations and analysis, such as current ratio, debt-to-equity ratio, times interest earned, average receivable collection period, return on equity ratio, price earnings ratio, and dividend yield, providing a comprehensive overview of the company's financial performance and position. The financial statements have been prepared in accordance with Generally Accepted Accounting Practice (GAAP), FMCA 2013 and NZX listing rules, and comply with New Zealand Equivalents to International Financial Reporting Standards (NZ IFRS) and International Financial Reporting Standards (IFRS).
financial statements Charlie’s Toys and Equipment Limited
For the year ended 31 March, 2017
MAY 14, 2018
For the year ended 31 March, 2017
MAY 14, 2018
Paraphrase This Document
Need a fresh take? Get an instant paraphrase of this document with our AI Paraphraser
Contents
Statement of Profit or Loss and Other Comprehensive Income..................................................................2
Statement of Changes in Equity..................................................................................................................3
Statement of Financial Position...................................................................................................................4
Statement of Cash Flow...............................................................................................................................6
Notes to the Financial Statements..............................................................................................................7
1.1 Corporate Information......................................................................................................................7
1.2 Compliance Statement......................................................................................................................7
1.3 Summary of Significant Accounting Policies......................................................................................7
1.4 Correction of an error........................................................................................................................8
Other financial Notes...............................................................................................................................9
Ratio Calculation:.......................................................................................................................................13
Ratio Analysis:...........................................................................................................................................13
Current Ratio.........................................................................................................................................13
Debt to Equity Ratio..............................................................................................................................14
Times Interest earned............................................................................................................................14
Average Receivable collection period....................................................................................................14
Return on equity ratio...........................................................................................................................15
Price earnings ratio................................................................................................................................15
Dividend Yield on ordinary shares.........................................................................................................15
References:................................................................................................................................................16
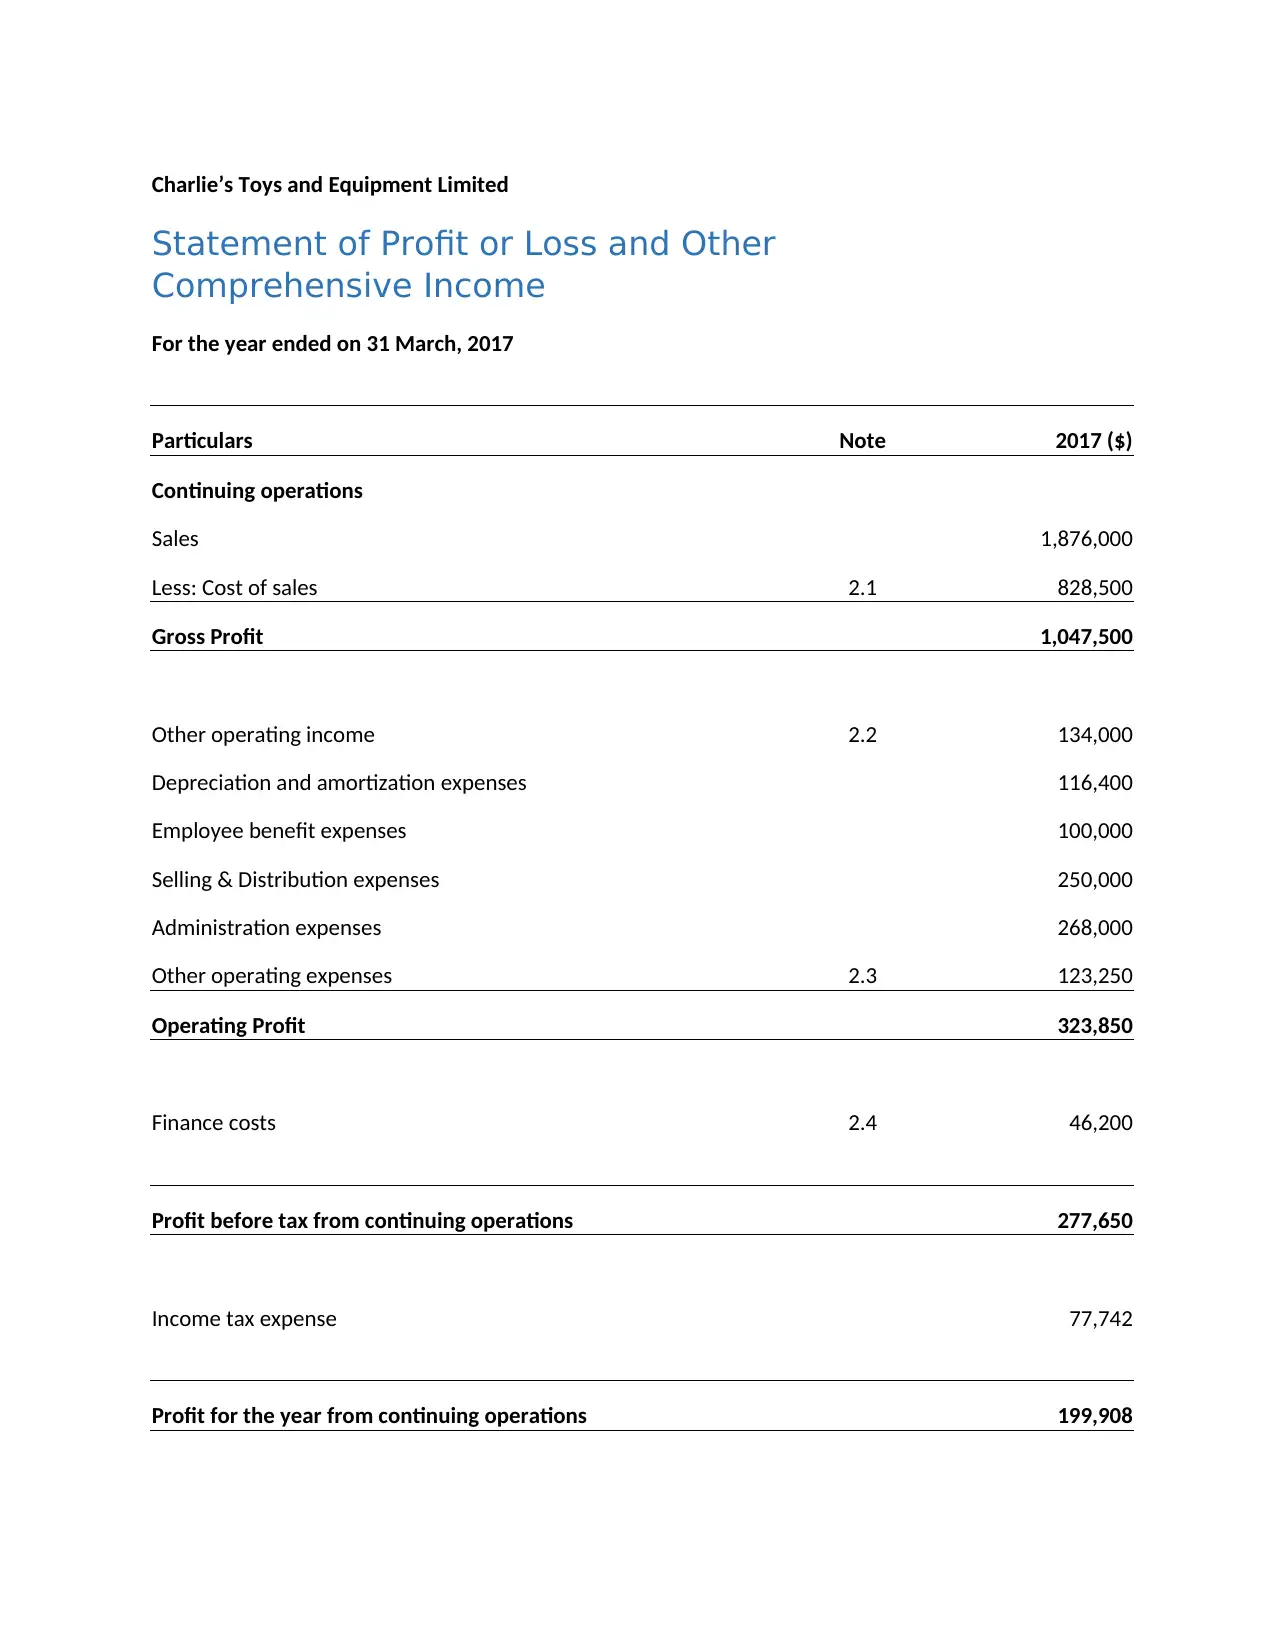
Charlie’s Toys and Equipment Limited
Statement of Profit or Loss and Other
Comprehensive Income
For the year ended on 31 March, 2017
Particulars Note 2017 ($)
Continuing operations
Sales 1,876,000
Less: Cost of sales 2.1 828,500
Gross Profit 1,047,500
Other operating income 2.2 134,000
Depreciation and amortization expenses 116,400
Employee benefit expenses 100,000
Selling & Distribution expenses 250,000
Administration expenses 268,000
Other operating expenses 2.3 123,250
Operating Profit 323,850
Finance costs 2.4 46,200
Profit before tax from continuing operations 277,650
Income tax expense 77,742
Profit for the year from continuing operations 199,908
⊘ This is a preview!⊘
Do you want full access?
Subscribe today to unlock all pages.
Trusted by 1+ million students worldwide
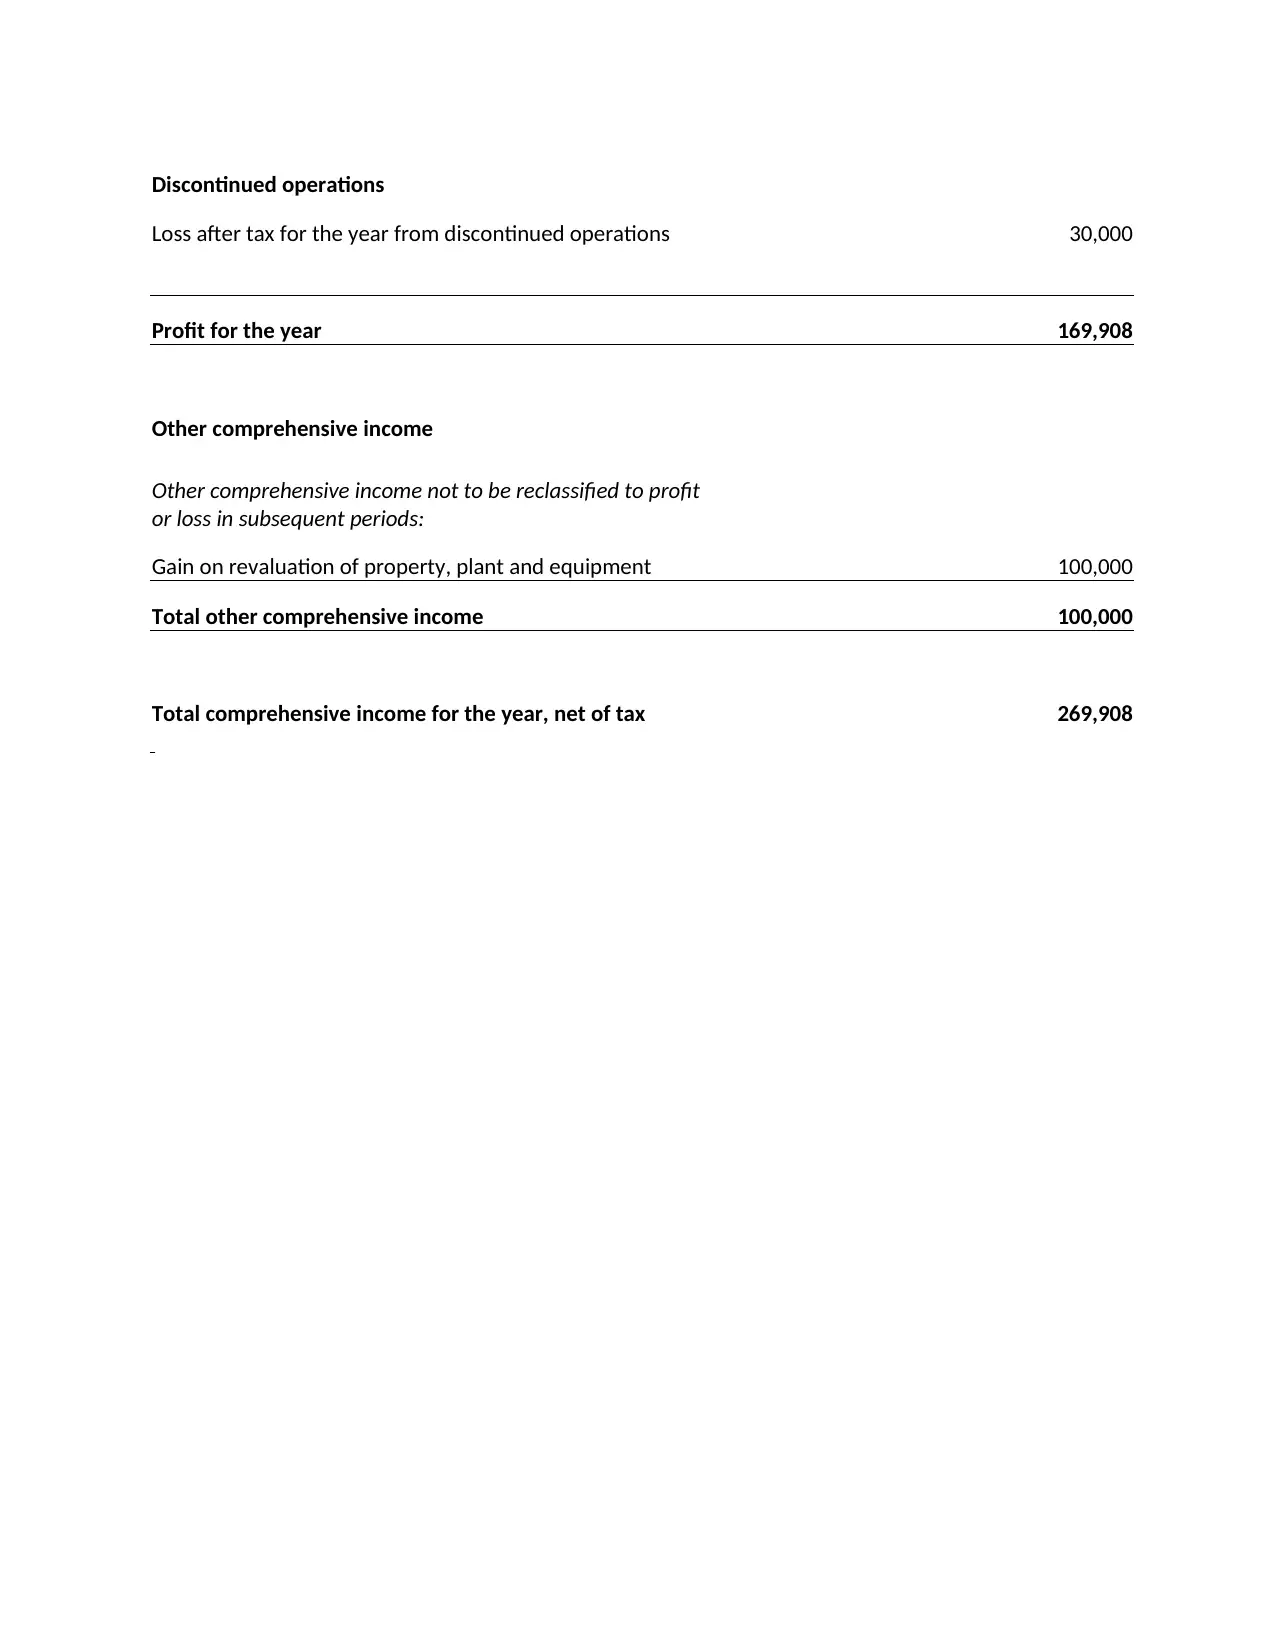
Discontinued operations
Loss after tax for the year from discontinued operations 30,000
Profit for the year 169,908
Other comprehensive income
Other comprehensive income not to be reclassified to profit
or loss in subsequent periods:
Gain on revaluation of property, plant and equipment 100,000
Total other comprehensive income 100,000
Total comprehensive income for the year, net of tax 269,908
Paraphrase This Document
Need a fresh take? Get an instant paraphrase of this document with our AI Paraphraser
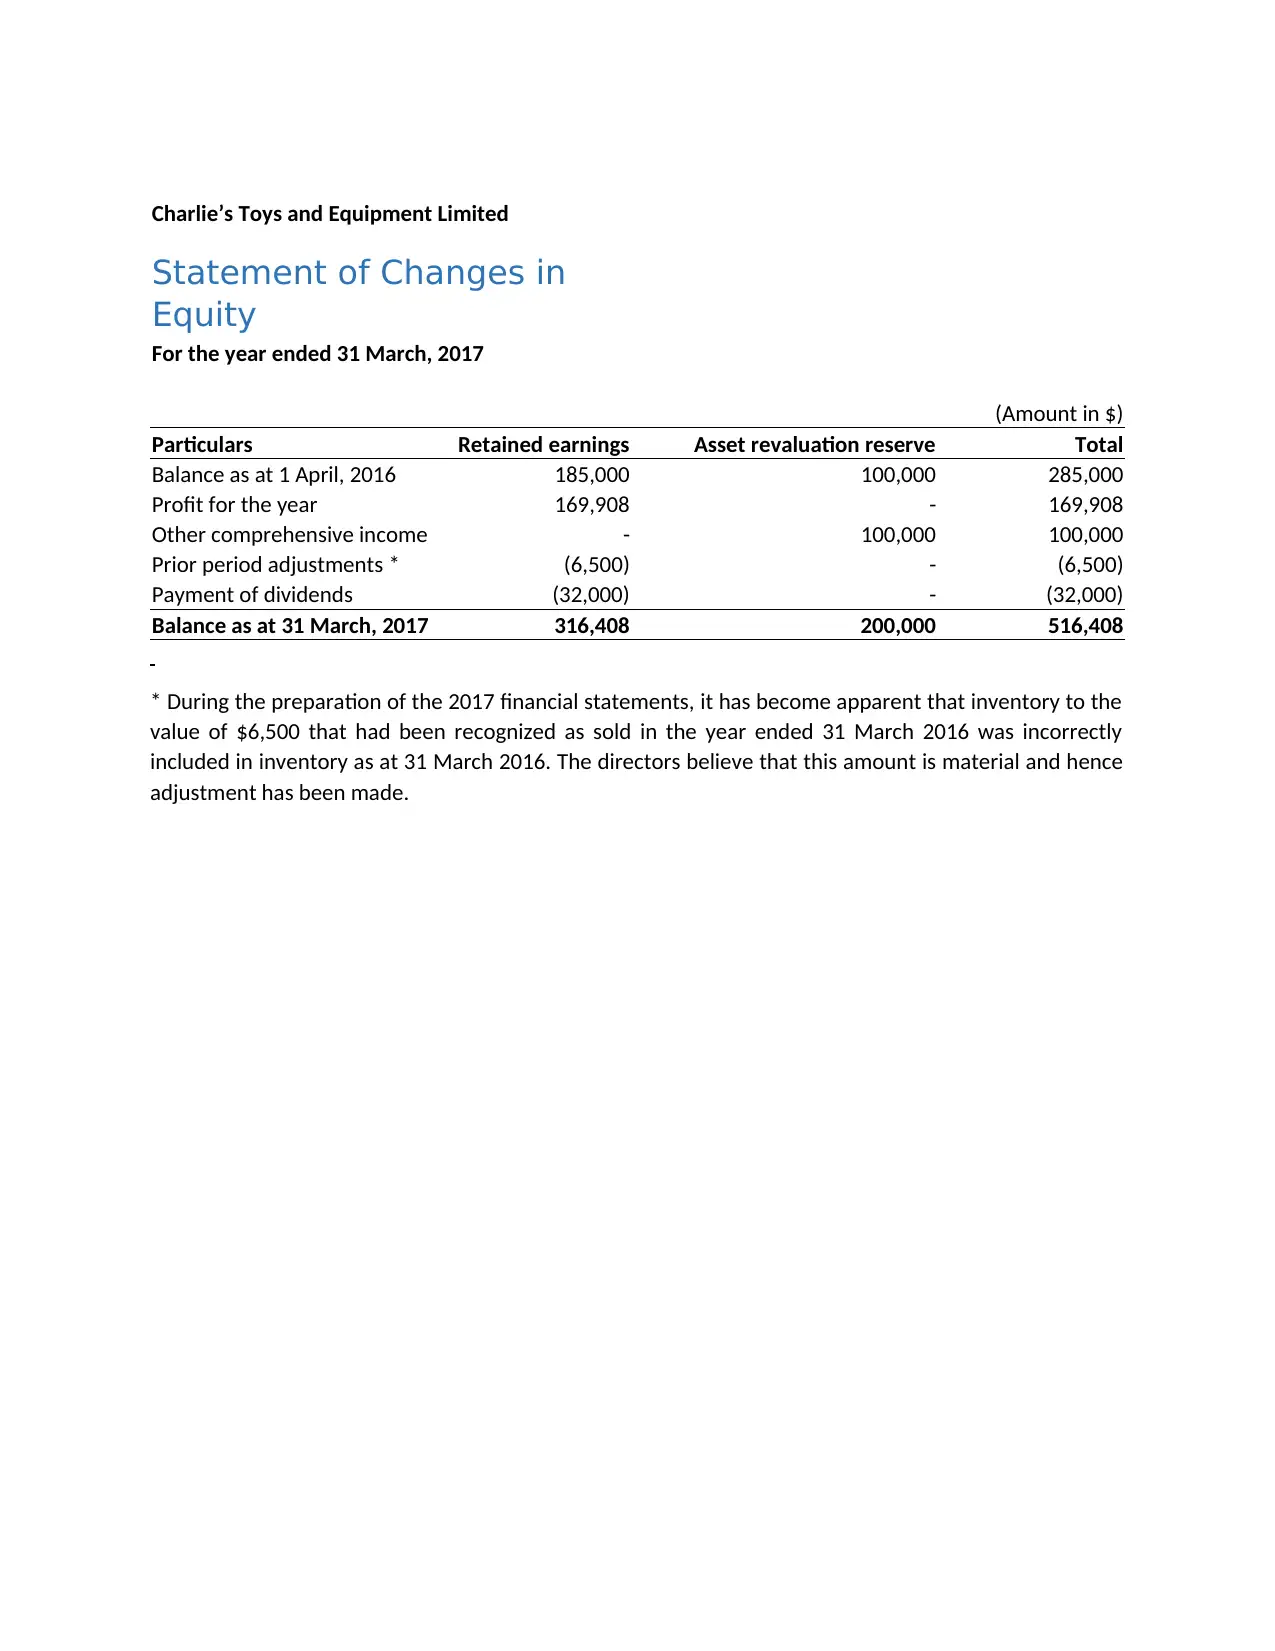
Charlie’s Toys and Equipment Limited
Statement of Changes in
Equity
For the year ended 31 March, 2017
(Amount in $)
Particulars Retained earnings Asset revaluation reserve Total
Balance as at 1 April, 2016 185,000 100,000 285,000
Profit for the year 169,908 - 169,908
Other comprehensive income - 100,000 100,000
Prior period adjustments * (6,500) - (6,500)
Payment of dividends (32,000) - (32,000)
Balance as at 31 March, 2017 316,408 200,000 516,408
* During the preparation of the 2017 financial statements, it has become apparent that inventory to the
value of $6,500 that had been recognized as sold in the year ended 31 March 2016 was incorrectly
included in inventory as at 31 March 2016. The directors believe that this amount is material and hence
adjustment has been made.
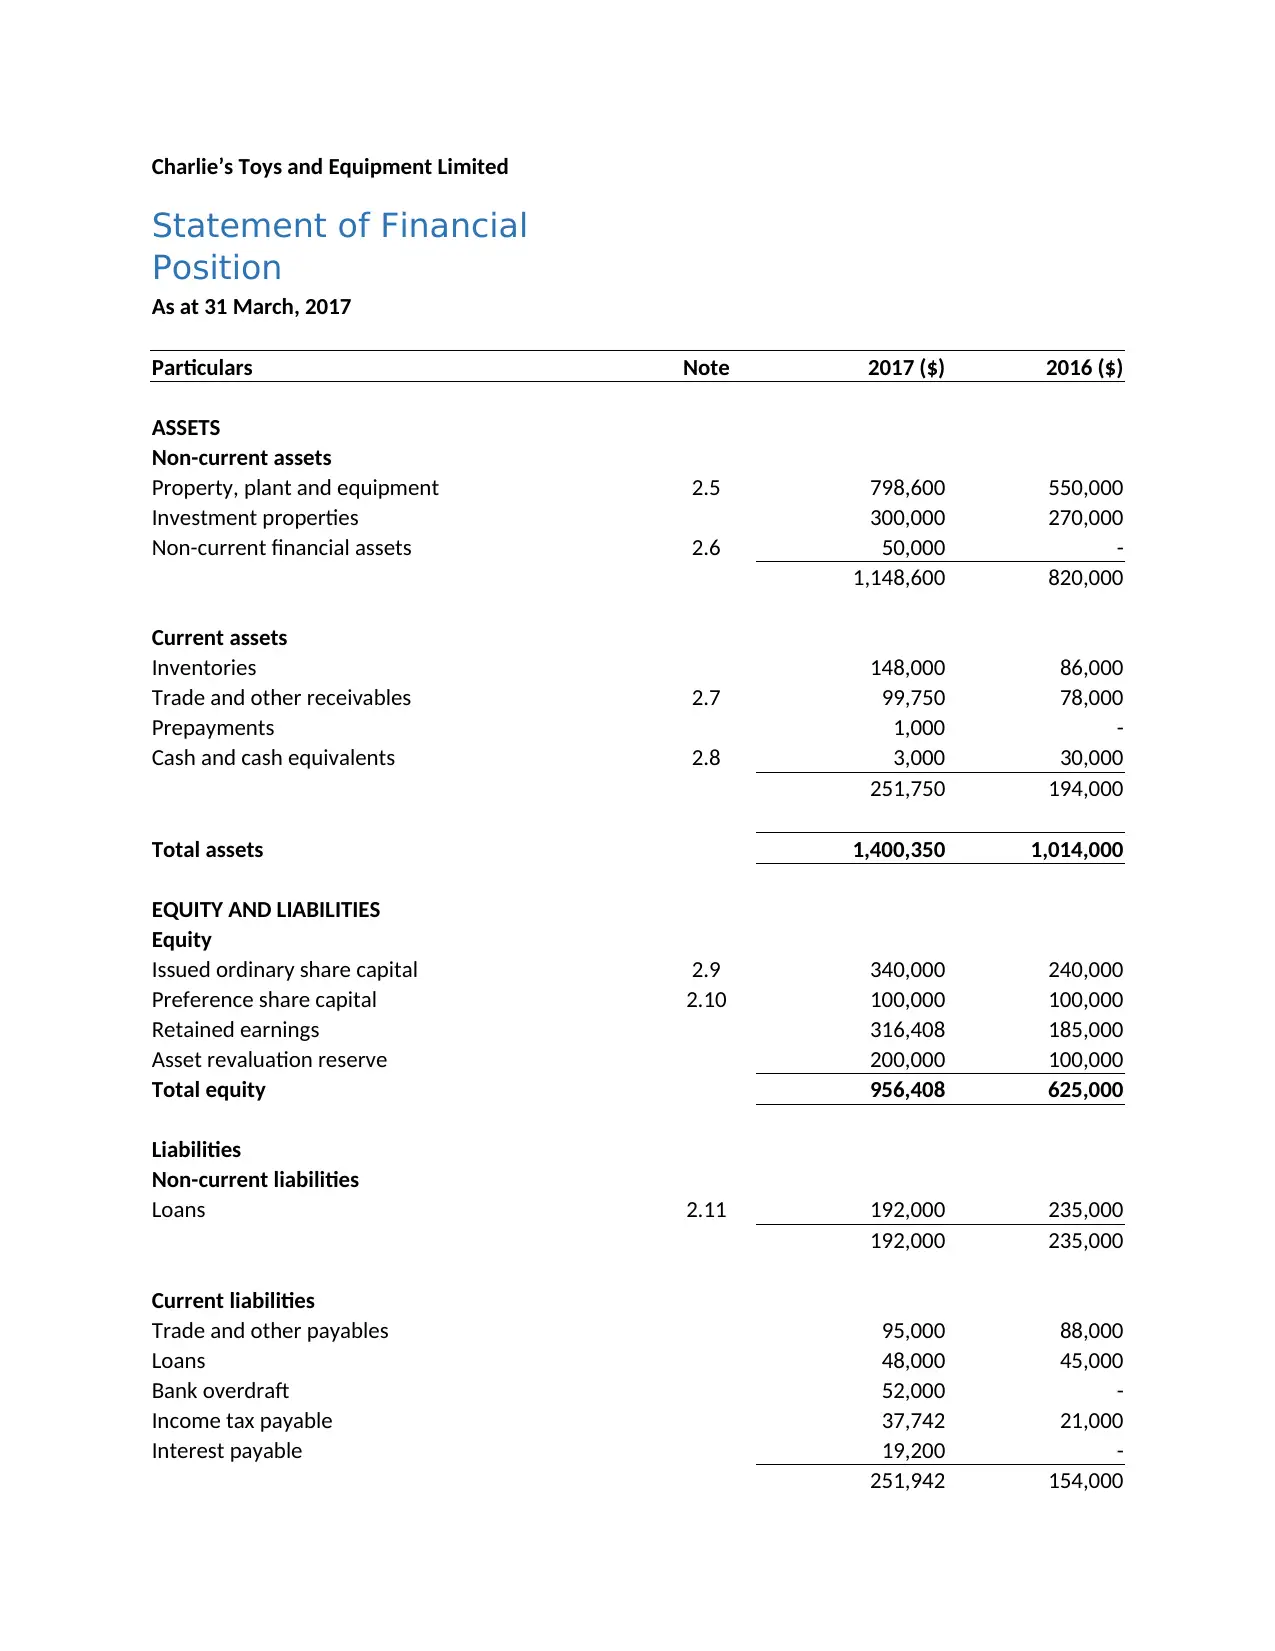
Charlie’s Toys and Equipment Limited
Statement of Financial
Position
As at 31 March, 2017
Particulars Note 2017 ($) 2016 ($)
ASSETS
Non-current assets
Property, plant and equipment 2.5 798,600 550,000
Investment properties 300,000 270,000
Non-current financial assets 2.6 50,000 -
1,148,600 820,000
Current assets
Inventories 148,000 86,000
Trade and other receivables 2.7 99,750 78,000
Prepayments 1,000 -
Cash and cash equivalents 2.8 3,000 30,000
251,750 194,000
Total assets 1,400,350 1,014,000
EQUITY AND LIABILITIES
Equity
Issued ordinary share capital 2.9 340,000 240,000
Preference share capital 2.10 100,000 100,000
Retained earnings 316,408 185,000
Asset revaluation reserve 200,000 100,000
Total equity 956,408 625,000
Liabilities
Non-current liabilities
Loans 2.11 192,000 235,000
192,000 235,000
Current liabilities
Trade and other payables 95,000 88,000
Loans 48,000 45,000
Bank overdraft 52,000 -
Income tax payable 37,742 21,000
Interest payable 19,200 -
251,942 154,000
⊘ This is a preview!⊘
Do you want full access?
Subscribe today to unlock all pages.
Trusted by 1+ million students worldwide
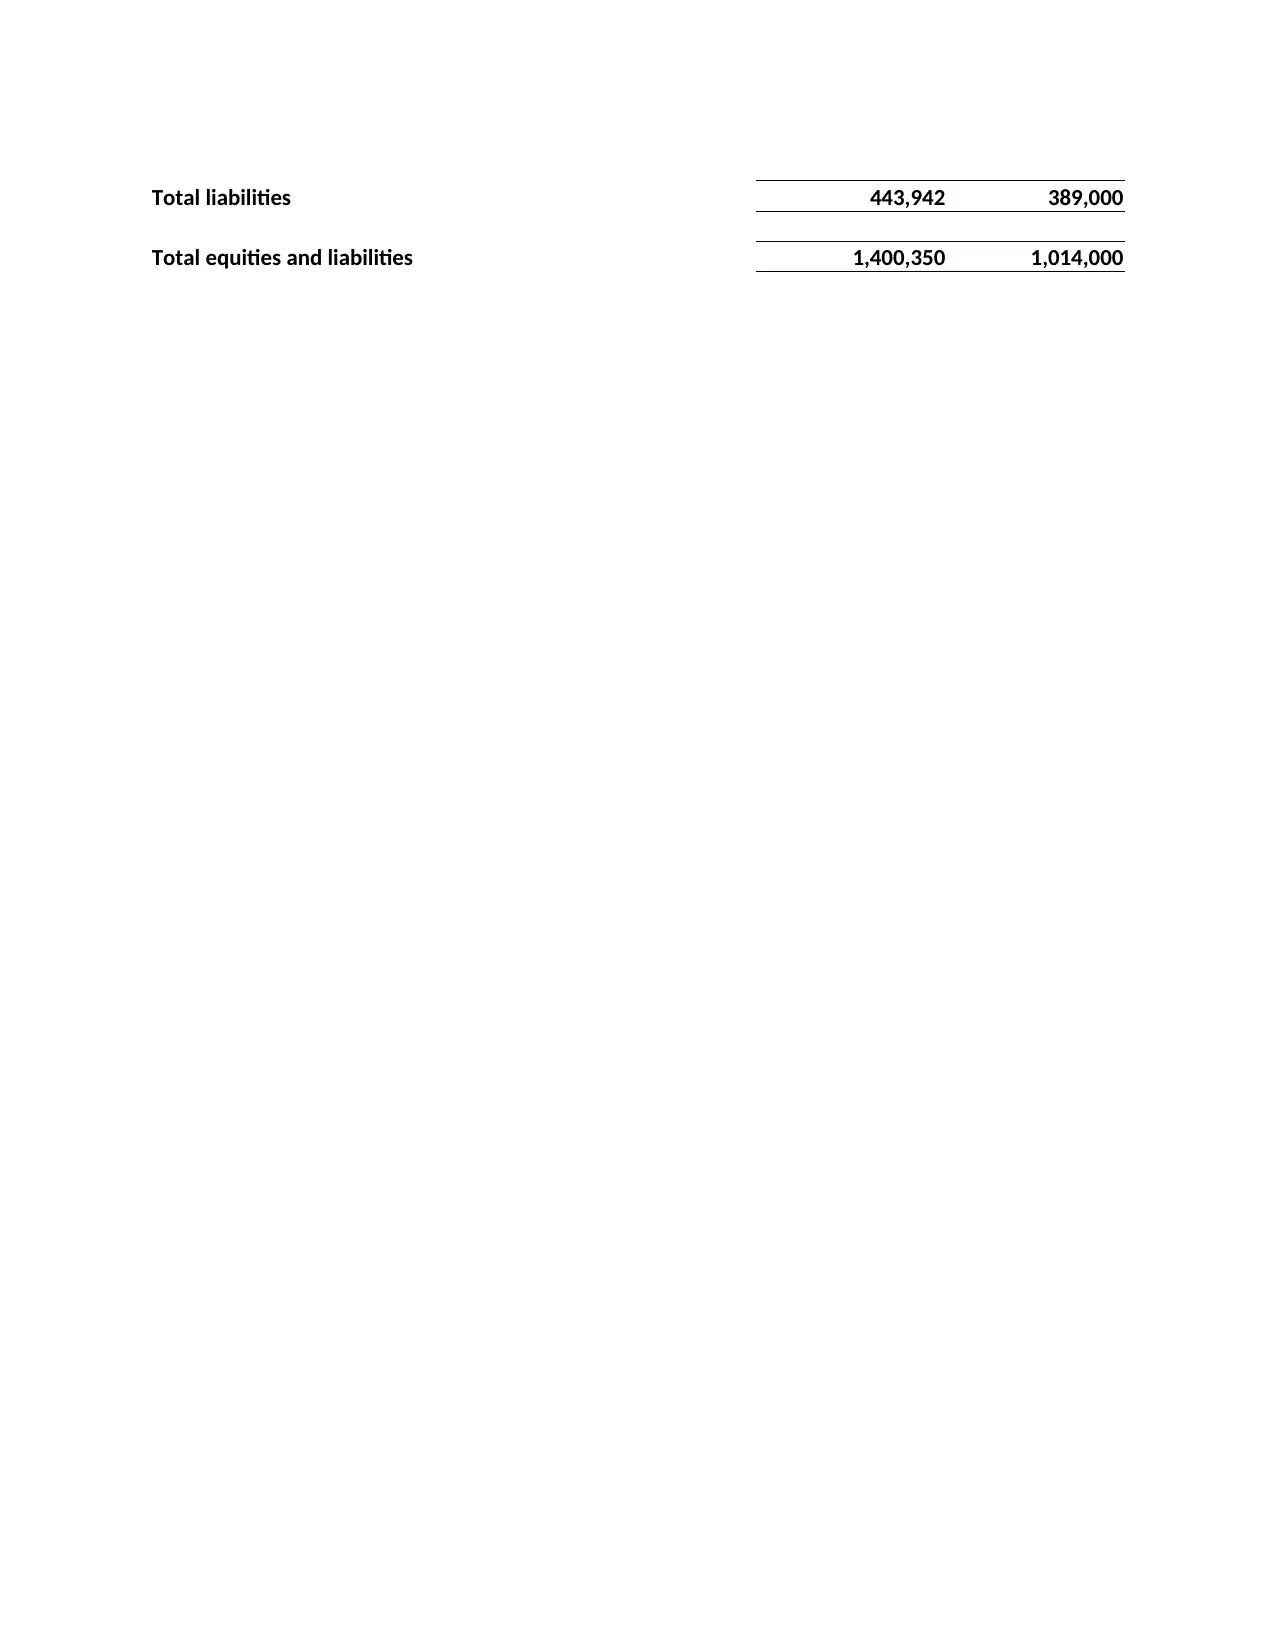
Total liabilities 443,942 389,000
Total equities and liabilities 1,400,350 1,014,000
Total equities and liabilities 1,400,350 1,014,000
Paraphrase This Document
Need a fresh take? Get an instant paraphrase of this document with our AI Paraphraser
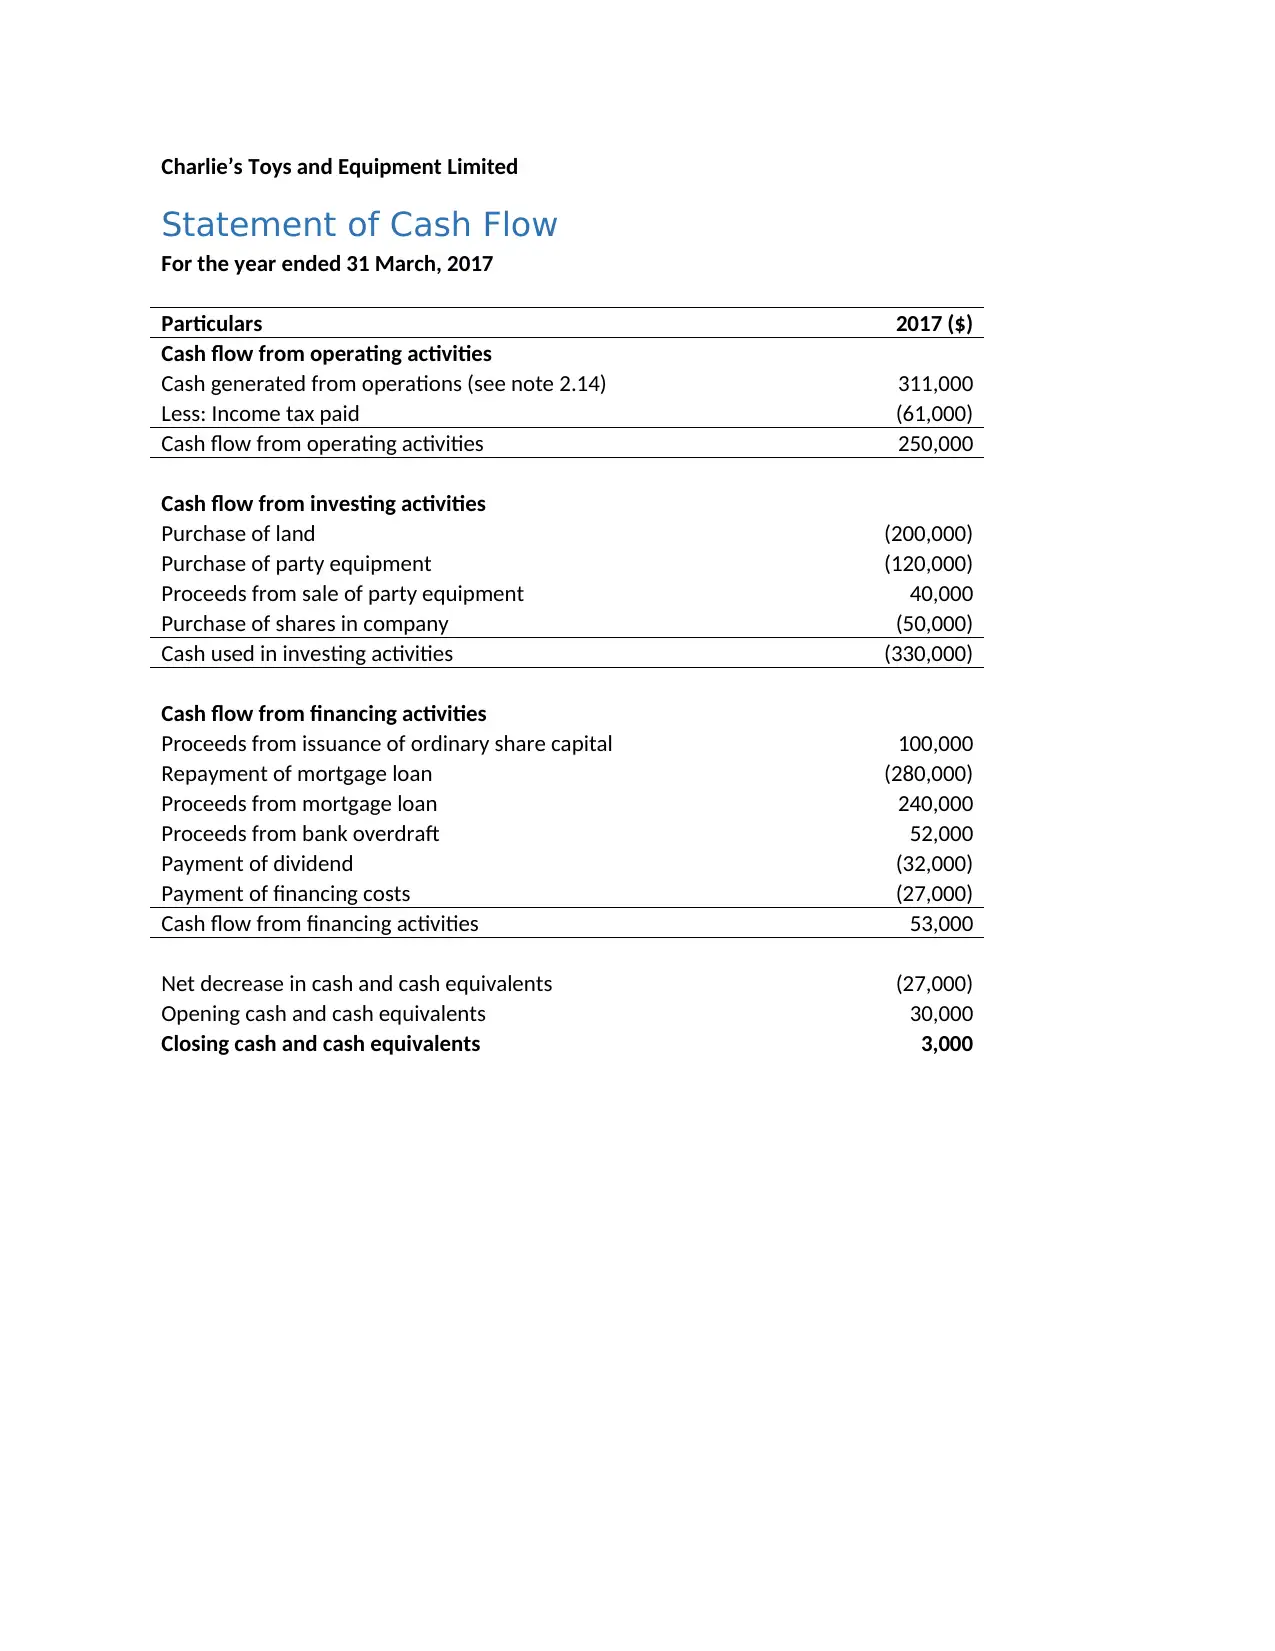
Charlie’s Toys and Equipment Limited
Statement of Cash Flow
For the year ended 31 March, 2017
Particulars 2017 ($)
Cash flow from operating activities
Cash generated from operations (see note 2.14) 311,000
Less: Income tax paid (61,000)
Cash flow from operating activities 250,000
Cash flow from investing activities
Purchase of land (200,000)
Purchase of party equipment (120,000)
Proceeds from sale of party equipment 40,000
Purchase of shares in company (50,000)
Cash used in investing activities (330,000)
Cash flow from financing activities
Proceeds from issuance of ordinary share capital 100,000
Repayment of mortgage loan (280,000)
Proceeds from mortgage loan 240,000
Proceeds from bank overdraft 52,000
Payment of dividend (32,000)
Payment of financing costs (27,000)
Cash flow from financing activities 53,000
Net decrease in cash and cash equivalents (27,000)
Opening cash and cash equivalents 30,000
Closing cash and cash equivalents 3,000
Charlie’s Toys and Equipment Limited
Notes to the Financial Statements
For the year ended on 31 March, 2017
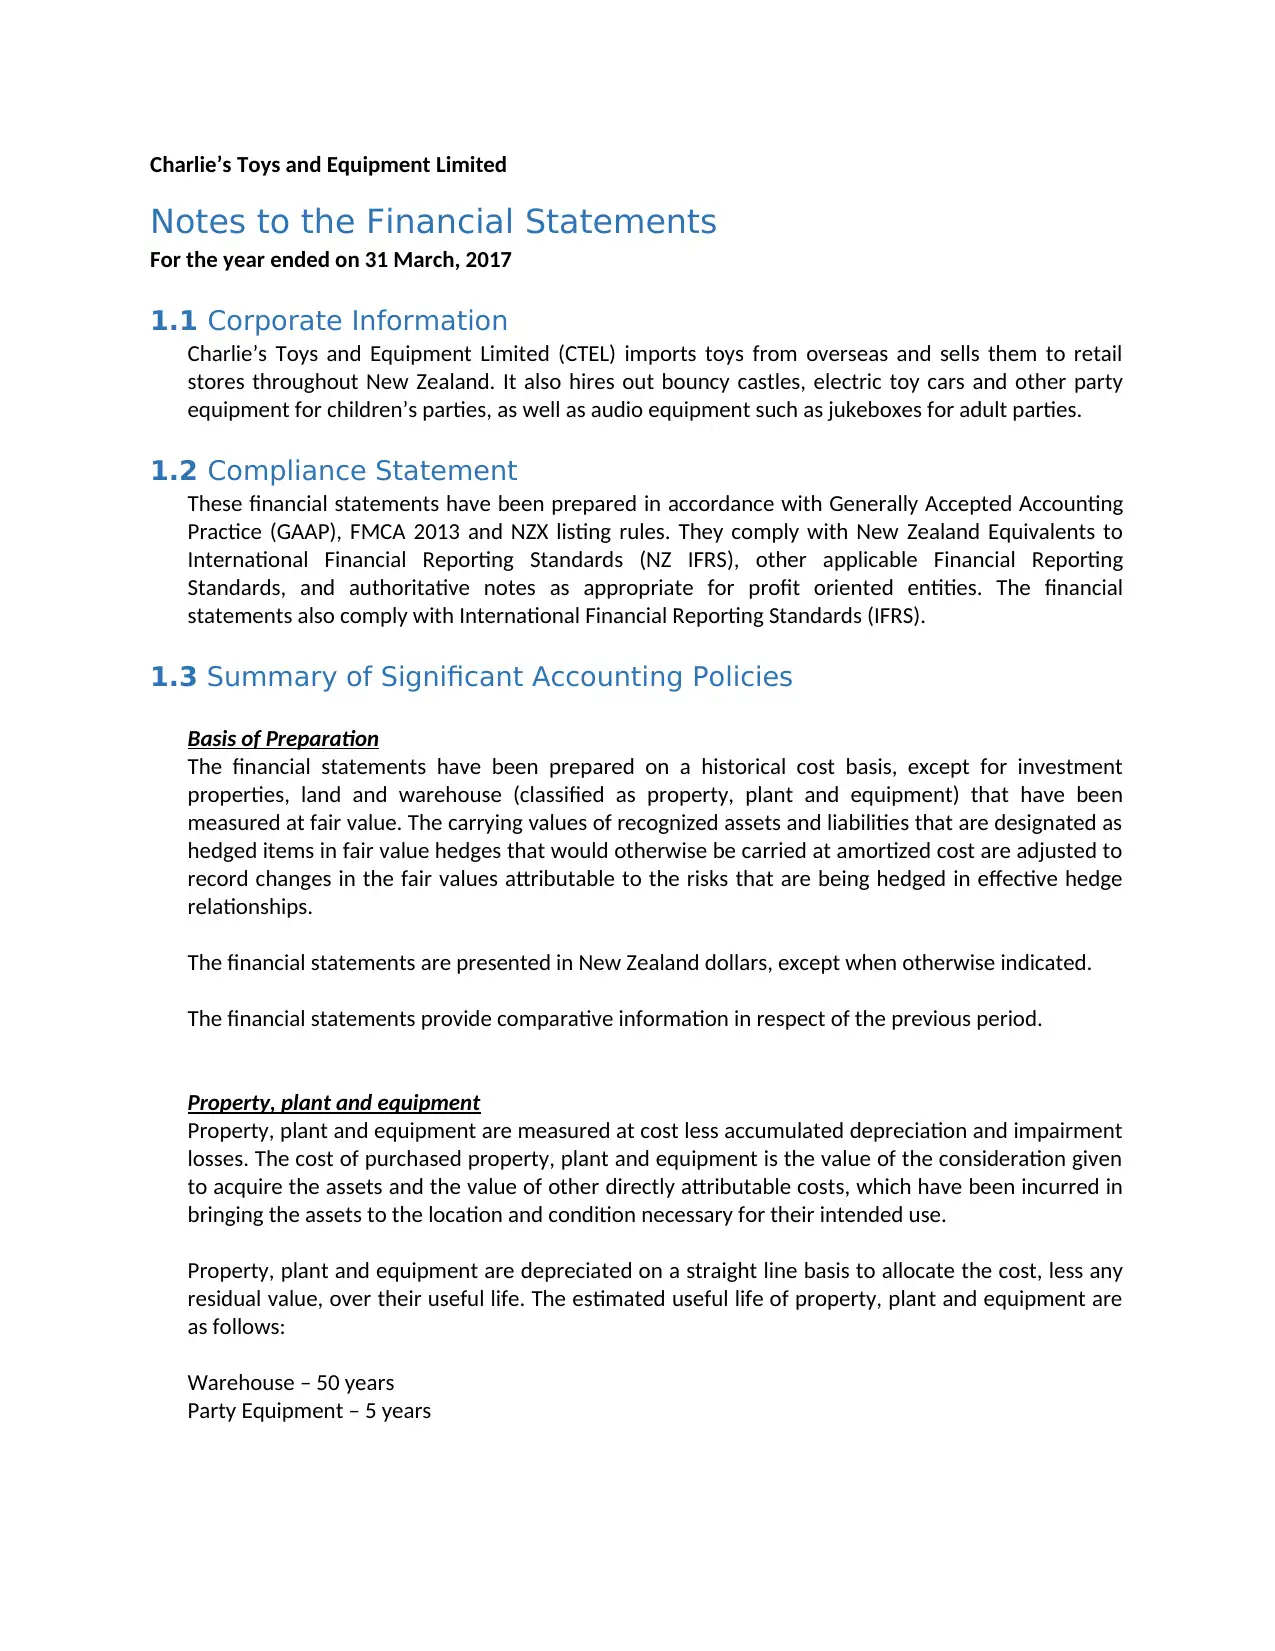
1.1 Corporate Information
Charlie’s Toys and Equipment Limited (CTEL) imports toys from overseas and sells them to retail
stores throughout New Zealand. It also hires out bouncy castles, electric toy cars and other party
equipment for children’s parties, as well as audio equipment such as jukeboxes for adult parties.
1.2 Compliance Statement
These financial statements have been prepared in accordance with Generally Accepted Accounting
Practice (GAAP), FMCA 2013 and NZX listing rules. They comply with New Zealand Equivalents to
International Financial Reporting Standards (NZ IFRS), other applicable Financial Reporting
Standards, and authoritative notes as appropriate for profit oriented entities. The financial
statements also comply with International Financial Reporting Standards (IFRS).
1.3 Summary of Significant Accounting Policies
Basis of Preparation
The financial statements have been prepared on a historical cost basis, except for investment
properties, land and warehouse (classified as property, plant and equipment) that have been
measured at fair value. The carrying values of recognized assets and liabilities that are designated as
hedged items in fair value hedges that would otherwise be carried at amortized cost are adjusted to
record changes in the fair values attributable to the risks that are being hedged in effective hedge
relationships.
The financial statements are presented in New Zealand dollars, except when otherwise indicated.
The financial statements provide comparative information in respect of the previous period.
Property, plant and equipment
Property, plant and equipment are measured at cost less accumulated depreciation and impairment
losses. The cost of purchased property, plant and equipment is the value of the consideration given
to acquire the assets and the value of other directly attributable costs, which have been incurred in
bringing the assets to the location and condition necessary for their intended use.
Property, plant and equipment are depreciated on a straight line basis to allocate the cost, less any
residual value, over their useful life. The estimated useful life of property, plant and equipment are
as follows:
Warehouse – 50 years
Party Equipment – 5 years
Notes to the Financial Statements
For the year ended on 31 March, 2017
1.1 Corporate Information
Charlie’s Toys and Equipment Limited (CTEL) imports toys from overseas and sells them to retail
stores throughout New Zealand. It also hires out bouncy castles, electric toy cars and other party
equipment for children’s parties, as well as audio equipment such as jukeboxes for adult parties.
1.2 Compliance Statement
These financial statements have been prepared in accordance with Generally Accepted Accounting
Practice (GAAP), FMCA 2013 and NZX listing rules. They comply with New Zealand Equivalents to
International Financial Reporting Standards (NZ IFRS), other applicable Financial Reporting
Standards, and authoritative notes as appropriate for profit oriented entities. The financial
statements also comply with International Financial Reporting Standards (IFRS).
1.3 Summary of Significant Accounting Policies
Basis of Preparation
The financial statements have been prepared on a historical cost basis, except for investment
properties, land and warehouse (classified as property, plant and equipment) that have been
measured at fair value. The carrying values of recognized assets and liabilities that are designated as
hedged items in fair value hedges that would otherwise be carried at amortized cost are adjusted to
record changes in the fair values attributable to the risks that are being hedged in effective hedge
relationships.
The financial statements are presented in New Zealand dollars, except when otherwise indicated.
The financial statements provide comparative information in respect of the previous period.
Property, plant and equipment
Property, plant and equipment are measured at cost less accumulated depreciation and impairment
losses. The cost of purchased property, plant and equipment is the value of the consideration given
to acquire the assets and the value of other directly attributable costs, which have been incurred in
bringing the assets to the location and condition necessary for their intended use.
Property, plant and equipment are depreciated on a straight line basis to allocate the cost, less any
residual value, over their useful life. The estimated useful life of property, plant and equipment are
as follows:
Warehouse – 50 years
Party Equipment – 5 years
⊘ This is a preview!⊘
Do you want full access?
Subscribe today to unlock all pages.
Trusted by 1+ million students worldwide
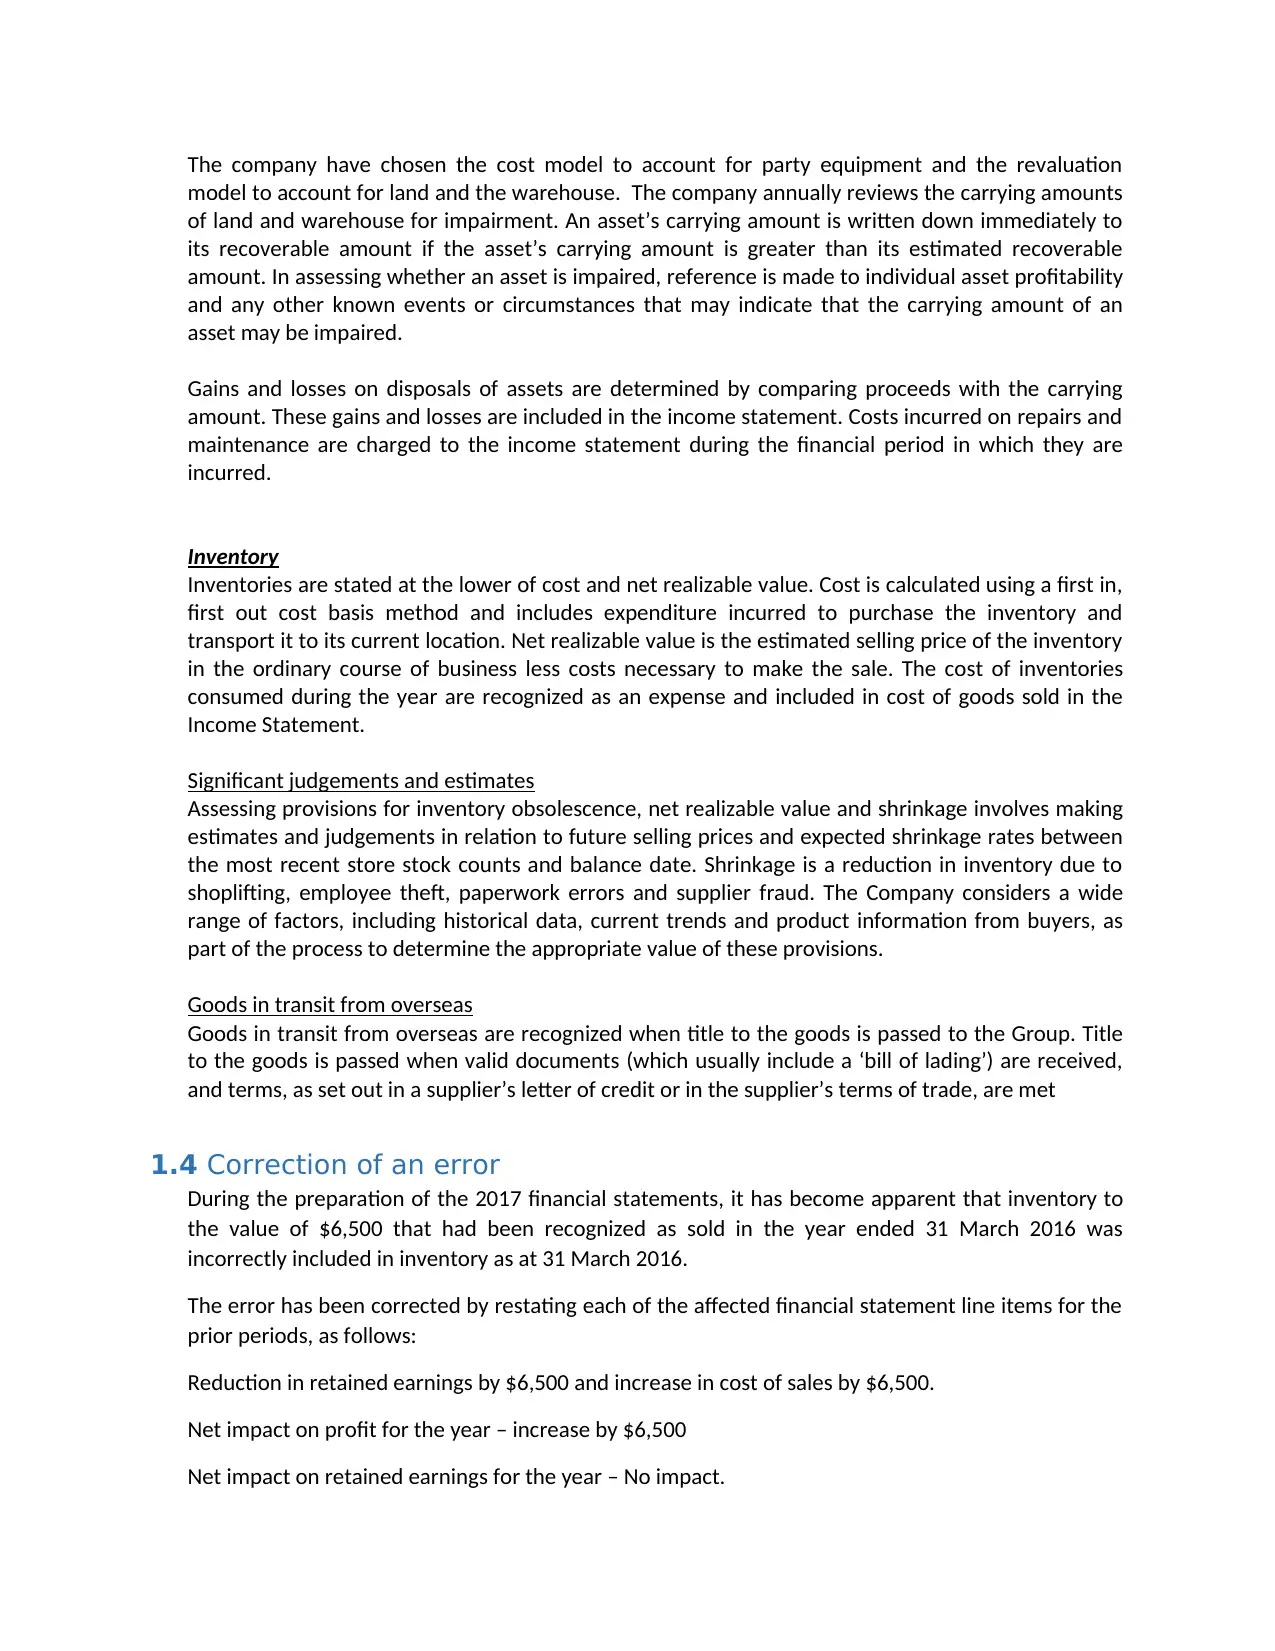
The company have chosen the cost model to account for party equipment and the revaluation
model to account for land and the warehouse. The company annually reviews the carrying amounts
of land and warehouse for impairment. An asset’s carrying amount is written down immediately to
its recoverable amount if the asset’s carrying amount is greater than its estimated recoverable
amount. In assessing whether an asset is impaired, reference is made to individual asset profitability
and any other known events or circumstances that may indicate that the carrying amount of an
asset may be impaired.
Gains and losses on disposals of assets are determined by comparing proceeds with the carrying
amount. These gains and losses are included in the income statement. Costs incurred on repairs and
maintenance are charged to the income statement during the financial period in which they are
incurred.
Inventory
Inventories are stated at the lower of cost and net realizable value. Cost is calculated using a first in,
first out cost basis method and includes expenditure incurred to purchase the inventory and
transport it to its current location. Net realizable value is the estimated selling price of the inventory
in the ordinary course of business less costs necessary to make the sale. The cost of inventories
consumed during the year are recognized as an expense and included in cost of goods sold in the
Income Statement.
Significant judgements and estimates
Assessing provisions for inventory obsolescence, net realizable value and shrinkage involves making
estimates and judgements in relation to future selling prices and expected shrinkage rates between
the most recent store stock counts and balance date. Shrinkage is a reduction in inventory due to
shoplifting, employee theft, paperwork errors and supplier fraud. The Company considers a wide
range of factors, including historical data, current trends and product information from buyers, as
part of the process to determine the appropriate value of these provisions.
Goods in transit from overseas
Goods in transit from overseas are recognized when title to the goods is passed to the Group. Title
to the goods is passed when valid documents (which usually include a ‘bill of lading’) are received,
and terms, as set out in a supplier’s letter of credit or in the supplier’s terms of trade, are met
1.4 Correction of an error
During the preparation of the 2017 financial statements, it has become apparent that inventory to
the value of $6,500 that had been recognized as sold in the year ended 31 March 2016 was
incorrectly included in inventory as at 31 March 2016.
The error has been corrected by restating each of the affected financial statement line items for the
prior periods, as follows:
Reduction in retained earnings by $6,500 and increase in cost of sales by $6,500.
Net impact on profit for the year – increase by $6,500
Net impact on retained earnings for the year – No impact.
Paraphrase This Document
Need a fresh take? Get an instant paraphrase of this document with our AI Paraphraser
Charlie’s Toys and Equipment Limited
Notes to the Financial Statements
For the year ended on 31 March, 2017
Other financial Notes
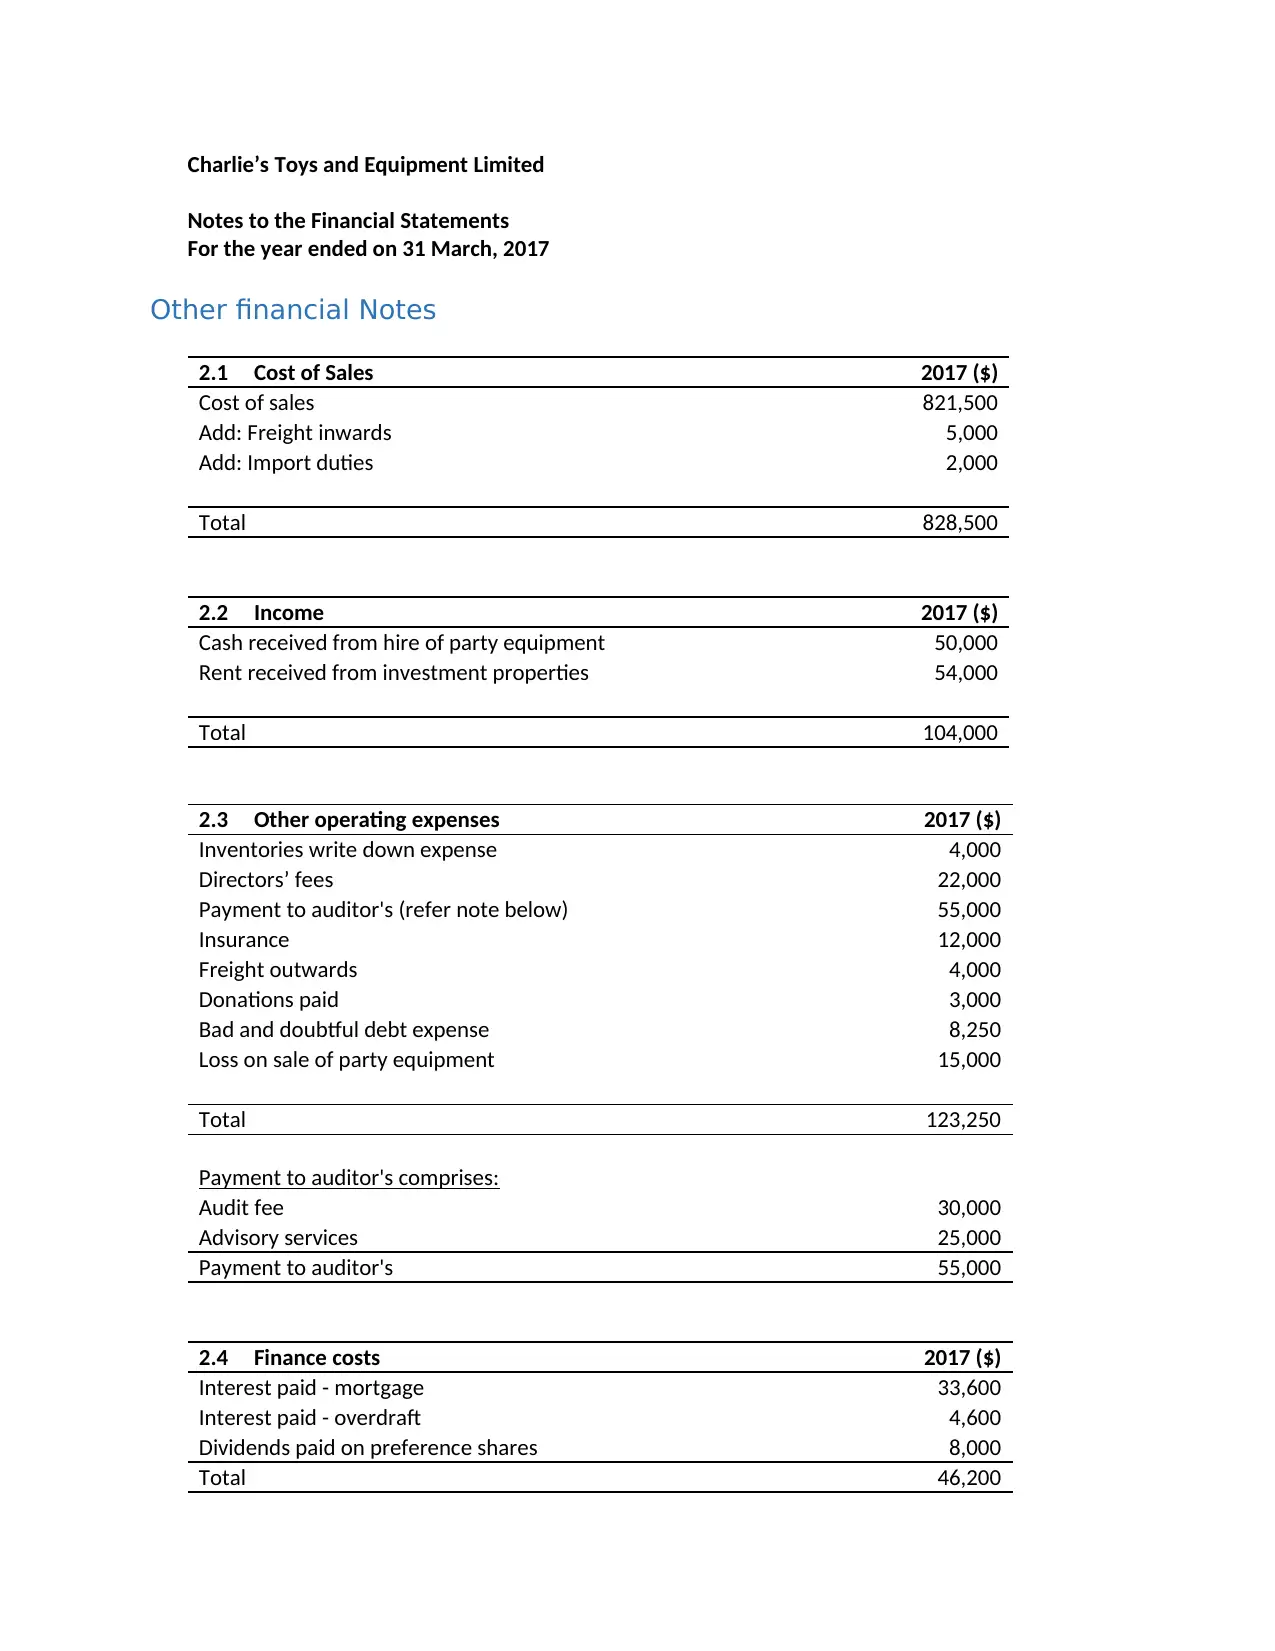
2.1 Cost of Sales 2017 ($)
Cost of sales 821,500
Add: Freight inwards 5,000
Add: Import duties 2,000
Total 828,500
2.2 Income 2017 ($)
Cash received from hire of party equipment 50,000
Rent received from investment properties 54,000
Total 104,000
2.3 Other operating expenses 2017 ($)
Inventories write down expense 4,000
Directors’ fees 22,000
Payment to auditor's (refer note below) 55,000
Insurance 12,000
Freight outwards 4,000
Donations paid 3,000
Bad and doubtful debt expense 8,250
Loss on sale of party equipment 15,000
Total 123,250
Payment to auditor's comprises:
Audit fee 30,000
Advisory services 25,000
Payment to auditor's 55,000
2.4 Finance costs 2017 ($)
Interest paid - mortgage 33,600
Interest paid - overdraft 4,600
Dividends paid on preference shares 8,000
Total 46,200
Notes to the Financial Statements
For the year ended on 31 March, 2017
Other financial Notes
2.1 Cost of Sales 2017 ($)
Cost of sales 821,500
Add: Freight inwards 5,000
Add: Import duties 2,000
Total 828,500
2.2 Income 2017 ($)
Cash received from hire of party equipment 50,000
Rent received from investment properties 54,000
Total 104,000
2.3 Other operating expenses 2017 ($)
Inventories write down expense 4,000
Directors’ fees 22,000
Payment to auditor's (refer note below) 55,000
Insurance 12,000
Freight outwards 4,000
Donations paid 3,000
Bad and doubtful debt expense 8,250
Loss on sale of party equipment 15,000
Total 123,250
Payment to auditor's comprises:
Audit fee 30,000
Advisory services 25,000
Payment to auditor's 55,000
2.4 Finance costs 2017 ($)
Interest paid - mortgage 33,600
Interest paid - overdraft 4,600
Dividends paid on preference shares 8,000
Total 46,200
Charlie’s Toys and Equipment Limited
Notes to the Financial Statements
For the year ended on 31 March, 2017
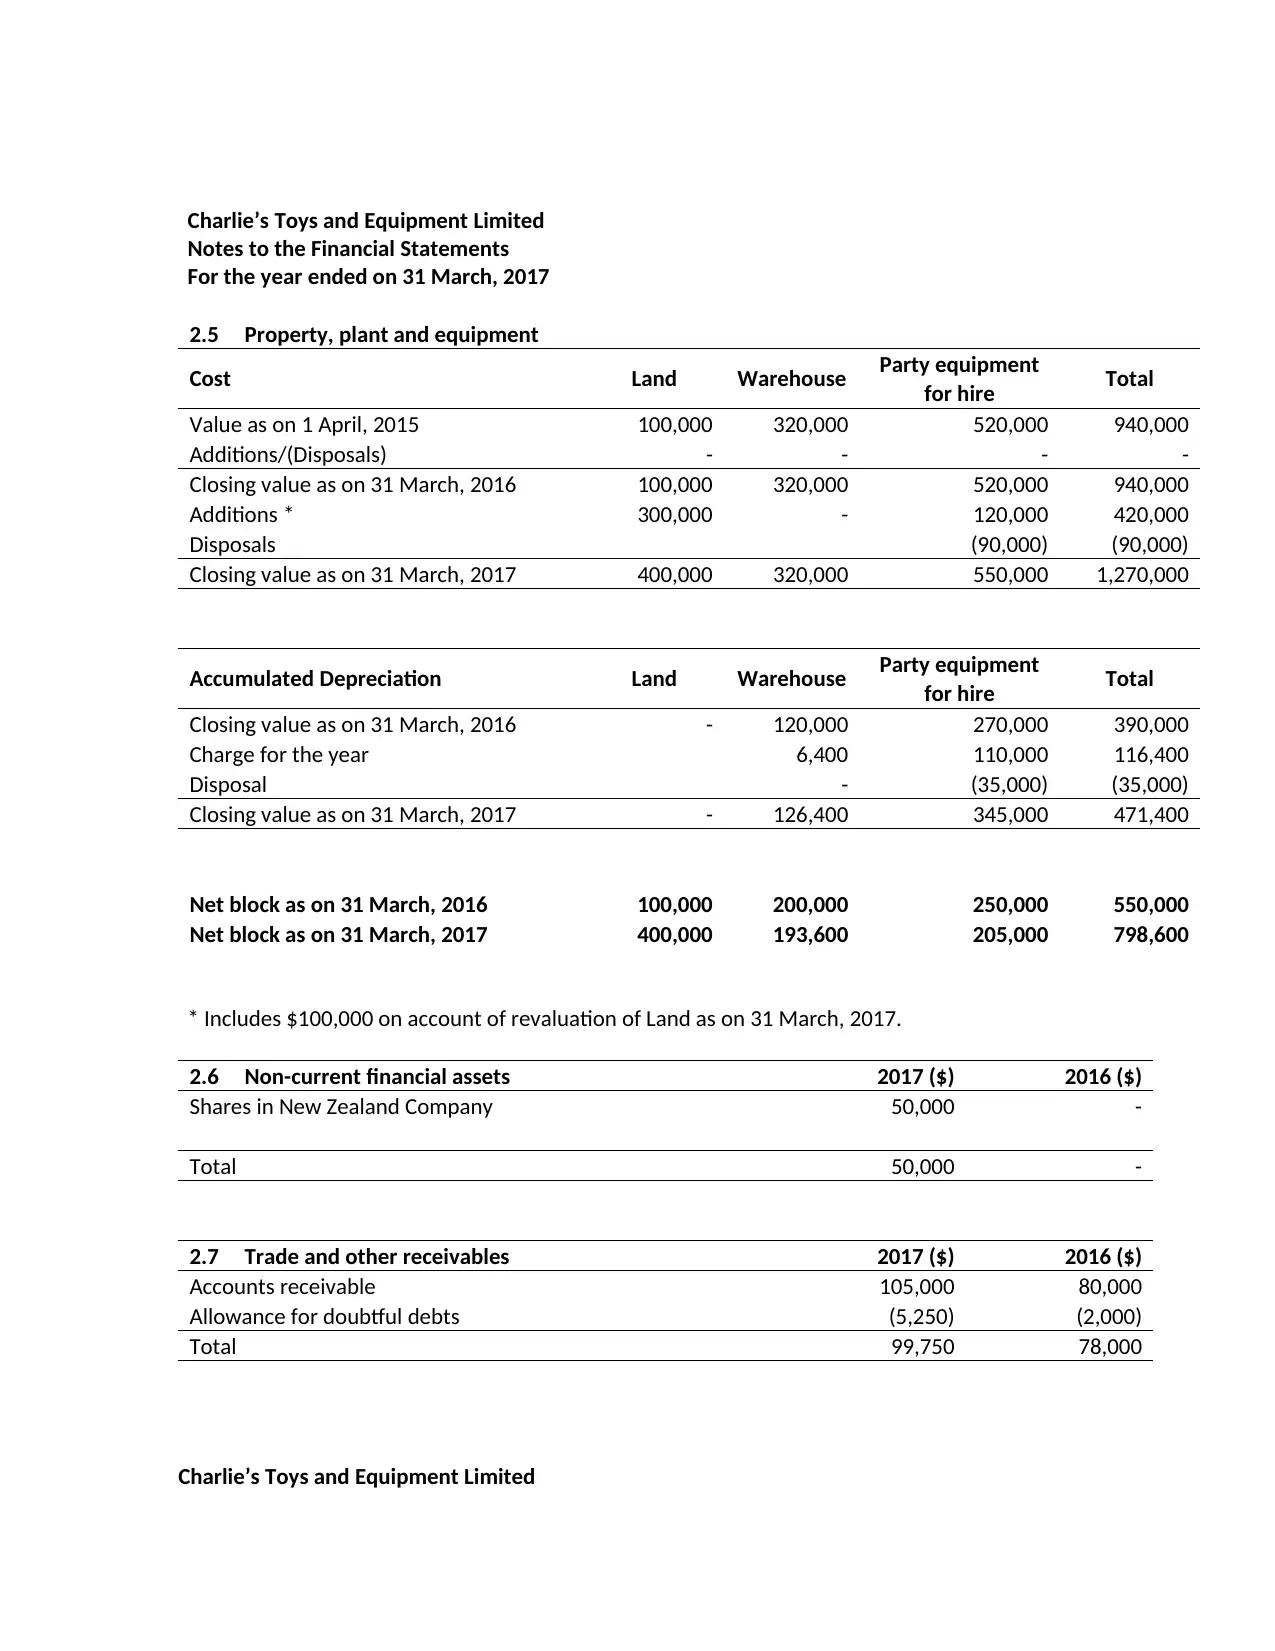
2.5 Property, plant and equipment
Cost Land Warehouse Party equipment
for hire Total
Value as on 1 April, 2015 100,000 320,000 520,000 940,000
Additions/(Disposals) - - - -
Closing value as on 31 March, 2016 100,000 320,000 520,000 940,000
Additions * 300,000 - 120,000 420,000
Disposals (90,000) (90,000)
Closing value as on 31 March, 2017 400,000 320,000 550,000 1,270,000
Accumulated Depreciation Land Warehouse Party equipment
for hire Total
Closing value as on 31 March, 2016 - 120,000 270,000 390,000
Charge for the year 6,400 110,000 116,400
Disposal - (35,000) (35,000)
Closing value as on 31 March, 2017 - 126,400 345,000 471,400
Net block as on 31 March, 2016 100,000 200,000 250,000 550,000
Net block as on 31 March, 2017 400,000 193,600 205,000 798,600
* Includes $100,000 on account of revaluation of Land as on 31 March, 2017.
2.6 Non-current financial assets 2017 ($) 2016 ($)
Shares in New Zealand Company 50,000 -
Total 50,000 -
2.7 Trade and other receivables 2017 ($) 2016 ($)
Accounts receivable 105,000 80,000
Allowance for doubtful debts (5,250) (2,000)
Total 99,750 78,000
Charlie’s Toys and Equipment Limited
Notes to the Financial Statements
For the year ended on 31 March, 2017
2.5 Property, plant and equipment
Cost Land Warehouse Party equipment
for hire Total
Value as on 1 April, 2015 100,000 320,000 520,000 940,000
Additions/(Disposals) - - - -
Closing value as on 31 March, 2016 100,000 320,000 520,000 940,000
Additions * 300,000 - 120,000 420,000
Disposals (90,000) (90,000)
Closing value as on 31 March, 2017 400,000 320,000 550,000 1,270,000
Accumulated Depreciation Land Warehouse Party equipment
for hire Total
Closing value as on 31 March, 2016 - 120,000 270,000 390,000
Charge for the year 6,400 110,000 116,400
Disposal - (35,000) (35,000)
Closing value as on 31 March, 2017 - 126,400 345,000 471,400
Net block as on 31 March, 2016 100,000 200,000 250,000 550,000
Net block as on 31 March, 2017 400,000 193,600 205,000 798,600
* Includes $100,000 on account of revaluation of Land as on 31 March, 2017.
2.6 Non-current financial assets 2017 ($) 2016 ($)
Shares in New Zealand Company 50,000 -
Total 50,000 -
2.7 Trade and other receivables 2017 ($) 2016 ($)
Accounts receivable 105,000 80,000
Allowance for doubtful debts (5,250) (2,000)
Total 99,750 78,000
Charlie’s Toys and Equipment Limited
⊘ This is a preview!⊘
Do you want full access?
Subscribe today to unlock all pages.
Trusted by 1+ million students worldwide
1 out of 18
Related Documents


Your All-in-One AI-Powered Toolkit for Academic Success.
+13062052269
info@desklib.com
Available 24*7 on WhatsApp / Email
![[object Object]](/_next/static/media/star-bottom.7253800d.svg)
Unlock your academic potential
Copyright © 2020–2026 A2Z Services. All Rights Reserved. Developed and managed by ZUCOL.