Statistical Analysis: Curve-Fitting Project of Women's 100M Dash Times

Verified

Added on  2022/09/07

|9
|1256
|33
Project
AI Summary
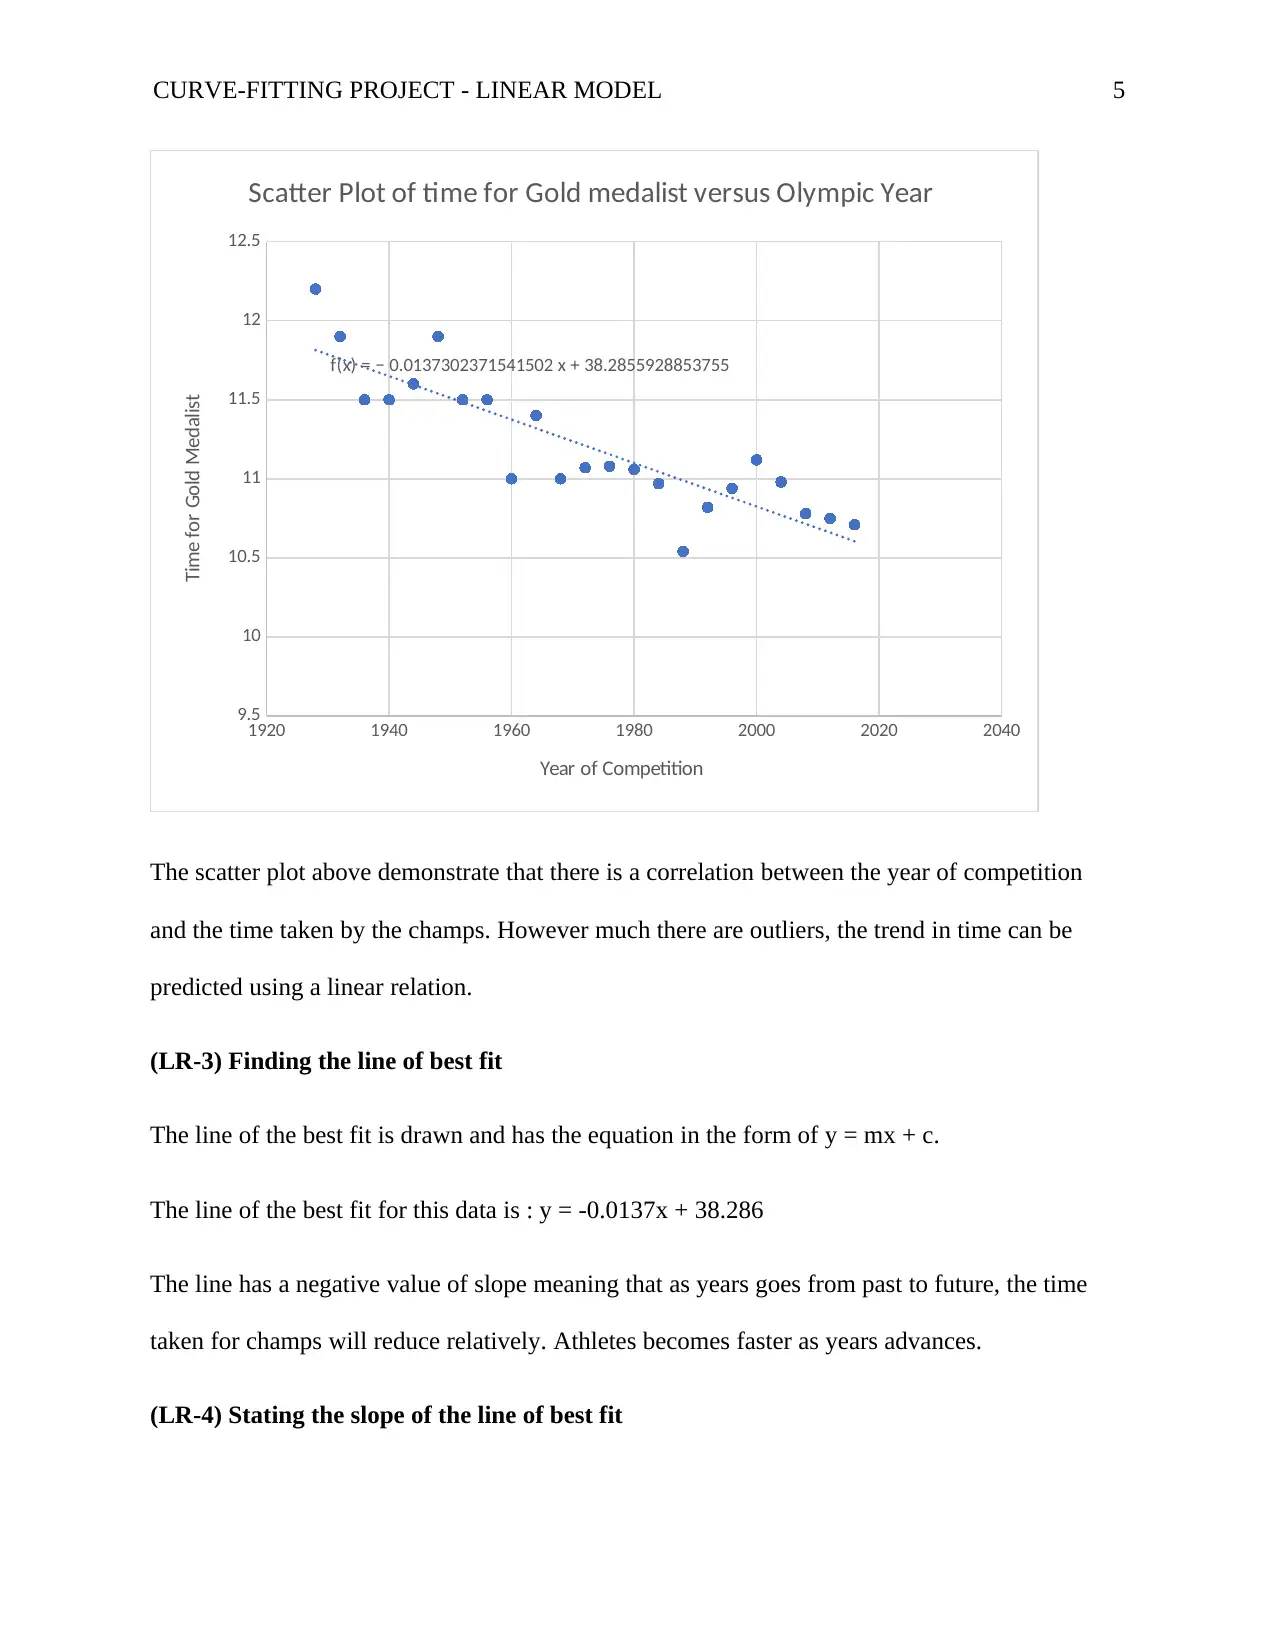
This project investigates the relationship between the year of the Olympic Games and the winning times of women's 100-meter dash. It utilizes a linear model to analyze the data, plotting the times and years on a scatter plot to visualize the trend. The project determines the line of best fit, calculates the slope and intercept, and assesses the coefficient of determination and correlation to evaluate the strength of the linear relationship. Based on the model, predictions are made for the winning times in the 2020 and 2024 Olympics. The project concludes by discussing the application of linear models in statistical analysis and highlights the advantages of using a linear model for data representation and prediction.
Document Page
CURVE-FITTING PROJECT - LINEAR MODEL 1
100M dash winning times for women in the Olympics
Firstname Lastname
Name of Institution
tabler-icon-diamond-filled.svg

Paraphrase This Document

Need a fresh take? Get an instant paraphrase of this document with our AI Paraphraser
Document Page
CURVE-FITTING PROJECT - LINEAR MODEL 2
Curve-fitting Project - Linear Model for 100M dash winning times for women in the
Olympics
(LR-1) Description of the topic
The Olympic 100 m is perhaps the most coveted distance competition, which draws global
athletes at the top level. Every now and then, the race winner is alluded to as the "fastest man or
woman in the world," reflecting the high level of competition and success quality. As of
February 2014, men's present Olympic records of 9.63 and women's records of 10.62 seconds
listed second and third quickest times in history, in both for males and femalesThe standard of
performance at just the Olympics has improved in step with the entire discipline and in the end-
of-season lists that times in the final also rate high. At the meet, national records and personal
records are often achieved by sprinters from smaller and larger countries respectively, because
most athletes strive to reach optimum Olympic race performance.
Collectively, the 2016 women's final was the fastest women's 100 m race ever: for the very first
time, six of the eight finalists ran 10.71 seconds or quicker, with Veronica Campbell- being the
quickest ever silver medalist with a time of 10.81 seconds and Tianna Madison being the fastest
third runners up with a period of 10.85 seconds.
The data in the table below shows a result taken from the world’s fastest women on 100 meters
athlete races that took place after each and every four years. The data will be used to perform
statistical analysis, in which line of best fit will be drawn to show the relationship between the
time in terms of years and the speed of the women. Generally, from the table it can seen that
Document Page
CURVE-FITTING PROJECT - LINEAR MODEL 3
there is a general increasing trend of velocity from time to time since the athletes was started
with the recent years showing the fastest time taken by women in completing 100 meters race.
The data obtained from the Olympic games website, https://www.olympic.org/athletics/100m-
women shows the year of athletics or competition and the time in second reconded by the gold
medalist or the best during the finals.
Year of
Athletics
Time Taken by 100
M women Champs
1928 12.20
1932 11.90
1936 11.50
1940 11.50
1944 11.60
1948 11.90
1952 11.50
1956 11.50
1960 11.00
1964 11.40
1968 11.00
1972 11.07
1976 11.08
1980 11.06
1984 10.97
1988 10.54
Document Page
CURVE-FITTING PROJECT - LINEAR MODEL 4
1992 10.82
1996 10.94
2000 11.12
2004 10.98
2008 10.78
2012 10.75
2016 10.71
Aim of the project project
To determine the relationship between the time taken by 100 meters women champs and the time
of the years
To give a prediction on what time to be taken by future champs in 100-meter race
(LR-2) Plotting the points (x, y)
Drawing of the scatter plot
The data represented in the table above shows both independent and dependent variables. The
time of the year when the Olympic took place represents the independent variable whereas the
time taken by champs is the dependent variable.
The time taken by champions to complete the race is y variable while the year of competition is
the x- variable
The scatter plot is obtained as follows
tabler-icon-diamond-filled.svg

Paraphrase This Document

Need a fresh take? Get an instant paraphrase of this document with our AI Paraphraser
Document Page
CURVE-FITTING PROJECT - LINEAR MODEL 5
1920 1940 1960 1980 2000 2020 2040
9.5
10
10.5
11
11.5
12
12.5
f(x) = − 0.0137302371541502 x + 38.2855928853755
Scatter Plot of time for Gold medalist versus Olympic Year
Year of Competition
Time for Gold Medalist
The scatter plot above demonstrate that there is a correlation between the year of competition
and the time taken by the champs. However much there are outliers, the trend in time can be
predicted using a linear relation.
(LR-3) Finding the line of best fit
The line of the best fit is drawn and has the equation in the form of y = mx + c.
The line of the best fit for this data is : y = -0.0137x + 38.286
The line has a negative value of slope meaning that as years goes from past to future, the time
taken for champs will reduce relatively. Athletes becomes faster as years advances.
(LR-4) Stating the slope of the line of best fit
Document Page
CURVE-FITTING PROJECT - LINEAR MODEL 6
Stating the slope of the line of the best fit
The equation of the line of the best fit is y = -0.0137x + 38.286. This equation means that the
intercept of the y- variable is 38.286, meaning that considering all other factors at the beginning
of athletes, the best 100 meters champ woman won after running 38.286 seconds.
Secondly, the slope of the line of the best fit is -0.0137. Slope is negative because as years goes,
the athletes becomes faster and faster.
(LR-5) Coefficient of determination and coefficient of relation
The linear relationship is very strong since the value of the r-square, r2 , the coefficient of
determination is 0.755.
The value of r, coefficient of correlation is 0.755=0.8689, r is negative because the slope is
negative. Therefore, the data has a strong negative linear relationship, a decrease in y- variable is
caused by an increase in x-variable.
The line is best curve to fit this data because, it shows a close approximation on what time the
athletes took to win a gold medal and their respective years of action. At least most data falls
within the line of the best fit.
(LR-6) making an estimate or prediction
Let’s predict the time that will be taken by a champ to win a gold medal in 2020 and 2024
world athletics
i. Time for 2020
Consider the linear equation from scatter plot
y = -0.0137x + 38.286
Document Page
CURVE-FITTING PROJECT - LINEAR MODEL 7
we replace x-value in the equation by 2020 and find the predicted time as follows
y = -0.0137*2020 + 38.286 = 10.61 seconds
therefore we expect the 2020 champ in 100 meters women race to win by 10.61
seconds
ii. Time taken for 2024
Similarly, consider the linear equation from scatter plot
y = -0.0137x + 38.286
we replace x-value in the equation by 2024 and find the predicted time as follows
y = -0.0137*2024 + 38.286 = 10.56 seconds
therefore, we expect the 2024 champ in 100 meters women race to win by 10.56
seconds
(LR-7) Writing a brief Narrative
The application of linear models in statistical analysis is an important aspect in data analysis.
This project aimed at finding the best suitable linear model in which the results of 100 meters
women champs over the years can be represented. The best linear model is one in which its
coefficient of correlation is above 0.7, either positive negative depending on the nature of the
data. The advantage of the linear model in data representation is that prediction and future
estimates can be easily computed. The line of the best is one which accommodates all the data
points either by passing through a bigger percentage of the data points or separating the data
points in equal sides. The other methods of data representation and prediction can be through
polynomial equation, exponential, moving average, logarithmic and power models, though these
are quite tedious and involving in terms of calculation.
tabler-icon-diamond-filled.svg

Paraphrase This Document

Need a fresh take? Get an instant paraphrase of this document with our AI Paraphraser
Document Page
CURVE-FITTING PROJECT - LINEAR MODEL 8
References
https://www.olympic.org/athletics/100m-women
https://www.dummies.com/education/math/statistics/how-to-interpret-a-correlation-coefficient-r/
Document Page
CURVE-FITTING PROJECT - LINEAR MODEL 9
chevron_up_icon
1 out of 9
circle_padding
hide_on_mobile
zoom_out_icon
[object Object]