Statistical Analysis and Report on Customer Behavior in E-commerce

Verified

Added on  2022/12/20

|13
|1597
|96
Report
AI Summary
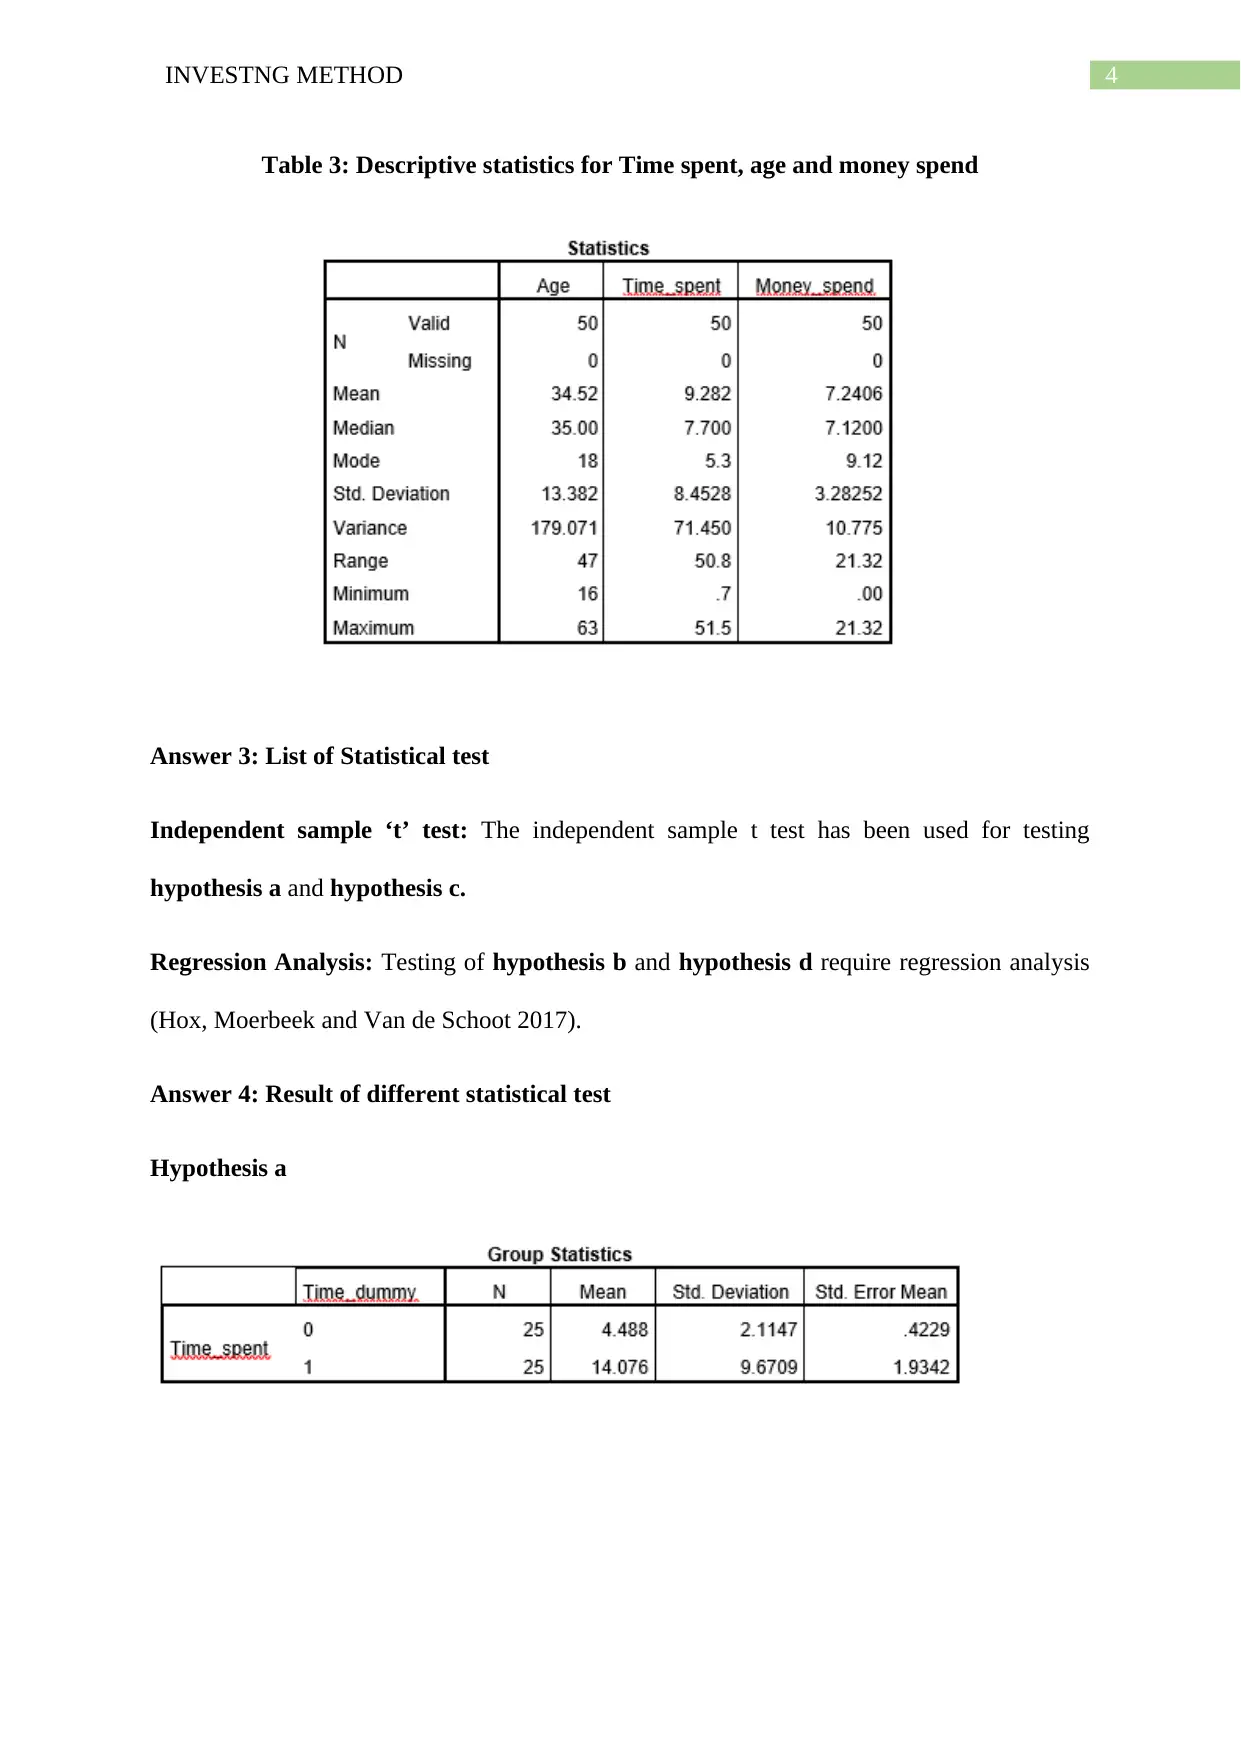
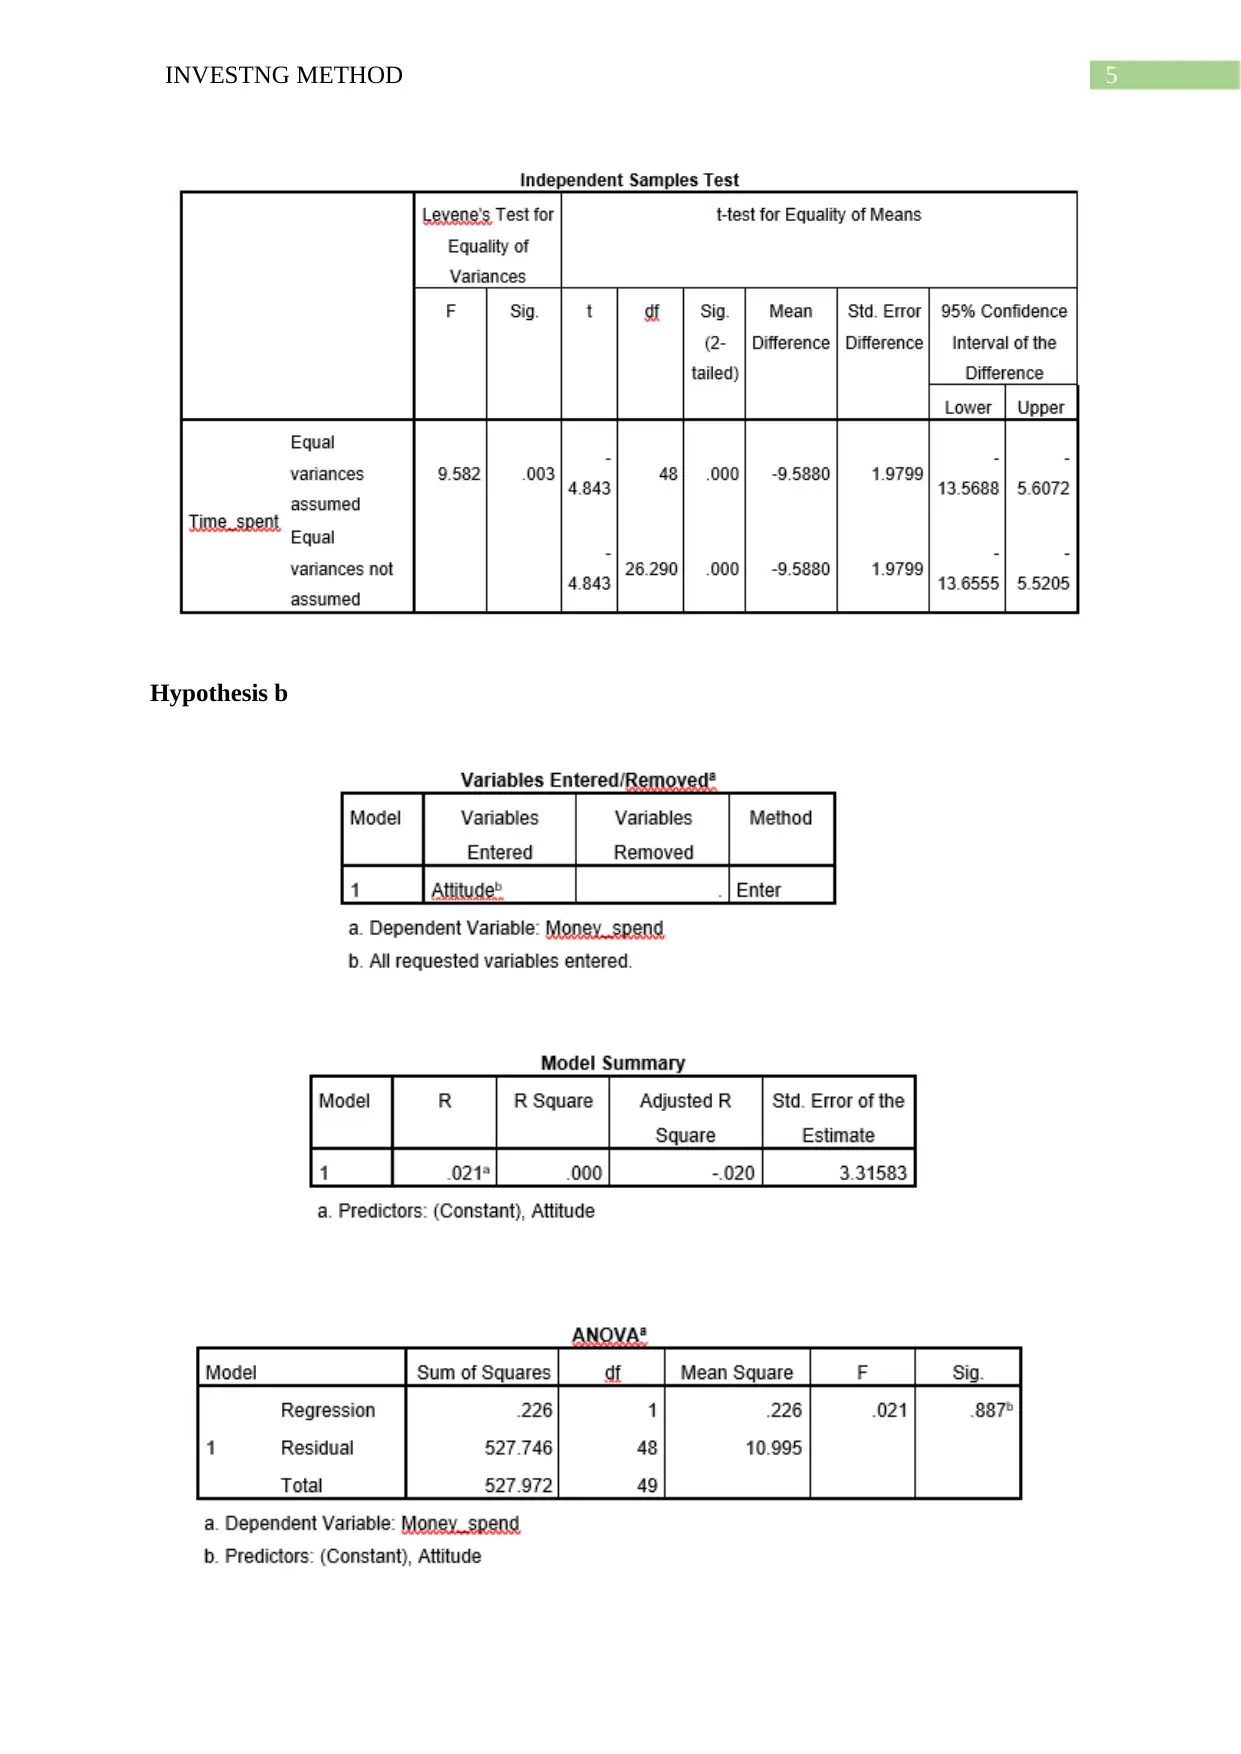
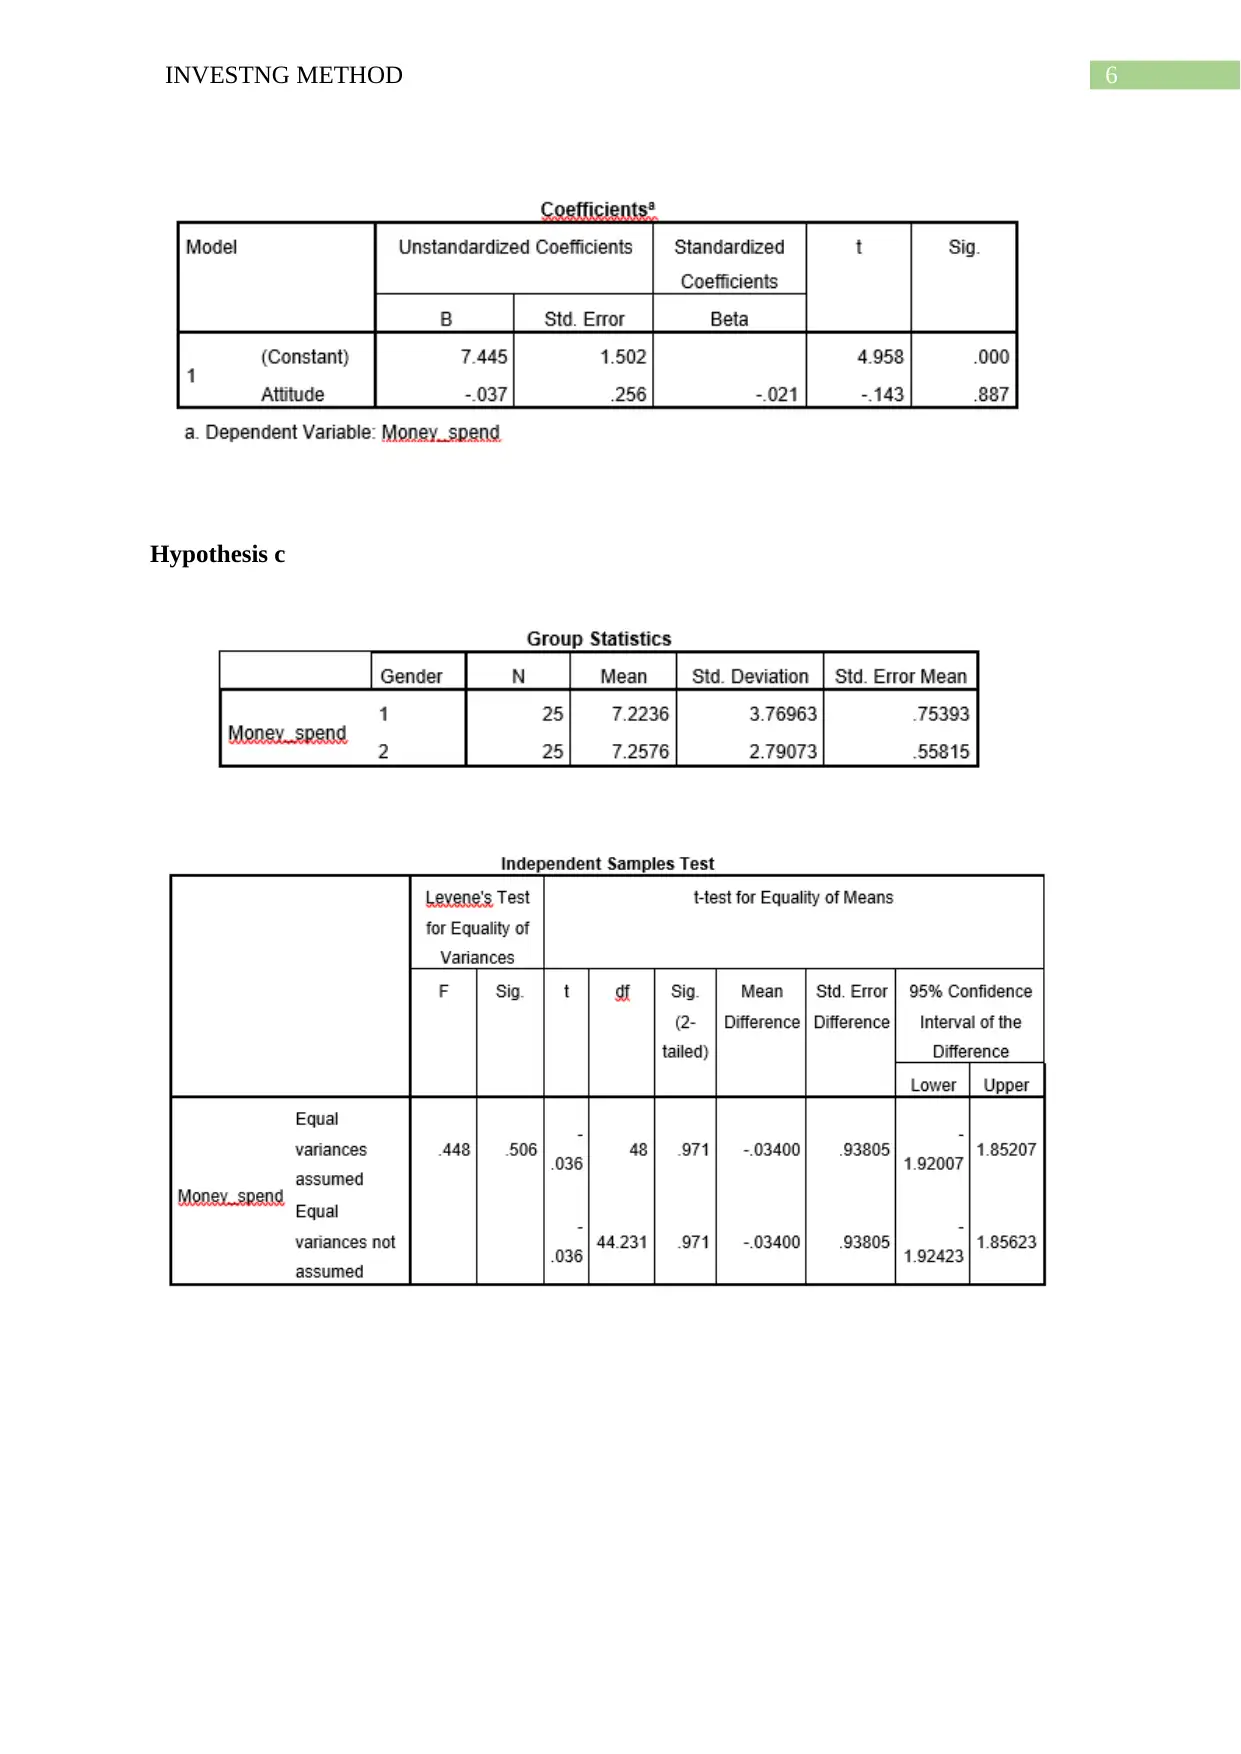
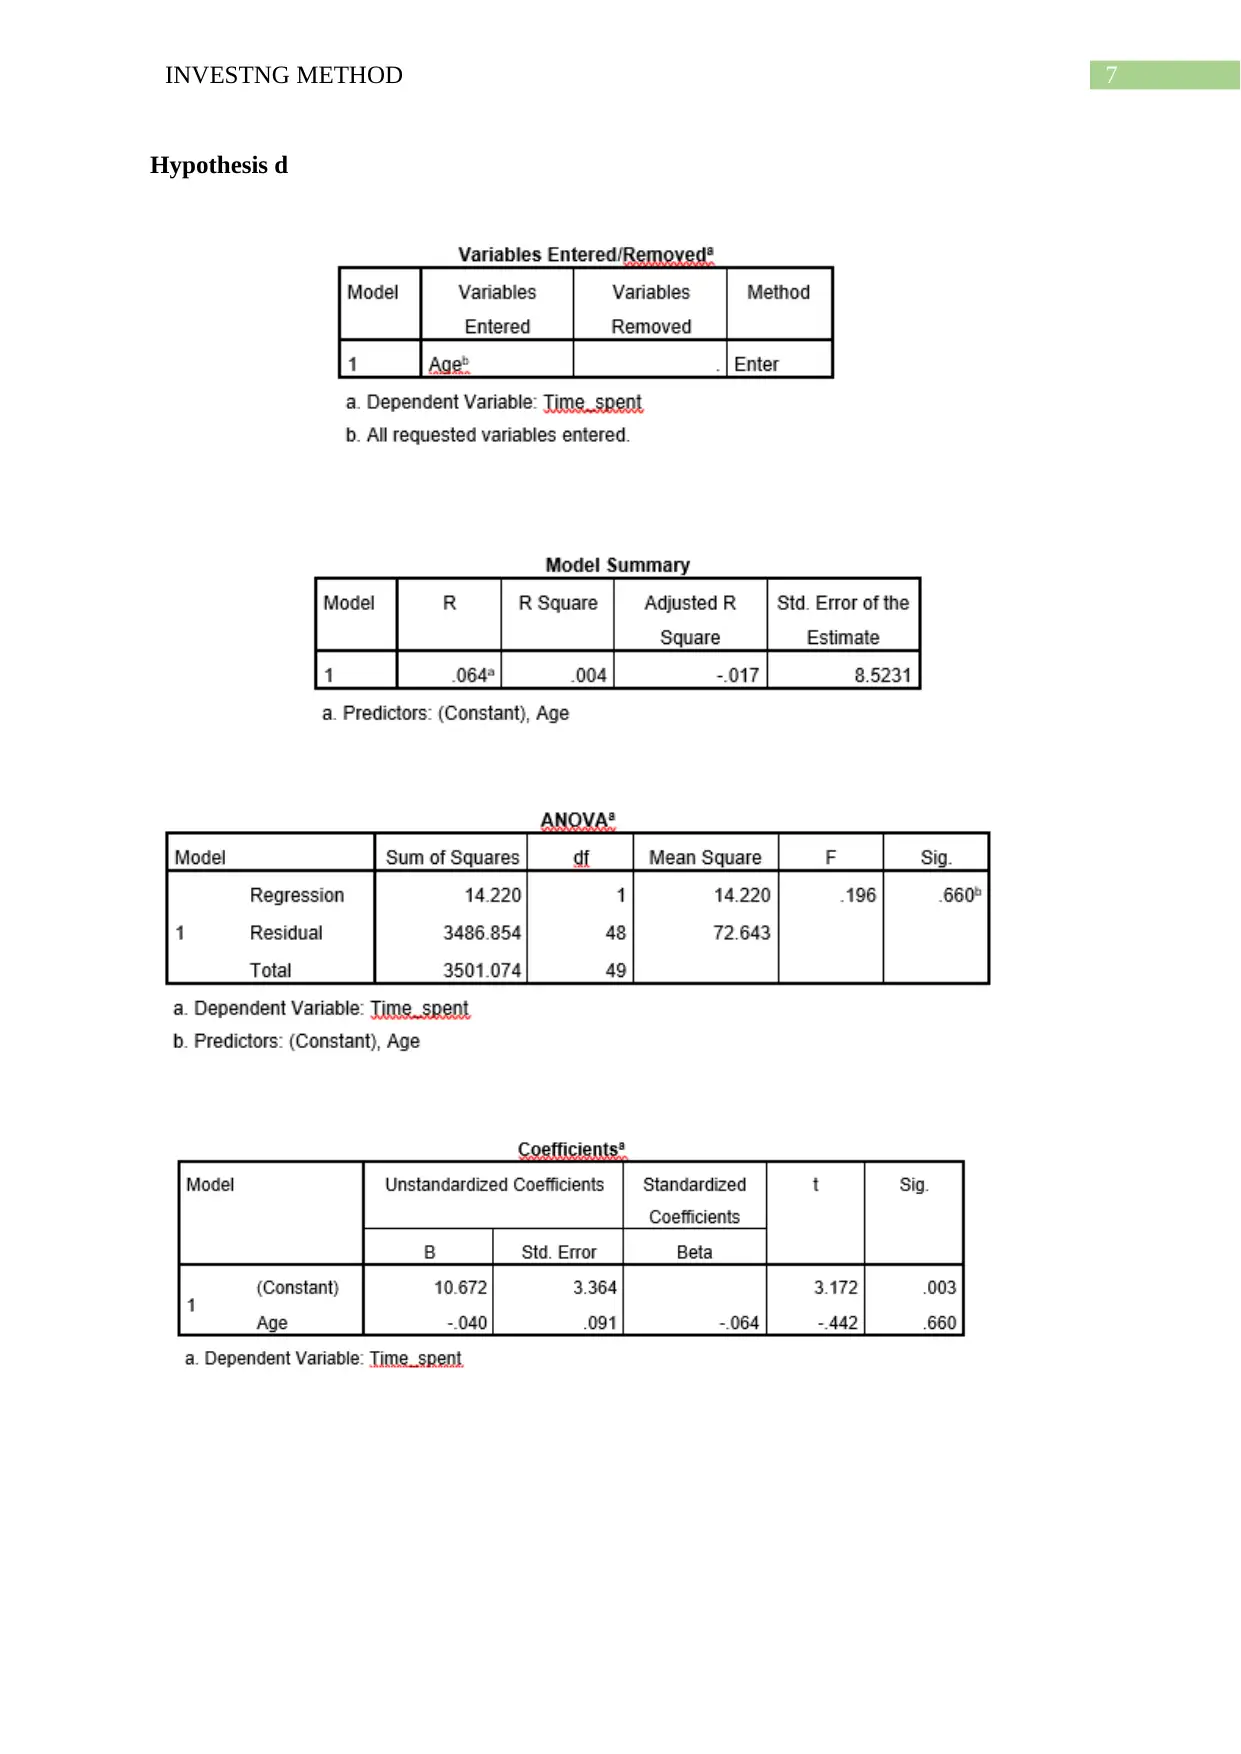
This report presents an analysis of customer behavior in an e-commerce setting, focusing on factors such as gender, age, time spent, attitude, and money spent. The study employed a pilot study to collect data from 50 participants, utilizing a Likert scale for attitude measurement and quantitative data for other variables. Statistical tests, including independent t-tests and regression analysis, were conducted to test four hypotheses: the difference in time spent between high and low spenders, the relationship between attitude and money spent, the difference in spending between genders, and the relationship between age and time spent. The results revealed a significant difference in time spent based on spending levels, while no significant relationships were found between attitude and money spent, or between age and time spent. The analysis, performed using SPSS software, provides valuable insights into customer behavior patterns and their statistical significance within an online shopping context. The report includes descriptive statistics, a sampling strategy, and a detailed methodology for the analysis.
Document Page
Running head: INVESTNG METHOD
Investng Method
Name of the Student
Name of the University
Course ID
tabler-icon-diamond-filled.svg

Paraphrase This Document

Need a fresh take? Get an instant paraphrase of this document with our AI Paraphraser
Document Page
1INVESTNG METHOD
Table of Contents
Answer 1: Hypotheses................................................................................................................2
Hypothesis a...........................................................................................................................2
Hypothesis b...........................................................................................................................2
Hypothesis c...........................................................................................................................2
Hypothesis d...........................................................................................................................3
Answer 2: Descriptive statistics.................................................................................................3
Answer 3: List of Statistical test................................................................................................4
Answer 4: Result of different statistical test..............................................................................4
Answer 5: Result Analysis.........................................................................................................8
Title:...........................................................................................................................................9
Abstract......................................................................................................................................9
Strategy of sampling..................................................................................................................9
Study method...........................................................................................................................10
References................................................................................................................................12
Document Page
2INVESTNG METHOD
Answer 1: Hypotheses
Hypothesis a
Null hypothesis: No significant difference exists in time spent between customers spending
more than the median spend and those spending less than median spend.
Alternative hypothesis: Time spent by customers spending more than median spend is
significantly different from those spending less than median spend.
The above hypothesis states a 2 tailed tests.
Hypothesis b
Null hypothesis: No statistically significant relation exists between attitude and money spend
by customers
Alternative hypothesis: Attitude of customers has a statistically significant relation with
money spend by customers.
The above hypothesis states a 2 tailed tests.
Hypothesis c
Null hypothesis: No significant difference exists in money spent between male and female
customers.
Alternative hypothesis: Money spent by female customers is significantly different from the
money spent by male customers.
The above hypothesis states a 2 tailed tests.
Document Page
3INVESTNG METHOD
Hypothesis d
Null hypothesis: No statistically significant relation exists between age of customers and time
spent by customers.
Alternative hypothesis: Age of customers has a statistically significant relation with time
spend by customers.
The above hypothesis states a 2 tailed tests.
Answer 2: Descriptive statistics
Table 1: Descriptive statistics for Gender
Table 2: Descriptive statistics for Attitude
tabler-icon-diamond-filled.svg

Paraphrase This Document

Need a fresh take? Get an instant paraphrase of this document with our AI Paraphraser
Document Page
4INVESTNG METHOD
Table 3: Descriptive statistics for Time spent, age and money spend
Answer 3: List of Statistical test
Independent sample ‘t’ test: The independent sample t test has been used for testing
hypothesis a and hypothesis c.
Regression Analysis: Testing of hypothesis b and hypothesis d require regression analysis
(Hox, Moerbeek and Van de Schoot 2017).
Answer 4: Result of different statistical test
Hypothesis a
Document Page
5INVESTNG METHOD
Hypothesis b
Document Page
6INVESTNG METHOD
Hypothesis c
tabler-icon-diamond-filled.svg

Paraphrase This Document

Need a fresh take? Get an instant paraphrase of this document with our AI Paraphraser
Document Page
7INVESTNG METHOD
Hypothesis d
Document Page
8INVESTNG METHOD
Answer 5: Result Analysis
Hypothesis a
For testing hypothesis a , independent t test has been performed. The null hypothesis
of the test suggests that there is no significant difference in time spent by customers between
those spend more than median spend and those spending less than median spend. The p value
associated with t statistics is 0.000. The significance value exceeds the p value meaning
rejection of null hypothesis (Pitman 2018). The test result therefore supports the hypothesis
of difference in time spent between customers spending more than median spend and those
spending less than median spend.
Hypothesis b
The second hypothesis tests for existence of significant relation between attitude and
money spend. P value for the coefficient attitude is 0.887. As the p value exceeds 5%
significance level, null hypothesis of no statistically significant relation between attitude and
money spend is accepted (Chatterjee and Hadi 2015). The result therefore does not support
the hypothesis of a significant relation between attitude and money spent.
Hypothesis c
The hypothesis tests the claim that there is no statistically significant difference in
money spent between male and female customers. The p value associated with t statistics is
0.971. The significance value is less the p value, meaning acceptance of null hypothesis
(Heiman 2013). The test result therefore rejects the hypothesis of difference in money spent
between male and female customers.
Hypothesis d
Document Page
9INVESTNG METHOD
The fourth hypothesis tests for existence of significant relation between age and time
spent. P value for the coefficient age is 0.660. As the p value exceeds 5% significance level,
null hypothesis of no statistically significant relation between age and time spent is accepted.
The result therefore does not support the hypothesis of a significant relation between age and
time spent (Carroll 2016).
Title: Analysis of customers’ behavior towards e-commerce store
Abstract
The study analyzes behavior of customers toward online shopping. The web developer
interested in evaluating nature of customer by examining various aspects. The particular areas
of focus include gender; age, time spent, attitude and money spend. For conducting the study,
50 samples are collected, of which 25 are females and 25 are males. Data on attitude, which
is measured on likert scale, shows that attitude of majority of people ranked between 5 and 7.
I the sample, average age of customers is found to be 35 years. Average time spent on
searching for goods is 9.2 minutes with average spending being £7.24. The statistical analysis
conducted on collected sample data indicate that time spent by customers spending more than
median spend differ significantly from those spending less than median spend. Attitude does
not have any statistically significant relation with money spend. Result of statistical test
suggests that average spending by male customers is same as average spending by female
customers. It is also observed that age is not related with time spent.
Strategy of sampling
Sampling refers to the selection of a portion of population covering the research area.
The selected sample is considered as the representative of entire population. Sampling
strategy implies plan that the researcher sets to conduct the research. The sampling strategies
vary depending on objective of research and targeted population. For analyzing customer
tabler-icon-diamond-filled.svg

Paraphrase This Document

Need a fresh take? Get an instant paraphrase of this document with our AI Paraphraser
Document Page
10INVESTNG METHOD
behavior toward online shopping, sample data are collected containing 50 observations. Data
are gathered through pilot study. Pilot study refers to a preliminary study conducted on small
scale with the objective of evaluating time, feasibility, adverse event and improving the
design of the study before performing a full-scale research (Crawley et al. 2013). This kind of
sampling strategy helps to save money and time following an inappropriate research design.
The pilot sampling strategy has been done here keeping in mind several advantages of the
particular method. This kind of sampling strategy helps to save money and time following an
inappropriate research design. It establishes validity of the research based on knowledge of
other scholars in this field. This prevent acceptance of falsified work within the particular
area of study. As this kind of sampling is conducted prior to carrying out large scale research,
it offers important feedback of to the researchers. Based on the feedback the researcher is
able to improve or revise the paper before final conclusion.
Study method
The entire study is based on a quantitative method of data analysis. Quantitative data
of a sample size 50 are collected. Data are collected relating to gender, age, time spent,
money spent. In order to collect data on different attributes a pilot study has been conducted.
Of the different attributes attitude is measured using a Likert scale ranging from 1 to 10.
Time spent is measured in minutes and average spending is measured in pound. Once the data
has been collected statistical tests have been performed for testing hypotheses framed for
addressing research questions (Bluman 2013). The first hypothesis has been framed to test the
whether there exists a significant difference in time spent for customers spending more than
median spend and customers spending less than median spend. The second hypothesis has
been proposed to test significant relation between attitude and money spent. The third
hypothesis tests any significant difference in average spending between male and female. The
last hypothesis is formed to test the significance of relationship between age and money
Document Page
11INVESTNG METHOD
spend. The independent sample t test has been used for testing hypothesis a and hypothesis
c. Testing of hypothesis b and hypothesis d require regression analysis (Darlington and
Hayes 2016). In order to perform the statistical analysis, the software package SPSS has been
used.
chevron_up_icon
1 out of 13
circle_padding
hide_on_mobile
zoom_out_icon
[object Object]