Tesco PLC Customer Churn Prediction Using Marketing Analytics, 2015
VerifiedAdded on 2023/06/06
|15
|3965
|448
Report
AI Summary
This report delves into the analysis of customer churn at Tesco PLC using marketing analytics techniques applied to data from 2015. The primary objective is to identify the key factors contributing to customer churn and develop predictive models to mitigate its impact. The study employs the C&RT (Classification and Regression Trees) model within IBM SPSS Modeler to initially predict churn, leveraging Tesco Clubcard data to understand customer behavior. Subsequently, the RFM (Recency, Frequency, Monetary) model is utilized to validate the findings from the C&RT model, enhancing the accuracy and reliability of churn predictions. The analysis involves data pre-processing, transformation, and mining to extract meaningful insights. The results highlight the significance of understanding customer behavior and implementing targeted retention strategies to reduce churn and improve customer relationship management. The report concludes with recommendations for Tesco PLC based on the insights gained from the churn models and RFM analysis.

Running Head: MARKETING ANALYTICS
Marketing Analytics
Name of the Student
Name of the University
Author Note
Marketing Analytics
Name of the Student
Name of the University
Author Note
Paraphrase This Document
Need a fresh take? Get an instant paraphrase of this document with our AI Paraphraser
1MARKETING ANALYTICS
Table of Contents
Introduction......................................................................................................................................2
Literature Review............................................................................................................................2
Methodology and Empirical Study..................................................................................................5
Data Pre-processing.....................................................................................................................5
Data Transformation....................................................................................................................5
Data Mining.................................................................................................................................5
Results..............................................................................................................................................5
The Churn Model.........................................................................................................................5
RFM Model...............................................................................................................................11
Conclusion and Recommendation.................................................................................................13
Reference.......................................................................................................................................14
2MARKETING ANALYTICS
Introduction
When customers cease their relationship with an organization then such customers are
referred to as customer Churn. Organizations generally refer to investigate such customers when
time has elapsed between the last purchase of such customers. Customer churn is a financial
drain on the organization. They not only lose the customer’s revenue but also the organization
has to invest separately for marketing cost to build a new customer. Thus reducing customer
churn is a very important aspect for organization (Dahiya and Bhatia 2015).
For the survival of an industry the customer is very important. Further customer
relationship is essential for growth of the business. Organizations invest hugely in building
customer relationship. The maturity of a customer can be estimated by the number of customers
it is able to retain (Guo and Qin 2015). In the present assignment we analyse the data set of
Tesco PLC. The organization runs a multinational supermarket chain from Welwyn Garden City,
Hertfordshire, England, United Kingdom. It operates in 12 countries. In 1995 Tesco launched
customer loyalty scheme – Tesco Clubcard. Tesco Clubcard has been cited as being responsible
for growth of the organization. Tesco Clubcard owners gain one point for every £1 spent. Thus,
Tesco is able to collect information on customer behaviour. This also enables Tesco to retain
customers through targeted campaigns.
In the present assignment information from 1st January 31st December 2015 has been
collected. The assignment is an attempt to predict factors responsible for churn of the customers
based on different factors. The churn model is predicted with the C&RT model. The decision
tree model is predicted with the aid of C&RT model. The RFM model was further used to
evaluate the prediction from C&RT models.
Literature Review
The growth of internet has fuelled the growth of customers. However, this growth has
also given rise to information about business. Today a customer can get information of a
particular product sold by different brands easily. Thus a customer unsatisfied with a particular
service provider then he can easily jump providers. This processes of jumping service providers
is defined as churn. One of the most important measure of lost number of customers is Customer
Churn. The prediction of customer churn thus becomes essential in order to maintain loyalty of
customers. The process also helps in improving customer relationship management (CRM).
Various factors are responsible for customer churn. Hence the prediction of customer churn
becomes important since evaluation of the factors would help to provide information on causes
of Churn (Almana, Aksoy and Alzahrani 2014).
According to Coussement, Lessmann and Verstraeten (2017) the presence of a saturated
market due to the fierce competition amongst organization and continuous revised offerings by
organizations to customers has initiated the process of customer defection. Thus it has become
imperative that a targeted program be developed by business houses to prevent defection. But
with the presence of huge amount of data there is little scope that such information can be
derived manually. Thus one has to take the help of advanced algorithms and computers to find
factors responsible for preventing defection.
⊘ This is a preview!⊘
Do you want full access?
Subscribe today to unlock all pages.
Trusted by 1+ million students worldwide
3MARKETING ANALYTICS
To predict Churn of Customers different prediction techniques may be used. Logistic
regression technique is used to predict churn by connecting the factors affecting churn with
probability of occurrence of customer churn.
p ( y=1|x1 ,… , xn )=f ( y )
The most popular predict model used to predict churn is the decision tree model. The
decision tree provides a chart which represents the relationship of the variables. The decision tree
is created by starting from the root node. The gain ratio is calculated from information gained. In
order to build a decision tree, CART, CHAID and C5.0 may be used (Hassouna, Elyas and Abou
Trab 2015). There are many advantages of using decision tree. The most important advantage is
it provides easy visualisation of the information. Further it is a non-parametric approach to
assessing customer churn. Moreover, no prior assumptions is required to calculate Churn. In
addition, decision tree can process both numerical as well as categorical data (Song and Ying
2015). However, decision tree suffers from certain disadvantages also. The formation of a
decision tree is dependent on interaction between variables and their attributes. Thus, the more
complex the variable interaction the more complex the decision tree. In addition, complex
decision trees are difficult to visualise. Furthermore, it suffers from robustness due to training
and testing data sets (Priyama 2013).
According to Patil et al., (2017) customer churn occurs when the concerned customer
terminates his association with the organization. Moreover, with online businesses coming into
vouge the organization can get real time information towards interaction of the customer with the
website. Churn generates a loss of revenue to the organization in terms of revenue due from the
organization according to the researchers. Moreover, there also is a loss in terms of marketing
loss since the organization needs to find another customer. Prediction models for churn are thus
essential to understand the behaviour of the customer. The records provide for attributes which
are essential for predicting churn as well as time of churn of the customers. With finances being
involved in customer churn hence the accuracy of prediction of churn become relevant. With
higher accuracy in prediction of churn the organization can initiate proactive action to prevent
the process.
According to Jahromi, Stakhovych and Ewing (2014) management of churn by
organizations is a two pronged strategy. The classical theory on churn management proposes to
target those customers who have the highest probability to defect. Thus identifying churners and
trying to prevent the process through incentives or inducements is the classical process. The
more modern theory suggests to target customers who have the highest potential for profit. The
profit margin generated from the customers can be grouped on the basis of profits. Thus the
overall return from such customers is selected and thus a retention campaign may be initiated.
Further, according to the researcher’s prediction of churn is difficult in a B2B business since
customers are non-contractual. Thus in the absence of any binding on the customer to be loyal to
the organization the prediction of timing of churn becomes difficult.
For the CART method the Gini index is used measuring impurity. The Entropy and Gini
index is calculated as: (Sahin, Bulkan and Duman 2013)
Paraphrase This Document
Need a fresh take? Get an instant paraphrase of this document with our AI Paraphraser
4MARKETING ANALYTICS
Entropy=∑
i=1
2
¿ ¿
Gini=1−∑
i=1
2
(− pi )2
where pi is the relative frequency of class i.
In the making of decision tree using CART, nodes are created. All variables are checked
for their suitability of split. For categorical variables multiple splits are possible. For numerical
variables binary splits are done. The minimum misclassification cost of each class is calculated
and the least misclassification variable is used to conduct the split. The misclassification of a
node associated with class and probability for a numerical variable is given as:
Pnode= Clas s1
Clas s1 +Clas s2
Once the C&RT model is built the accuracy of the model needs to be predicted. This can
be done through splitting the initial data set into training and testing set. The model is initially
build on the training set. After the model is build the model the accuracy of prediction of the
model is evaluated on the testing set. The accuracy and precision of the model provides
information on the predictability of the model.
RFM is the ideal mechanism of splitting customer on the basis of information. The
information required by RFM method is recent purchase of the customer and the value of the
purchase. The higher value of the purchase and the higher the frequency of purchase provides
higher values of RFM (Sarvari et al., 2016).
The advantages of RFM are its combination with customer segmentation, it can predict
customer churn in short terms thus preventing churn (Dursun and Caber 2016). However, it
suffers from disadvantage since it uses only three criteria for calculation while other factors are
not considered. Higher correlation between monetary value and frequency of purchase is only
considered. Non-profit customer is rarely considered in the process.
According to Chen, Hu and Hsieh (2015) management of churn by organizations is
essential to minimize loss by businesses. Churn also is helpful in retaining high-value customers;
thus the organization is able to maximize loss. According to the 80/20 rule 20% of customers of
an organization provides for 80% of the revenue to the organization. Thus retaining of high value
customers who provide are loyal to the organization pays. The identification of factors of RFM
varies according to the industry and business. Thus, identification of the variables representing
RFM for each industry becomes a tedious process. Moreover, according to the researcher
customer loyalty can be affected by the longevity of the association of the customer with the
organization.
The word RFM stands for Recency, Frequency and Monetary. Recency signifies how
lately the customer has made a purchase. Frequency signifies the occurrence of purchase of
customers. Monetary value signifies the amount of money spent by the customer.
Research by Zaki et al., (2016) recommends RFM model since it transforms the
transactional information (purchase behaviour) of the customer to profit of the business. Thus
5MARKETING ANALYTICS
information on customer’s behaviour is segregated on the basis of purchasing behaviour. In the
initial stage the customers are grouped which is preceded by providing ranks to the customers.
Customers with high recency values earn a low score. Similarly, customers with low recency
values earn high scores. This process is followed since the more recent the purchase by a
customer the more valuable he is to the organization. Similar steps are followed for frequency
and monetary values. Thus is this process each customer receives a RFM score.
Methodology and Empirical Study
Data Pre-processing
The information for churn in the dataset was a result of automatic recording by computers. Thus
all information was present in the dataset i.e., there was less chance of missing data. Thus at the
pre-handling stage presence of missing information was manually observed for the present
research.
Data Transformation
Data transformation refers to the situation of converting data from one format to another
format. This process becomes essential when information from one source is required for another
source. In the present case prior information for churn as generated from the C&RT model was
required to be transformed for suitability in RFM model.
Data Mining
The quantification of churn was carried out with the help of two different processes. In
the first stage IBM SPSS modeller was used. C&ART model of IBM SPSS Modeler was used to
model the churn of the client in light of the information collected by TESCO. To model churn of
customers the training dataset provided for preliminary investigation was used. The dataset
provided was imported into IBM SPSS Modeler. The data was post-processed with “type” filed
operation. In this operation “churn” was set the role as the “target” variable and “ID” was given
the role as “none.” Further the “C&AR” model was selected and integrated into the model
building process. Thus, the relevant model for prediction of churn was generated from the
dataset. After the initial model was build, the model was further analysed and graphs and charts
were generated.
For the second stage the information as derived from IBM SPSS Modeler was validated.
The validation of the C&AR model was done with the help of RFM model. The process to
validate the model was done using MS EXCEL. Two step Clustering technique was used in the
RFM model. This process was used since the requirement was to group the clients on the basis of
churn.
Results
The Churn Model
The initial churn of the customers is build using the given model:
⊘ This is a preview!⊘
Do you want full access?
Subscribe today to unlock all pages.
Trusted by 1+ million students worldwide
6MARKETING ANALYTICS
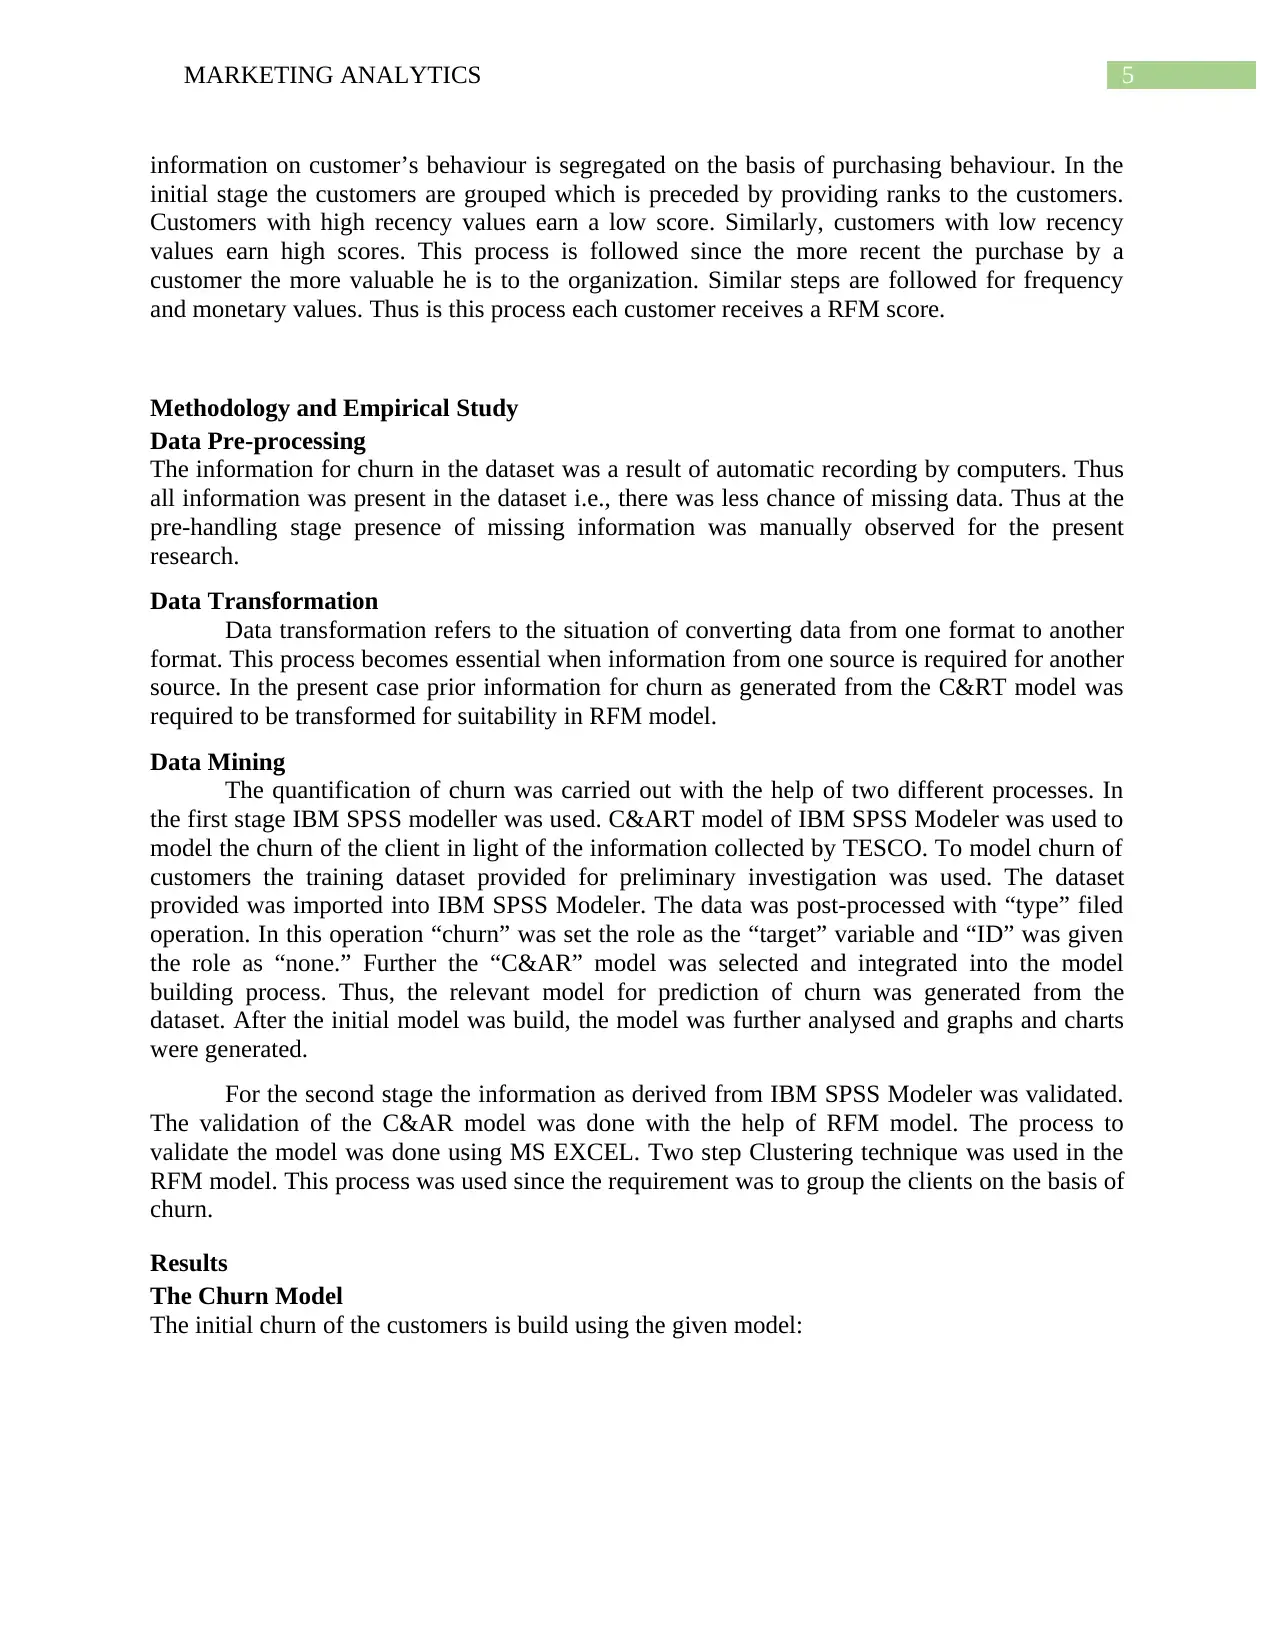
Figure 1: The initial C&RT Model
The above C&RT model provides information regarding the churn of the customers from the
training dataset.
The model was subsequently changed to accommodate bot training and testing data set.
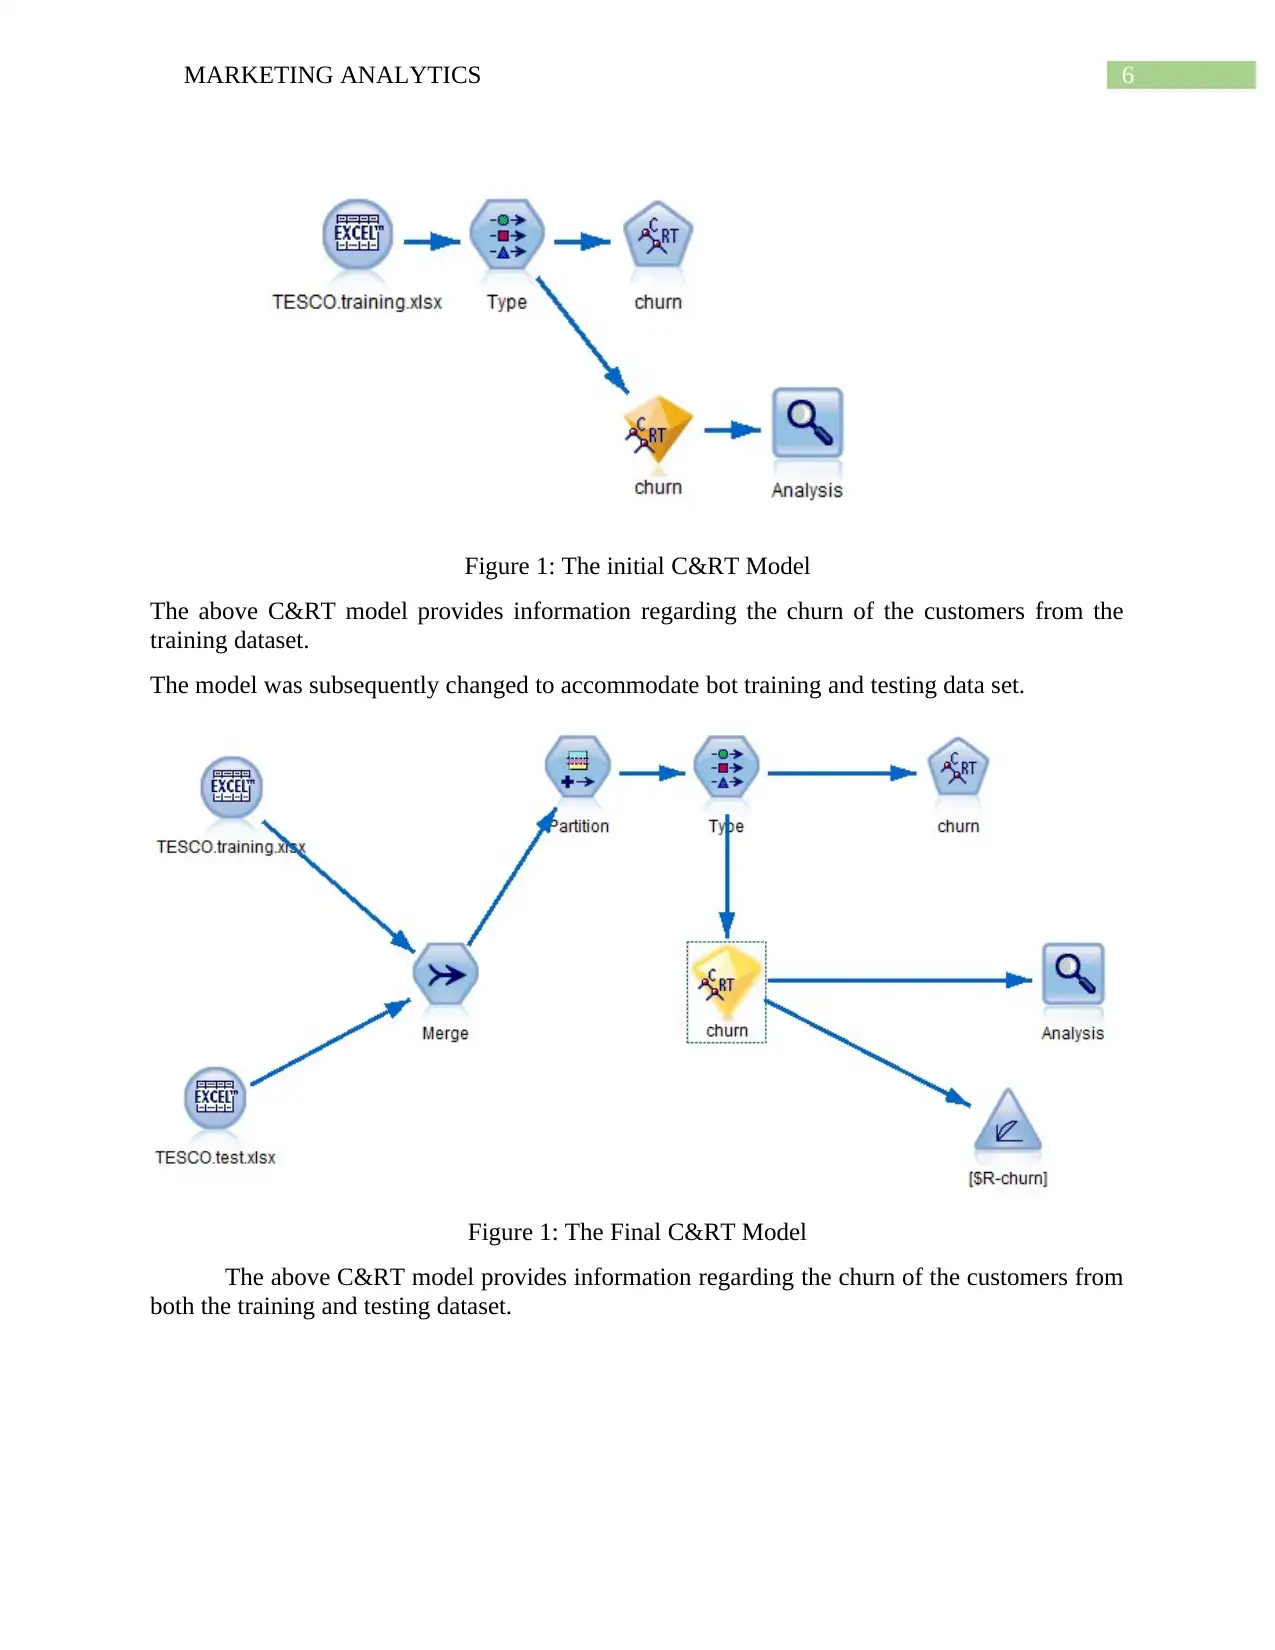
Figure 1: The Final C&RT Model
The above C&RT model provides information regarding the churn of the customers from
both the training and testing dataset.
Figure 1: The initial C&RT Model
The above C&RT model provides information regarding the churn of the customers from the
training dataset.
The model was subsequently changed to accommodate bot training and testing data set.
Figure 1: The Final C&RT Model
The above C&RT model provides information regarding the churn of the customers from
both the training and testing dataset.
Paraphrase This Document
Need a fresh take? Get an instant paraphrase of this document with our AI Paraphraser
7MARKETING ANALYTICS
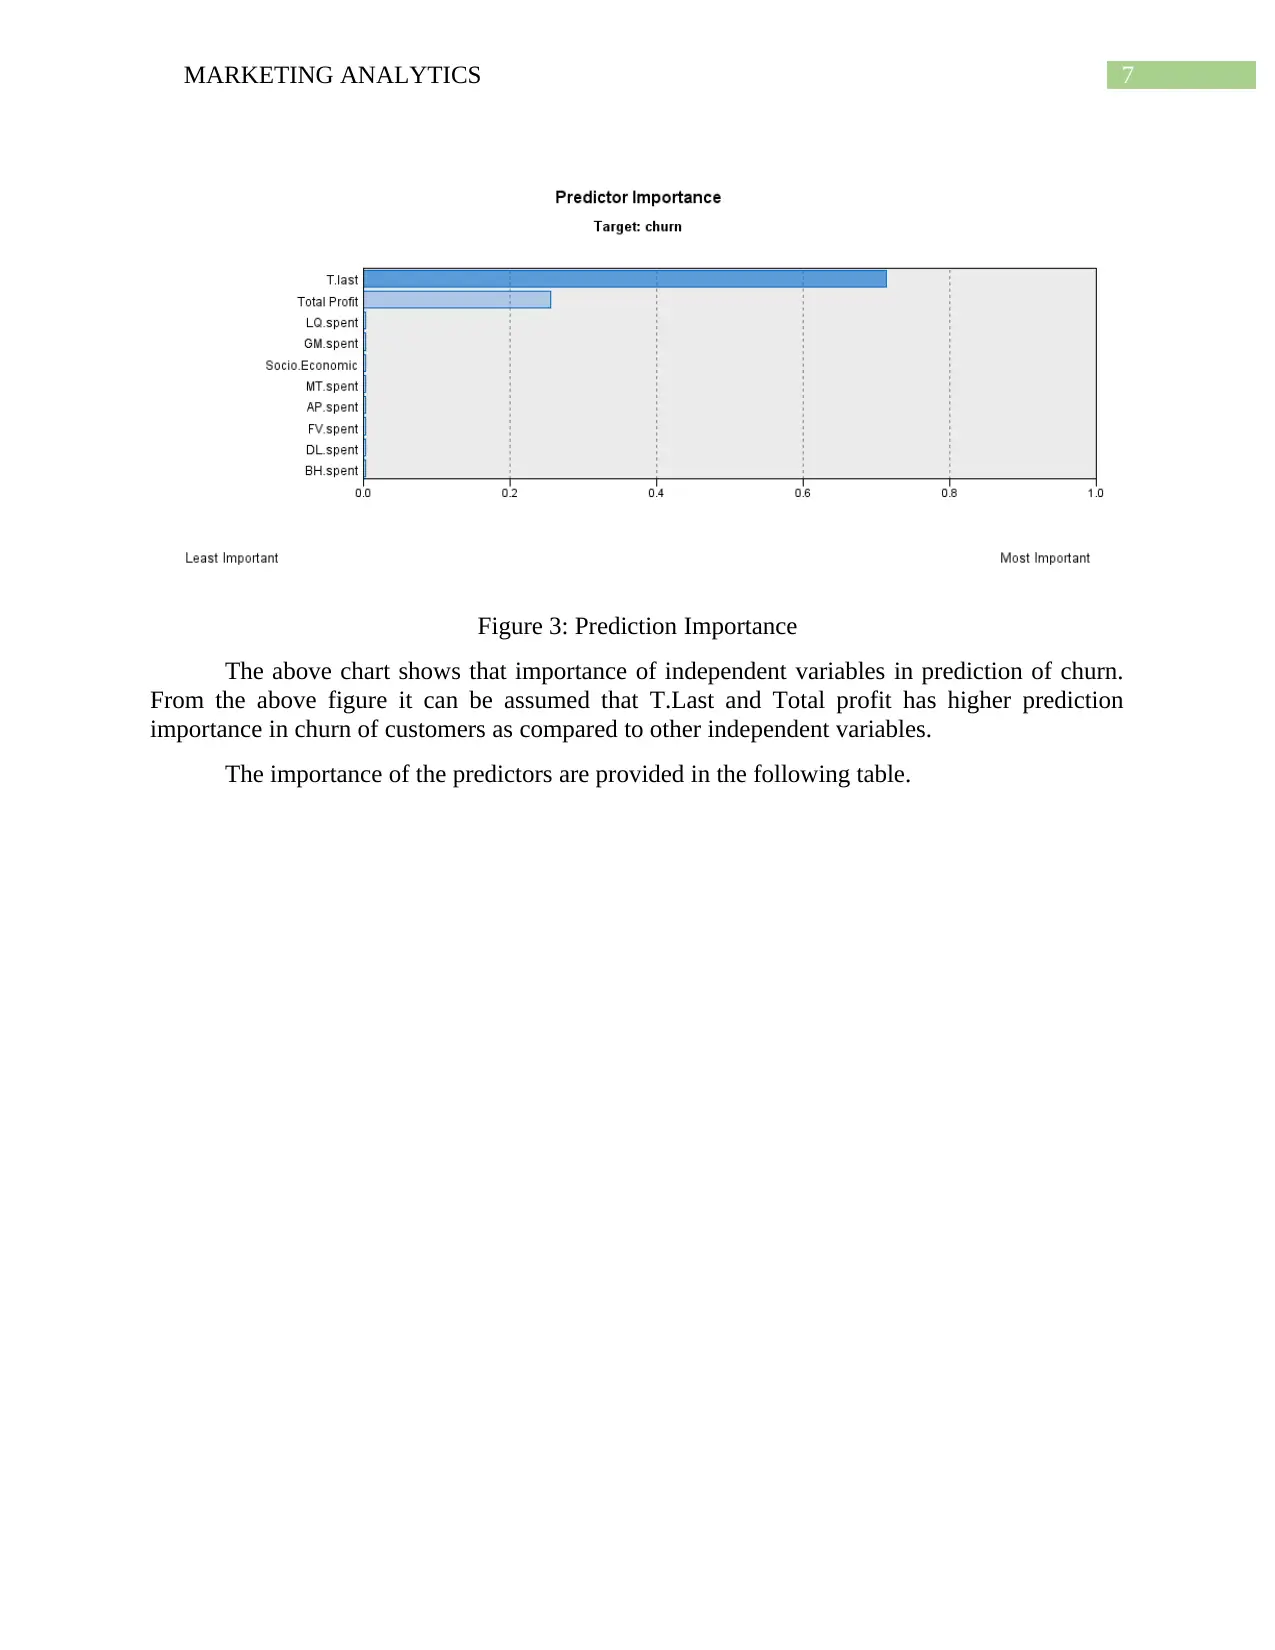
Figure 3: Prediction Importance
The above chart shows that importance of independent variables in prediction of churn.
From the above figure it can be assumed that T.Last and Total profit has higher prediction
importance in churn of customers as compared to other independent variables.
The importance of the predictors are provided in the following table.
8MARKETING ANALYTICS
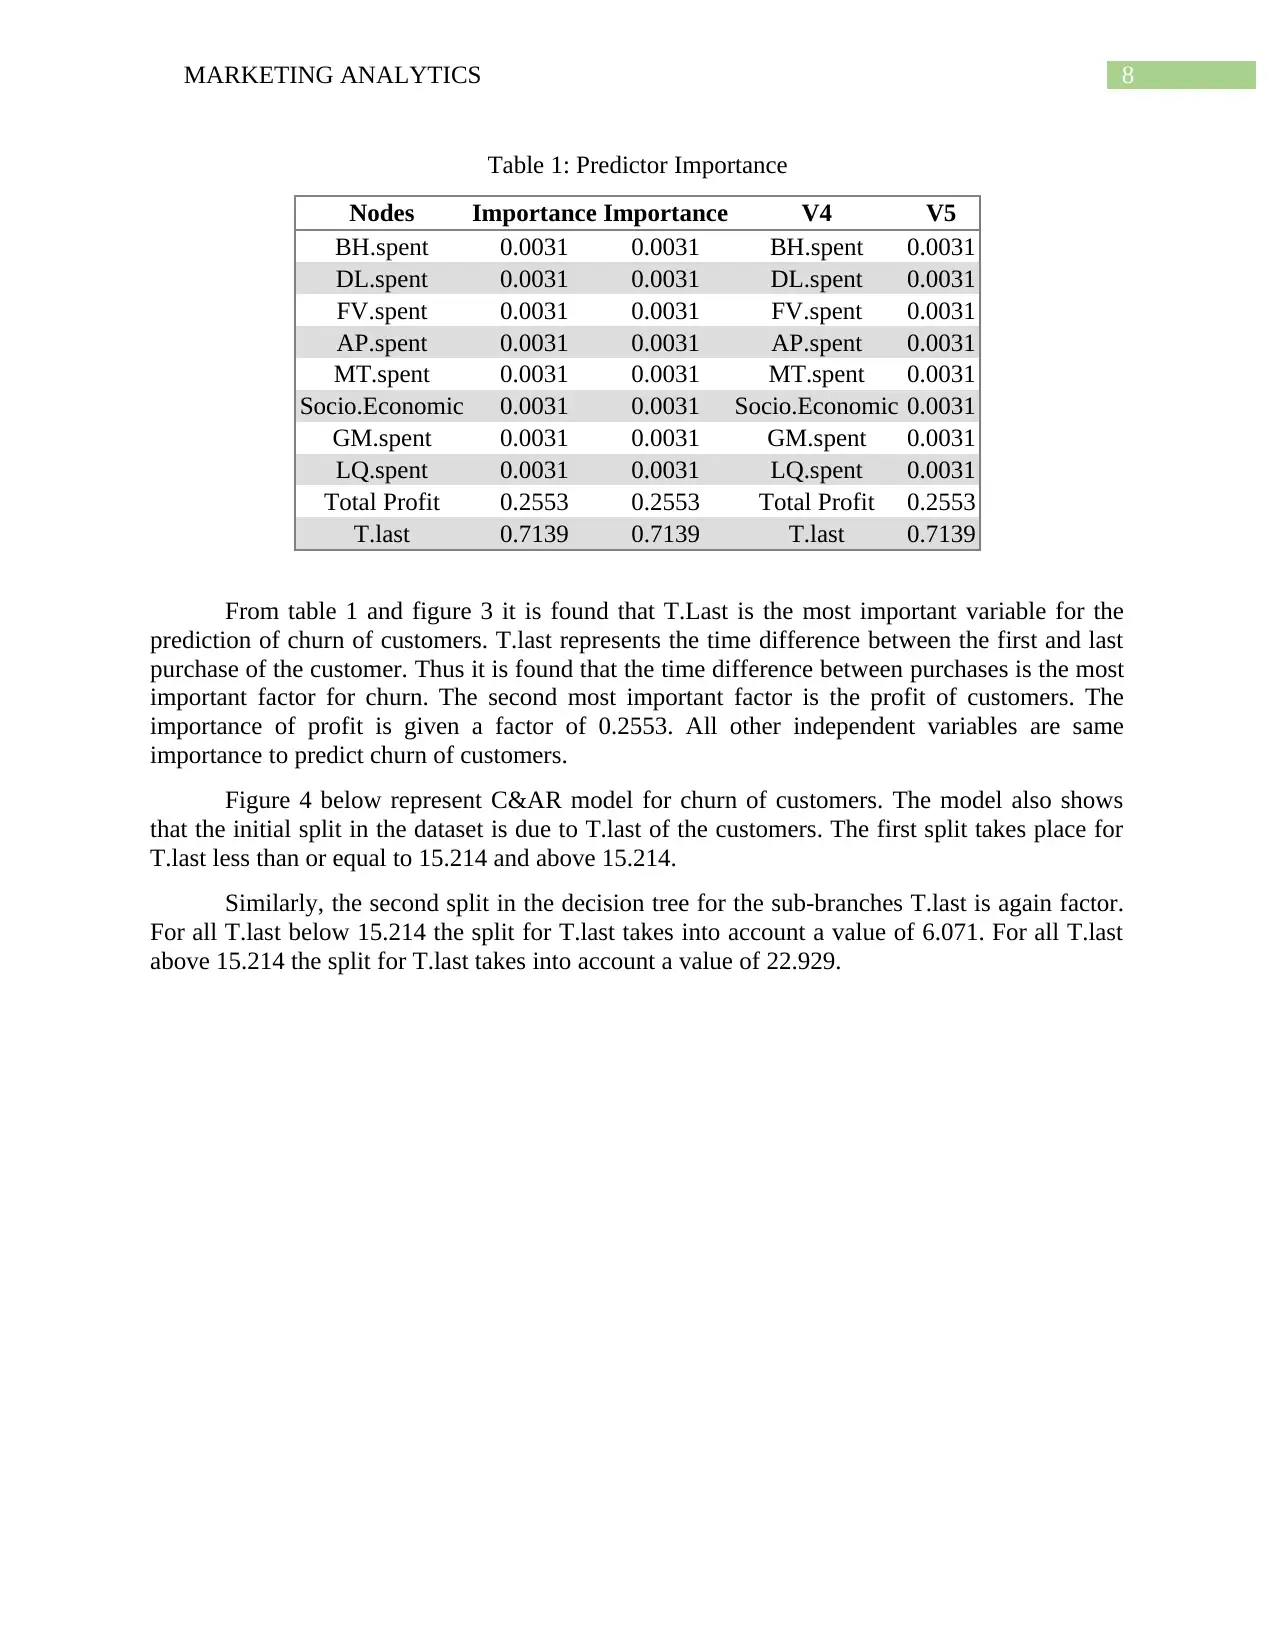
Table 1: Predictor Importance
Nodes Importance Importance V4 V5
BH.spent 0.0031 0.0031 BH.spent 0.0031
DL.spent 0.0031 0.0031 DL.spent 0.0031
FV.spent 0.0031 0.0031 FV.spent 0.0031
AP.spent 0.0031 0.0031 AP.spent 0.0031
MT.spent 0.0031 0.0031 MT.spent 0.0031
Socio.Economic 0.0031 0.0031 Socio.Economic 0.0031
GM.spent 0.0031 0.0031 GM.spent 0.0031
LQ.spent 0.0031 0.0031 LQ.spent 0.0031
Total Profit 0.2553 0.2553 Total Profit 0.2553
T.last 0.7139 0.7139 T.last 0.7139
From table 1 and figure 3 it is found that T.Last is the most important variable for the
prediction of churn of customers. T.last represents the time difference between the first and last
purchase of the customer. Thus it is found that the time difference between purchases is the most
important factor for churn. The second most important factor is the profit of customers. The
importance of profit is given a factor of 0.2553. All other independent variables are same
importance to predict churn of customers.
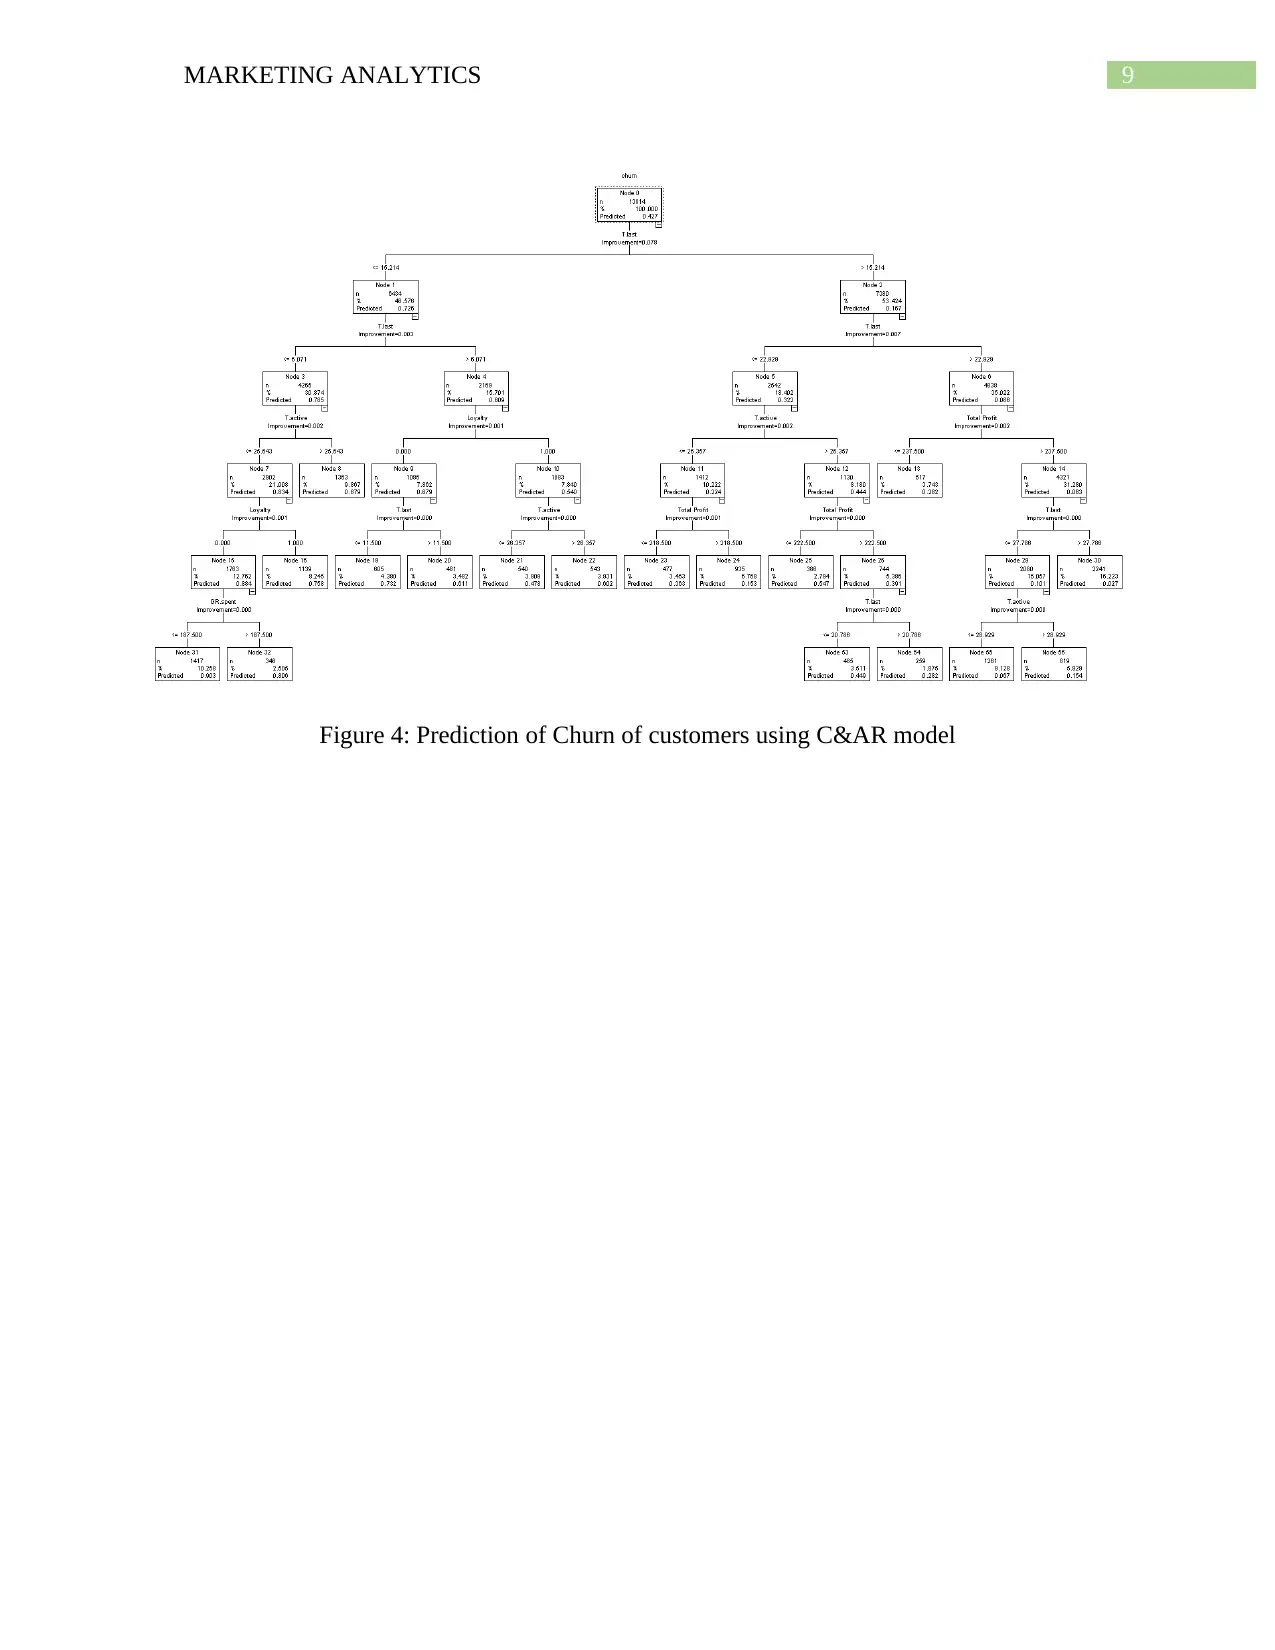
Figure 4 below represent C&AR model for churn of customers. The model also shows
that the initial split in the dataset is due to T.last of the customers. The first split takes place for
T.last less than or equal to 15.214 and above 15.214.
Similarly, the second split in the decision tree for the sub-branches T.last is again factor.
For all T.last below 15.214 the split for T.last takes into account a value of 6.071. For all T.last
above 15.214 the split for T.last takes into account a value of 22.929.
Table 1: Predictor Importance
Nodes Importance Importance V4 V5
BH.spent 0.0031 0.0031 BH.spent 0.0031
DL.spent 0.0031 0.0031 DL.spent 0.0031
FV.spent 0.0031 0.0031 FV.spent 0.0031
AP.spent 0.0031 0.0031 AP.spent 0.0031
MT.spent 0.0031 0.0031 MT.spent 0.0031
Socio.Economic 0.0031 0.0031 Socio.Economic 0.0031
GM.spent 0.0031 0.0031 GM.spent 0.0031
LQ.spent 0.0031 0.0031 LQ.spent 0.0031
Total Profit 0.2553 0.2553 Total Profit 0.2553
T.last 0.7139 0.7139 T.last 0.7139
From table 1 and figure 3 it is found that T.Last is the most important variable for the
prediction of churn of customers. T.last represents the time difference between the first and last
purchase of the customer. Thus it is found that the time difference between purchases is the most
important factor for churn. The second most important factor is the profit of customers. The
importance of profit is given a factor of 0.2553. All other independent variables are same
importance to predict churn of customers.
Figure 4 below represent C&AR model for churn of customers. The model also shows
that the initial split in the dataset is due to T.last of the customers. The first split takes place for
T.last less than or equal to 15.214 and above 15.214.
Similarly, the second split in the decision tree for the sub-branches T.last is again factor.
For all T.last below 15.214 the split for T.last takes into account a value of 6.071. For all T.last
above 15.214 the split for T.last takes into account a value of 22.929.
⊘ This is a preview!⊘
Do you want full access?
Subscribe today to unlock all pages.
Trusted by 1+ million students worldwide
9MARKETING ANALYTICS
Figure 4: Prediction of Churn of customers using C&AR model
Figure 4: Prediction of Churn of customers using C&AR model
Paraphrase This Document
Need a fresh take? Get an instant paraphrase of this document with our AI Paraphraser
10MARKETING ANALYTICS
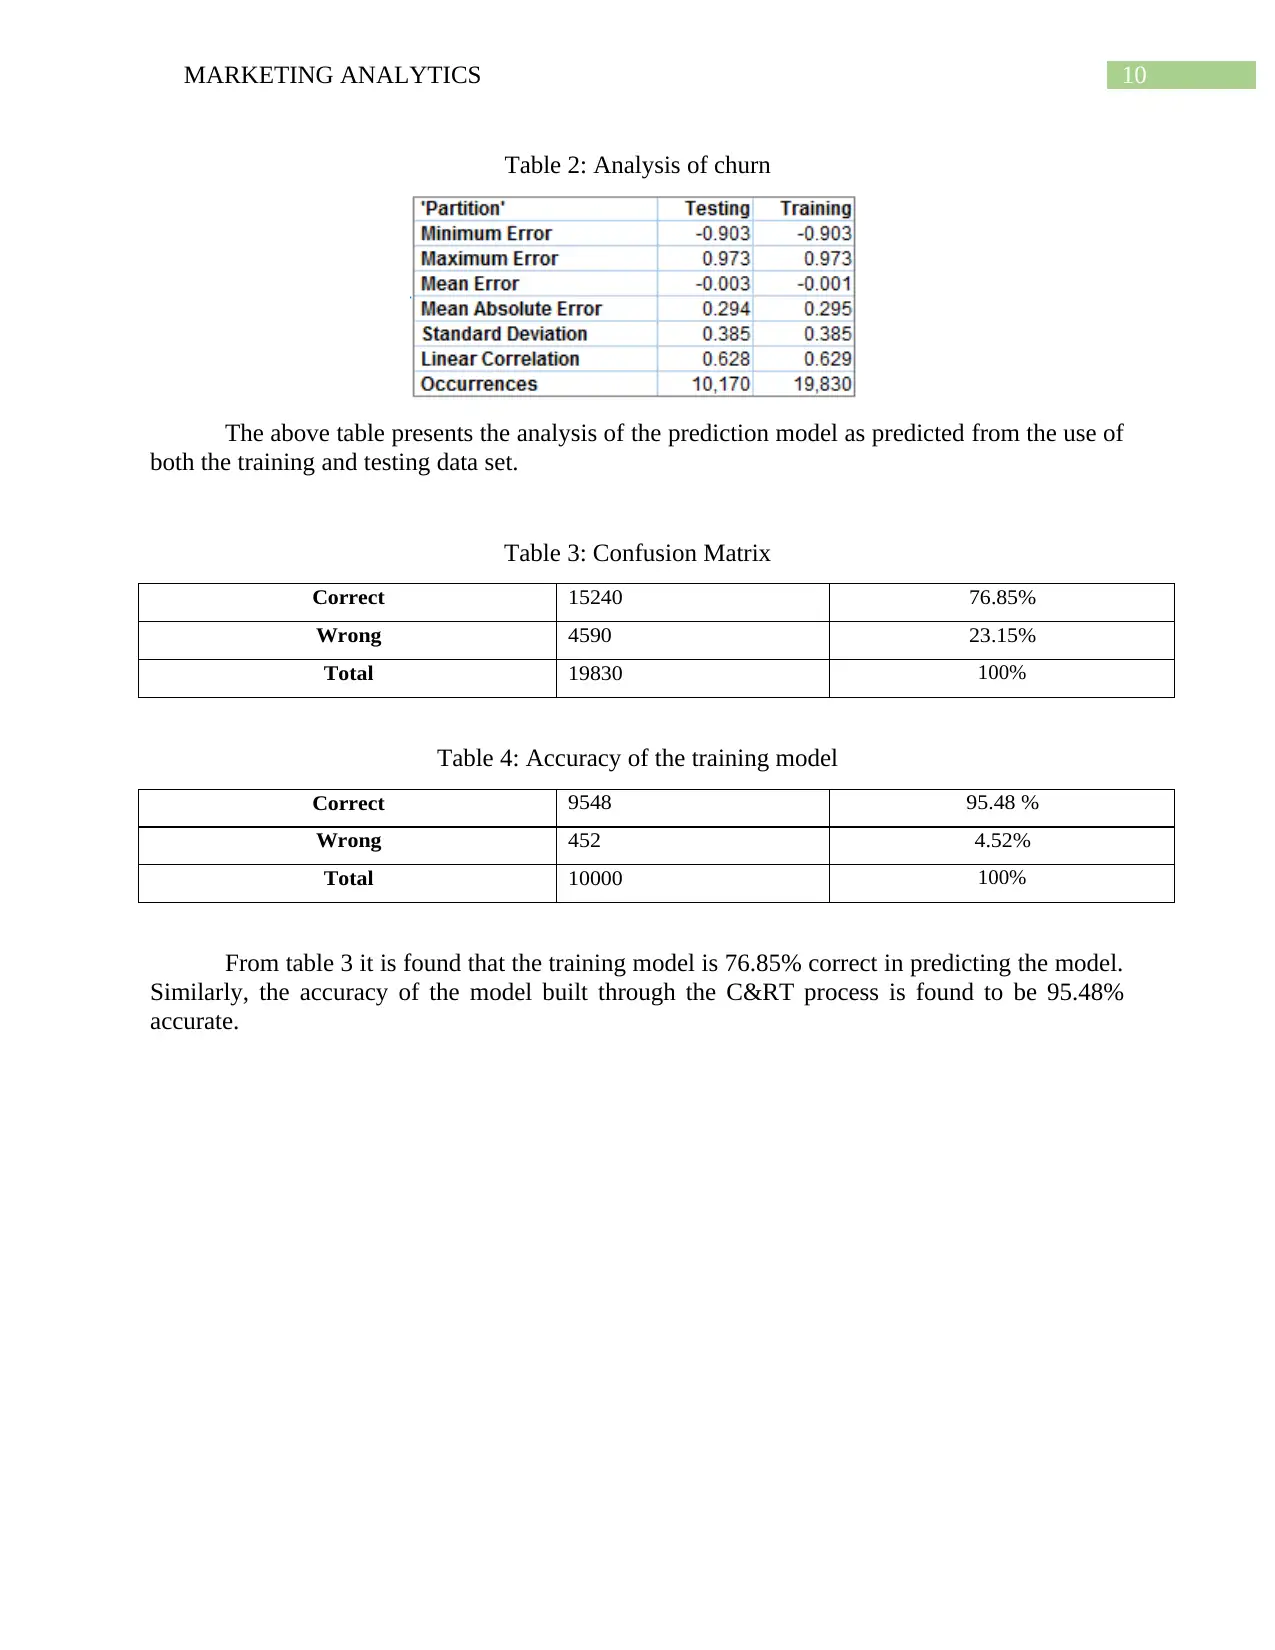
Table 2: Analysis of churn
The above table presents the analysis of the prediction model as predicted from the use of
both the training and testing data set.
Table 3: Confusion Matrix
Correct 15240 76.85%
Wrong 4590 23.15%
Total 19830 100%
Table 4: Accuracy of the training model
Correct 9548 95.48 %
Wrong 452 4.52%
Total 10000 100%
From table 3 it is found that the training model is 76.85% correct in predicting the model.
Similarly, the accuracy of the model built through the C&RT process is found to be 95.48%
accurate.
11MARKETING ANALYTICS
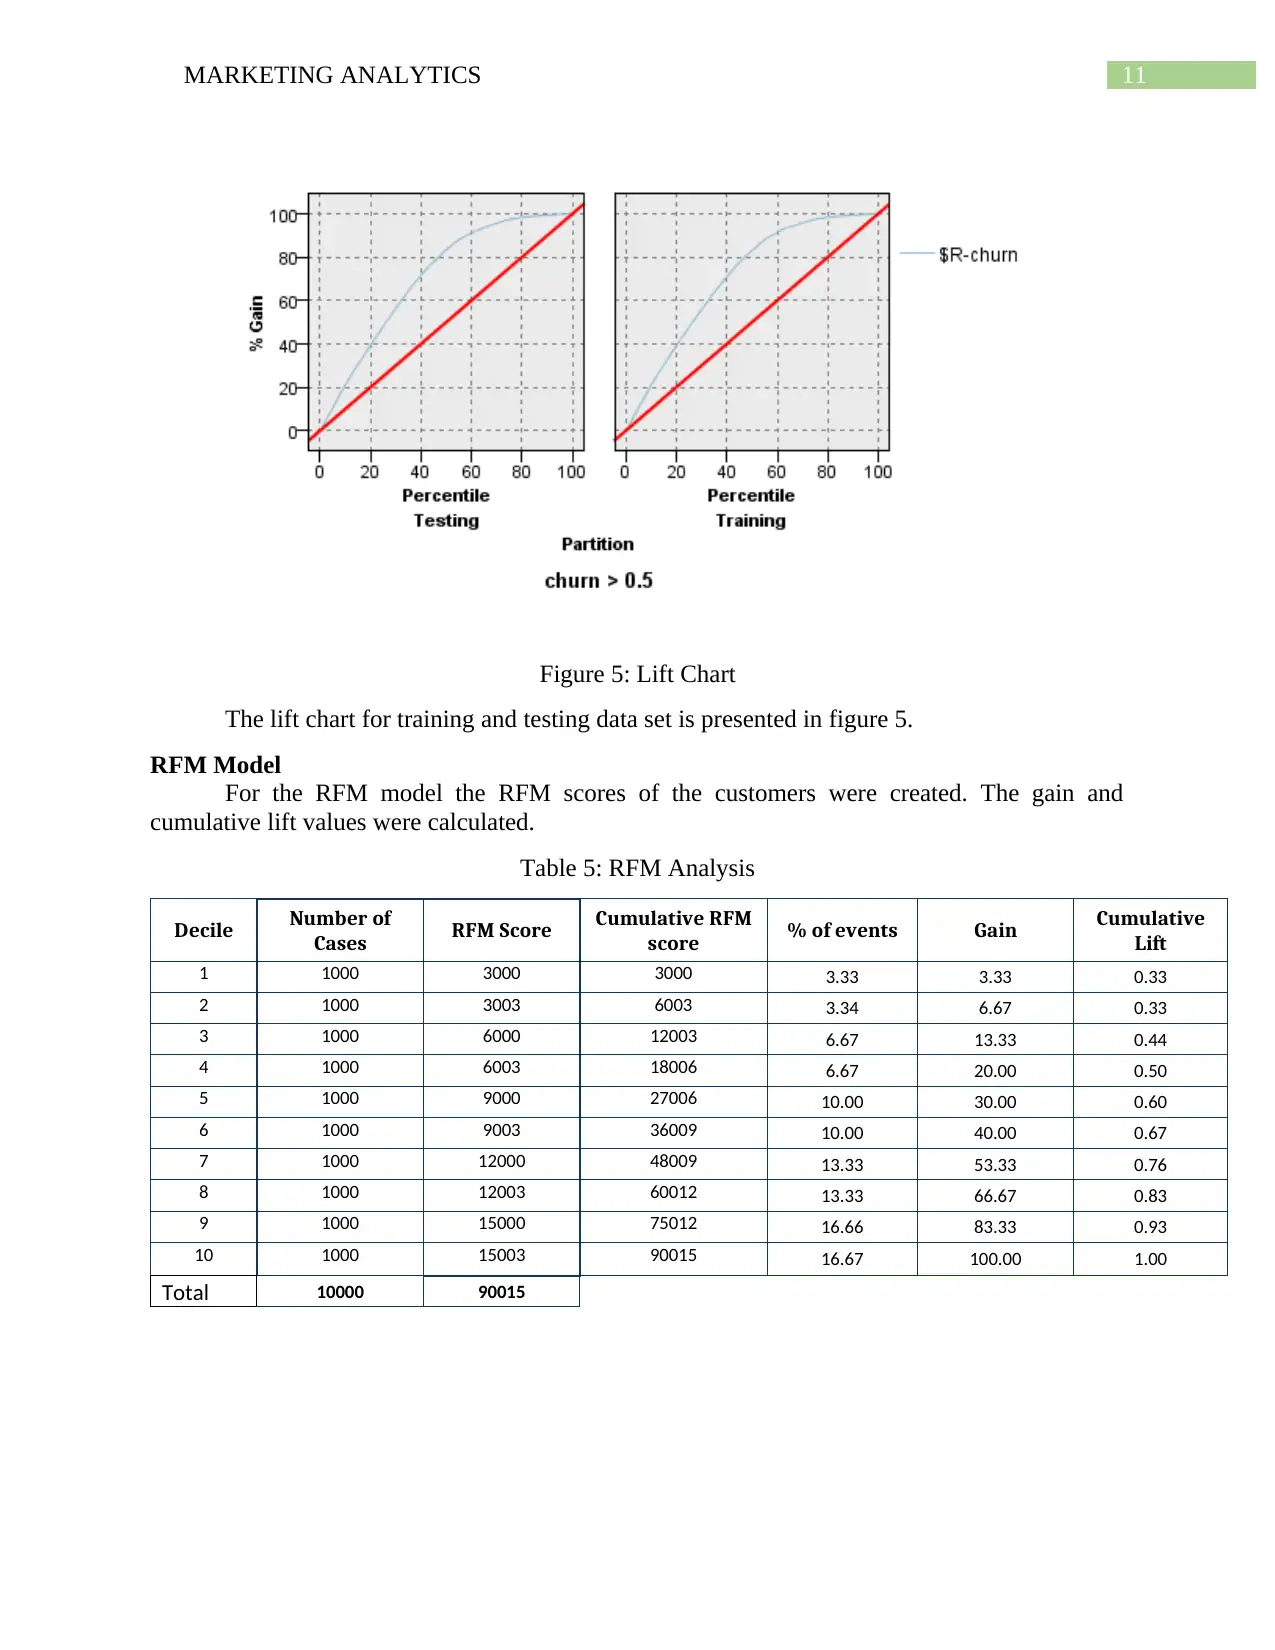
Figure 5: Lift Chart
The lift chart for training and testing data set is presented in figure 5.
RFM Model
For the RFM model the RFM scores of the customers were created. The gain and
cumulative lift values were calculated.
Table 5: RFM Analysis
Decile Number of
Cases RFM Score Cumulative RFM
score % of events Gain Cumulative
Lift
1 1000 3000 3000 3.33 3.33 0.33
2 1000 3003 6003 3.34 6.67 0.33
3 1000 6000 12003 6.67 13.33 0.44
4 1000 6003 18006 6.67 20.00 0.50
5 1000 9000 27006 10.00 30.00 0.60
6 1000 9003 36009 10.00 40.00 0.67
7 1000 12000 48009 13.33 53.33 0.76
8 1000 12003 60012 13.33 66.67 0.83
9 1000 15000 75012 16.66 83.33 0.93
10 1000 15003 90015 16.67 100.00 1.00
Total 10000 90015
⊘ This is a preview!⊘
Do you want full access?
Subscribe today to unlock all pages.
Trusted by 1+ million students worldwide
1 out of 15
Related Documents


Your All-in-One AI-Powered Toolkit for Academic Success.
+13062052269
info@desklib.com
Available 24*7 on WhatsApp / Email
![[object Object]](/_next/static/media/star-bottom.7253800d.svg)
Unlock your academic potential
Copyright © 2020–2026 A2Z Services. All Rights Reserved. Developed and managed by ZUCOL.