Data Science: Customer Churn Model Evaluation Assignment
VerifiedAdded on  2022/11/07
|12
|1656
|101
Homework Assignment
AI Summary
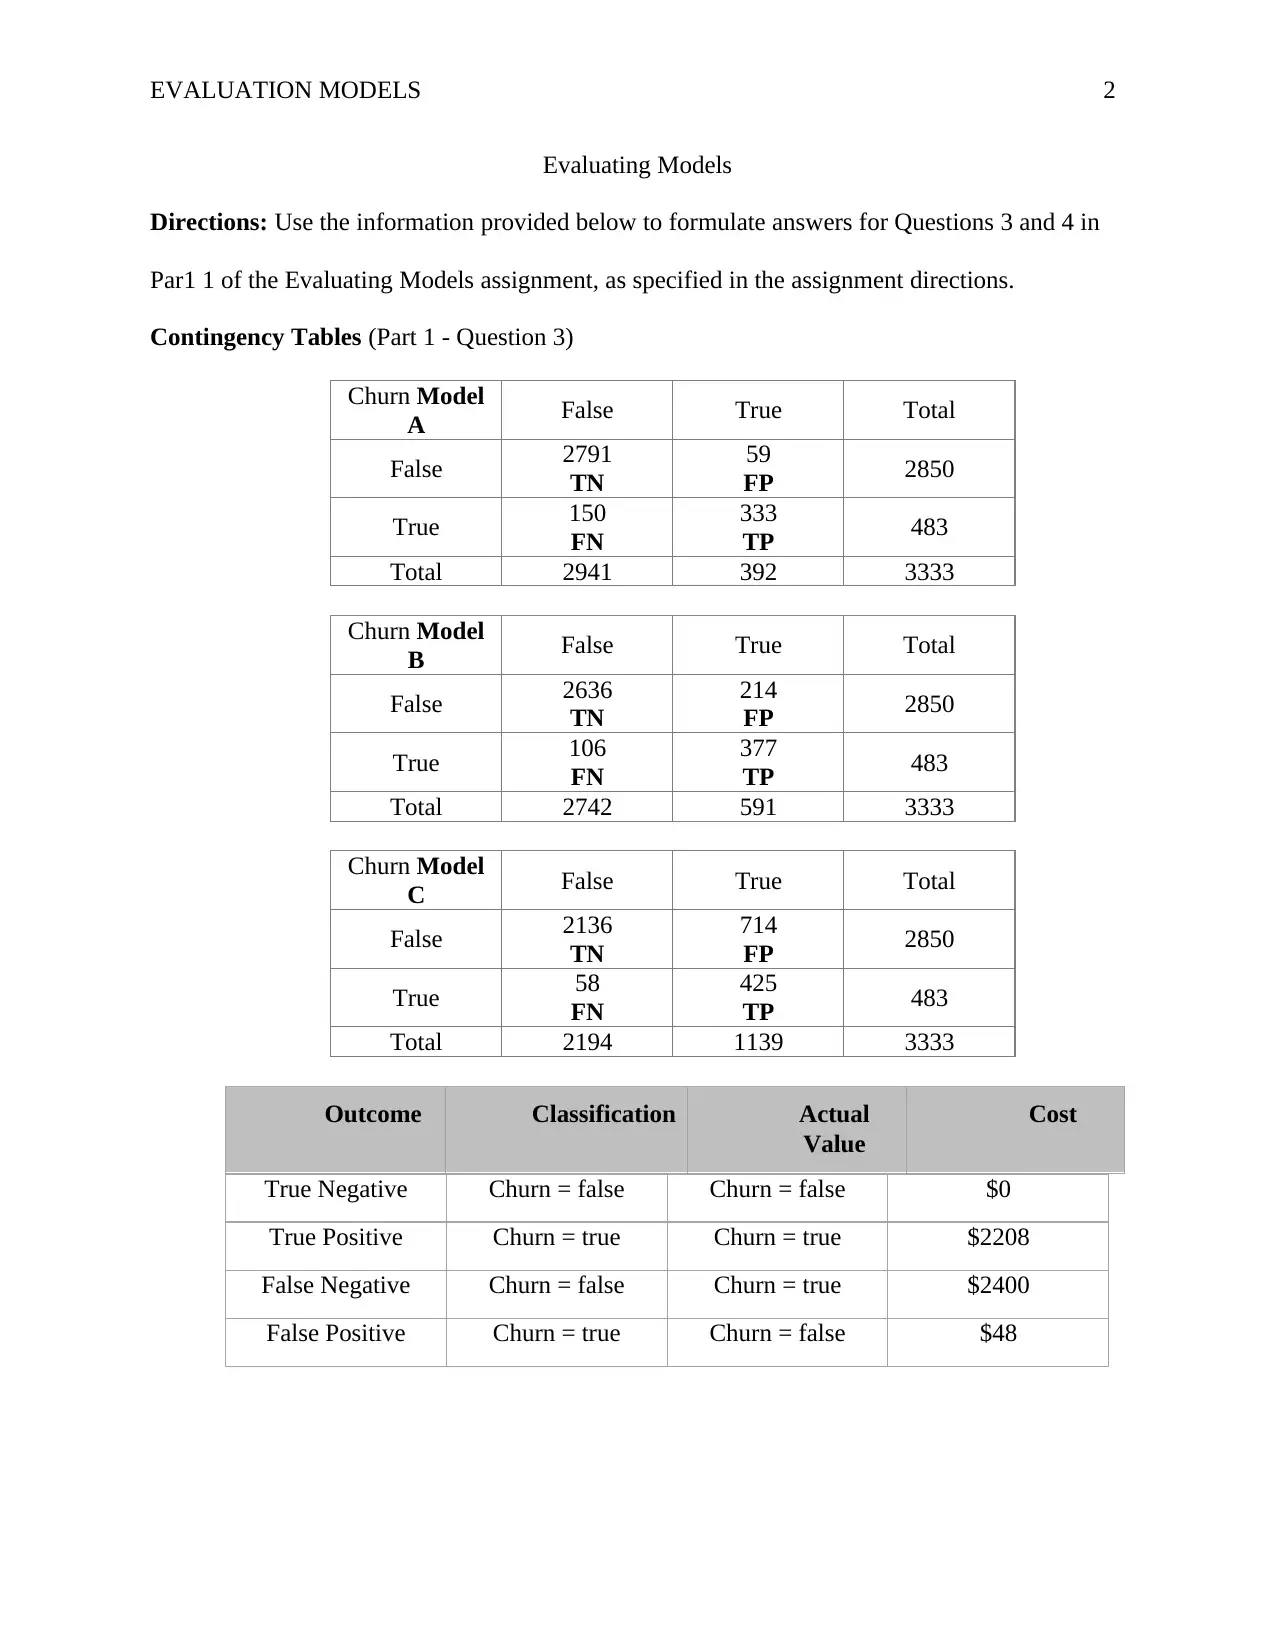
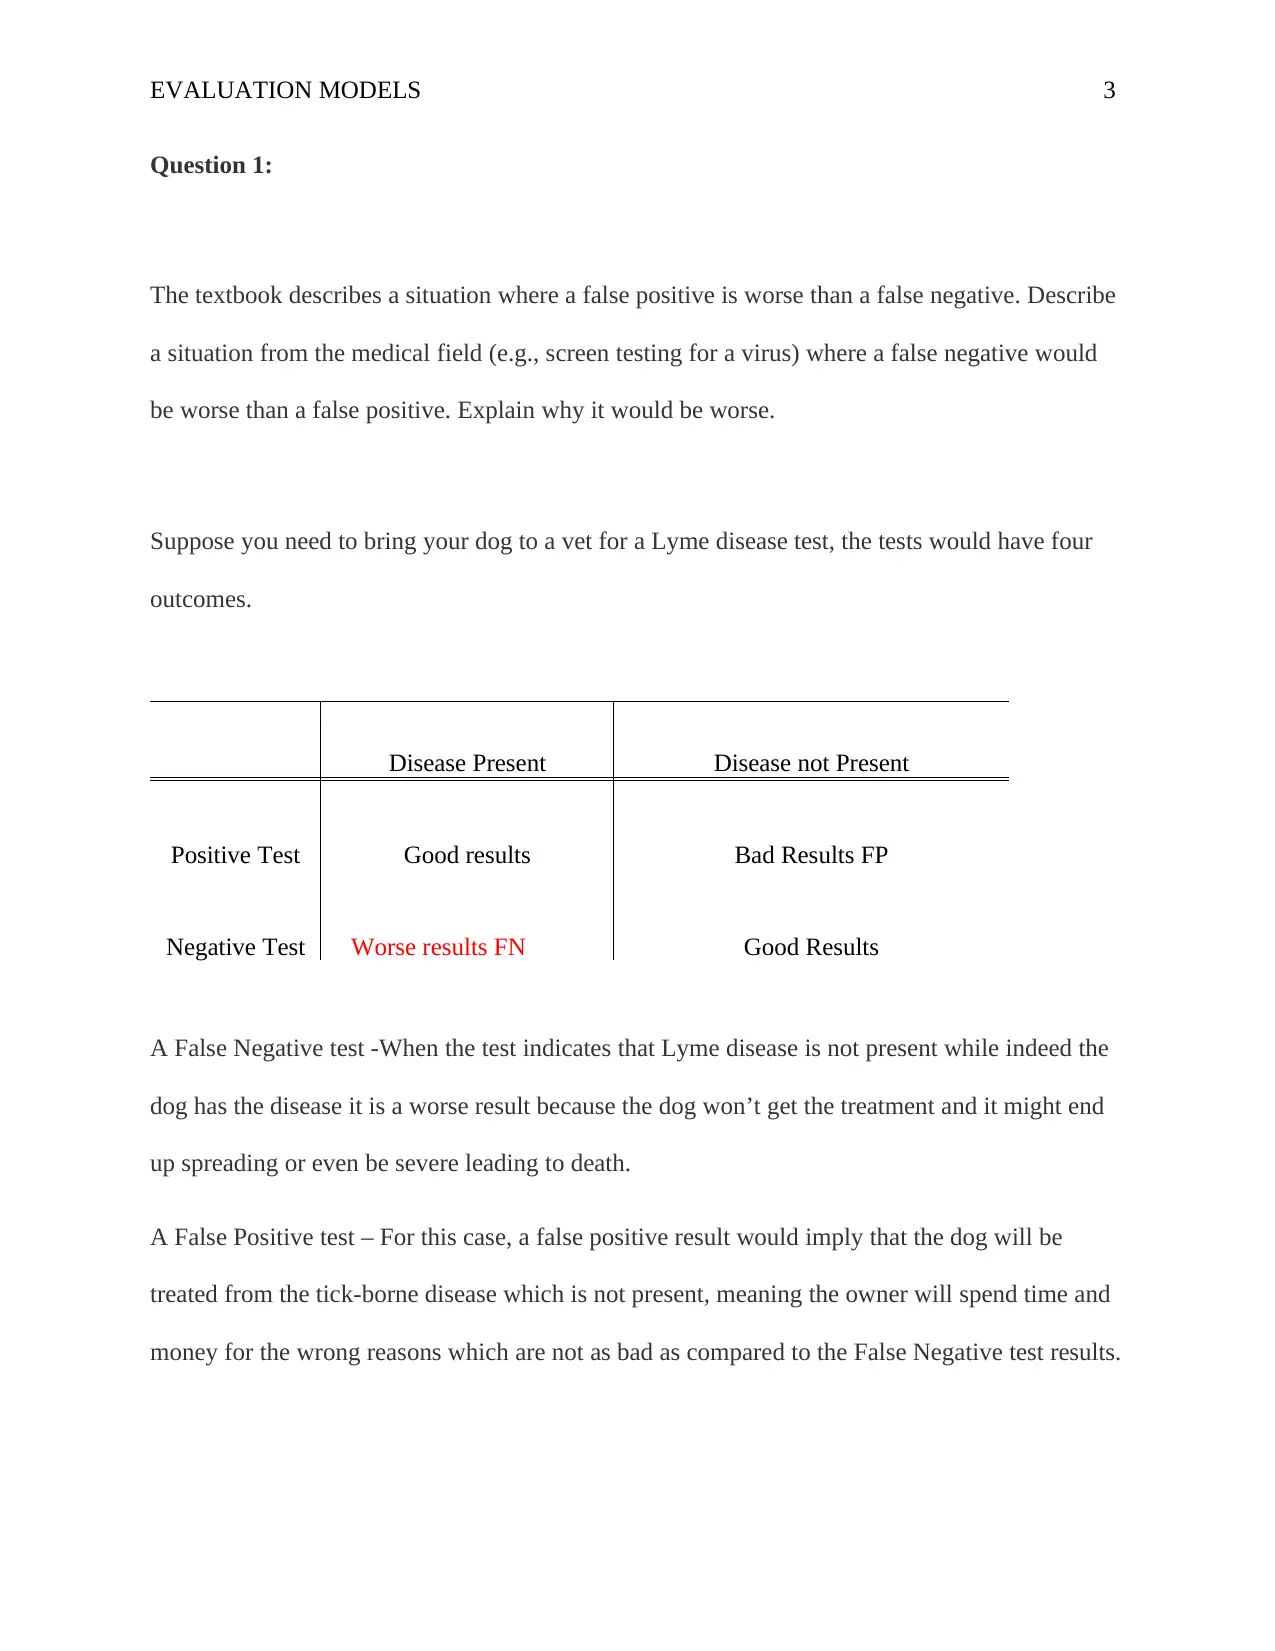
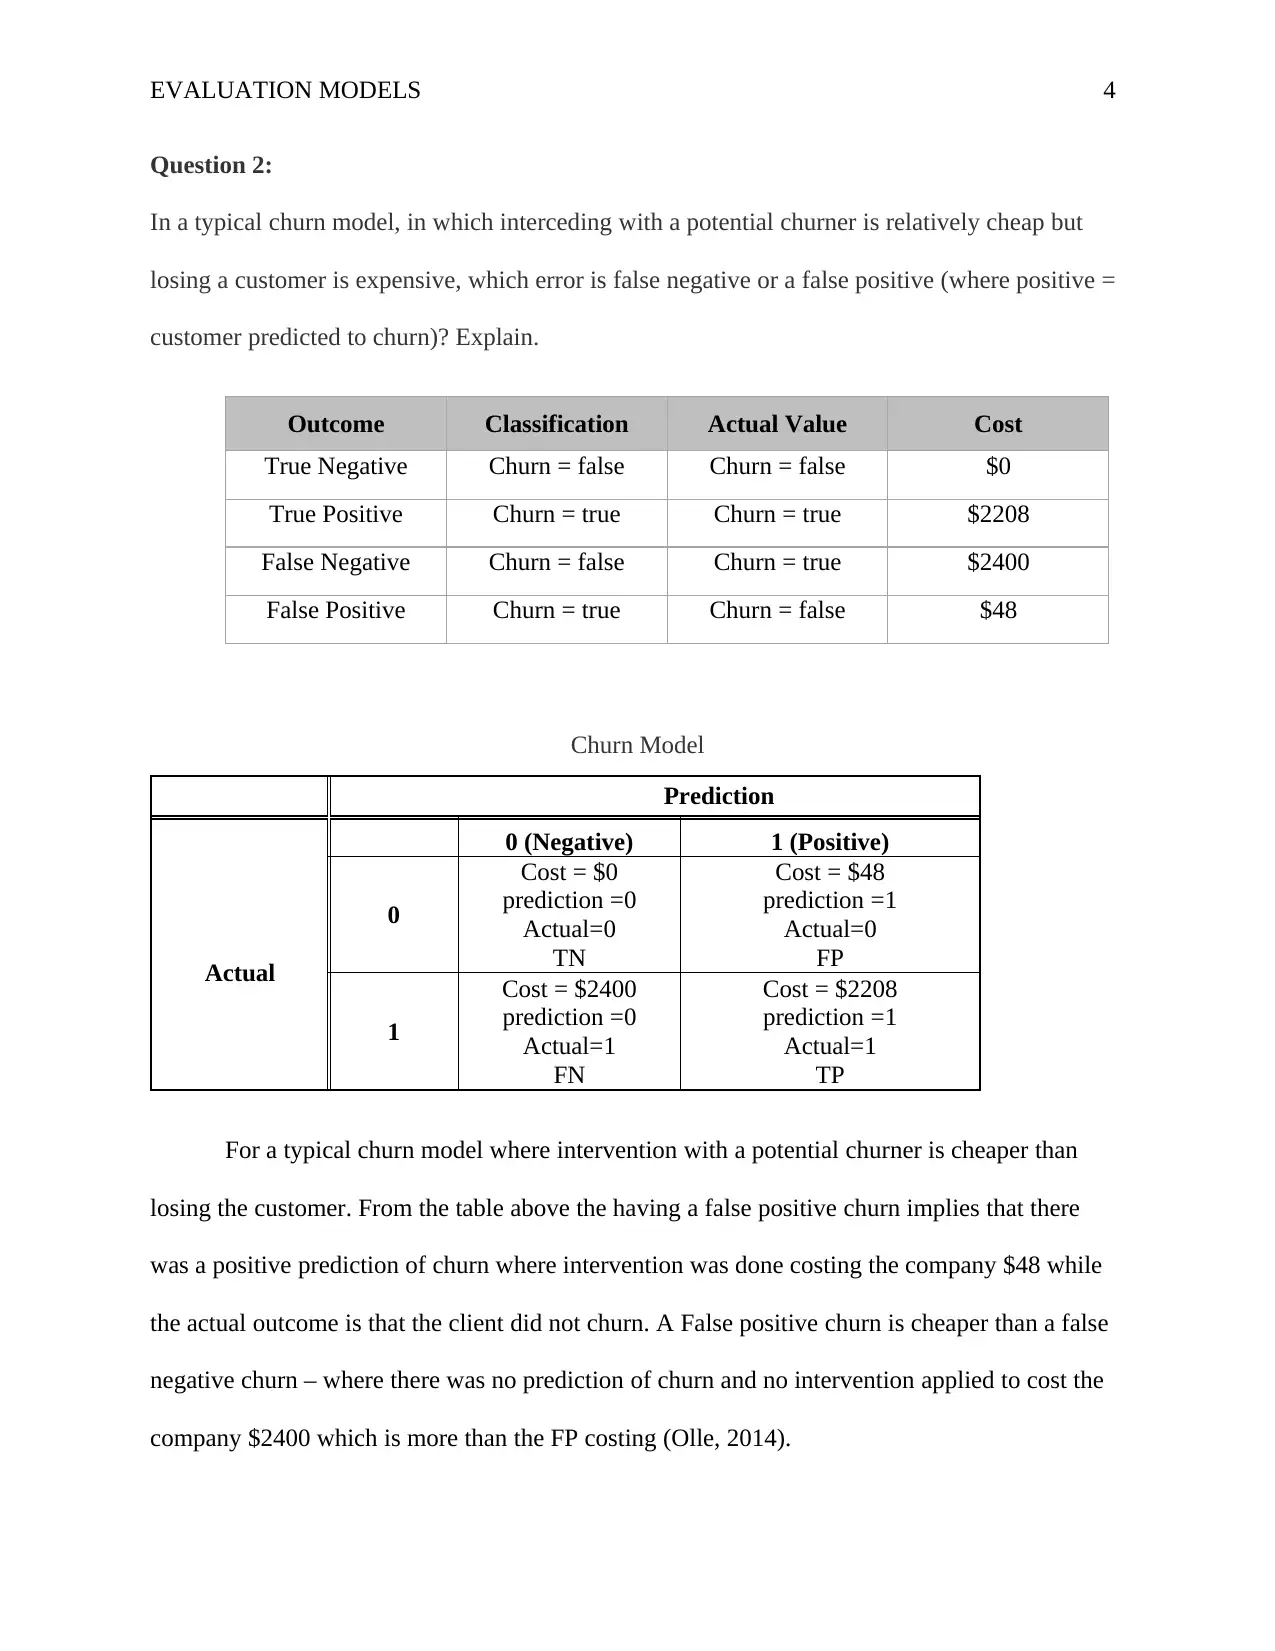
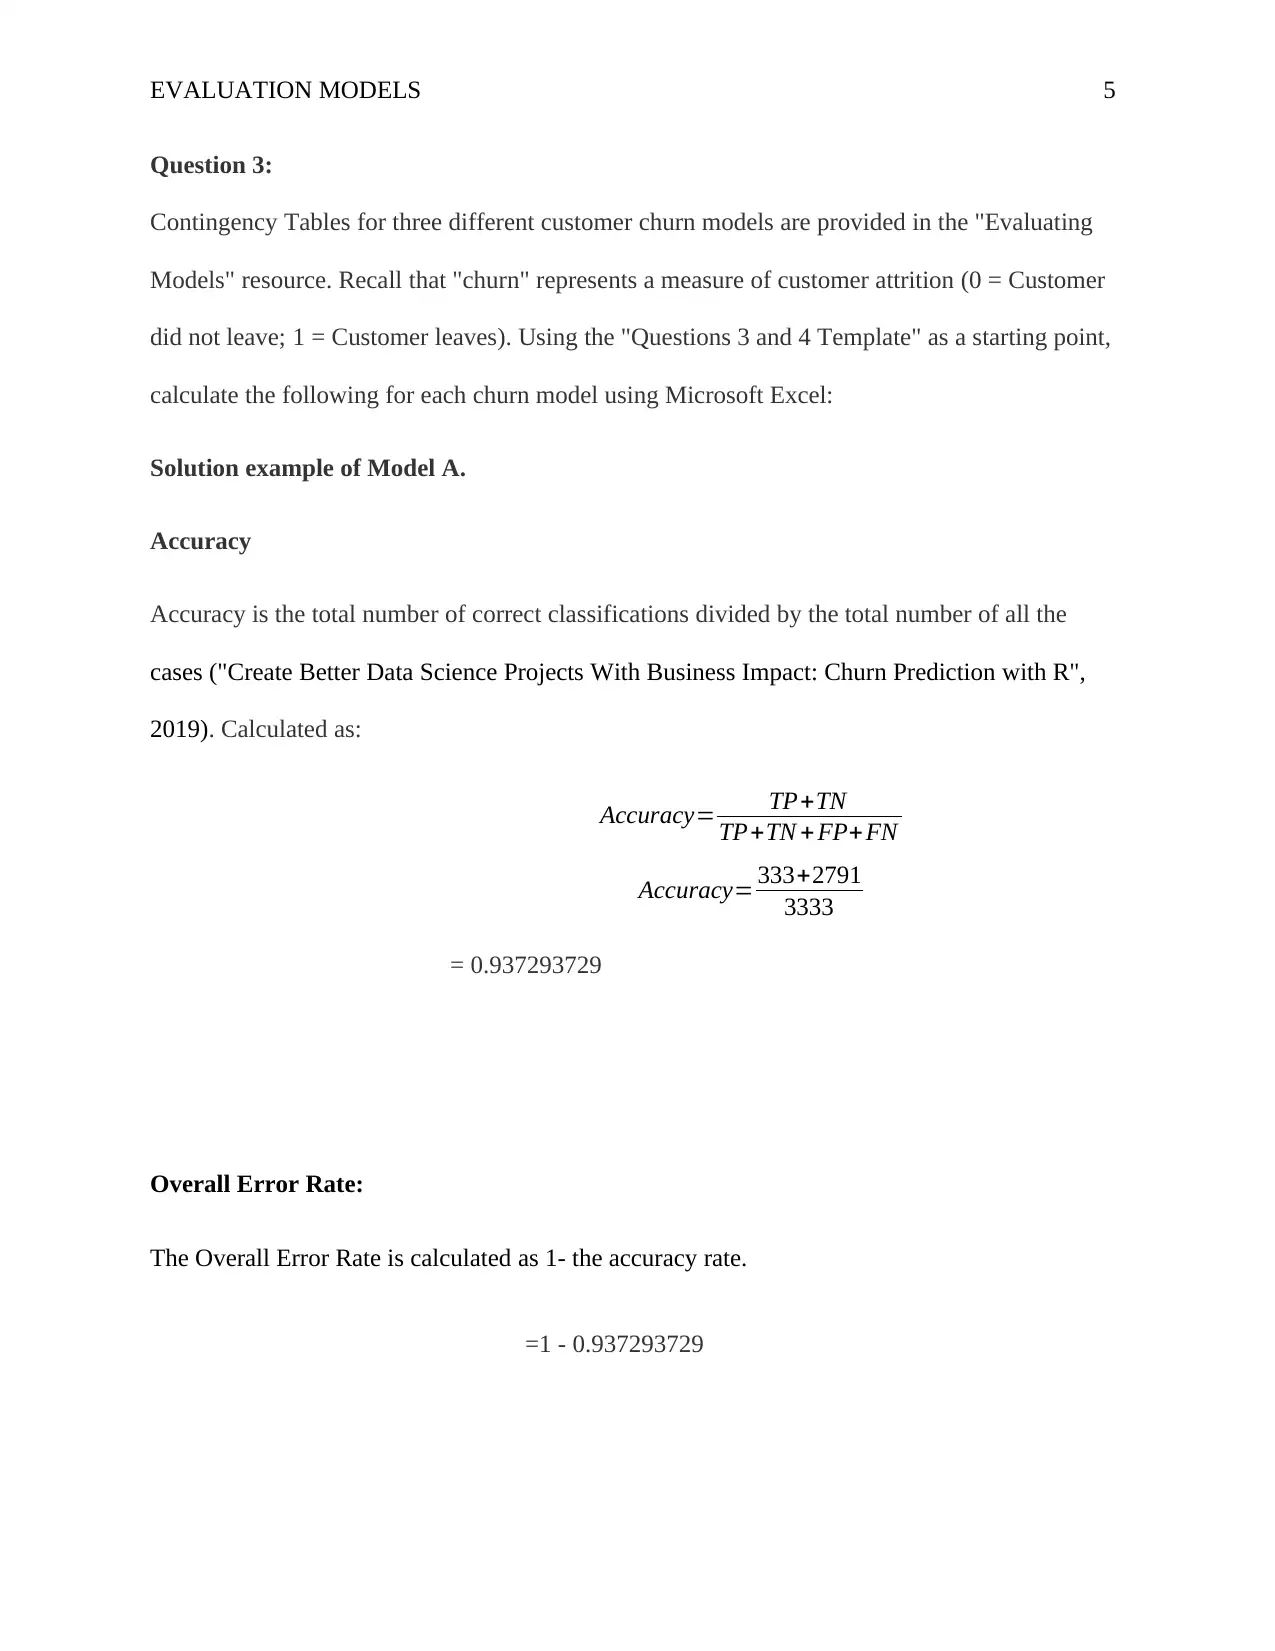
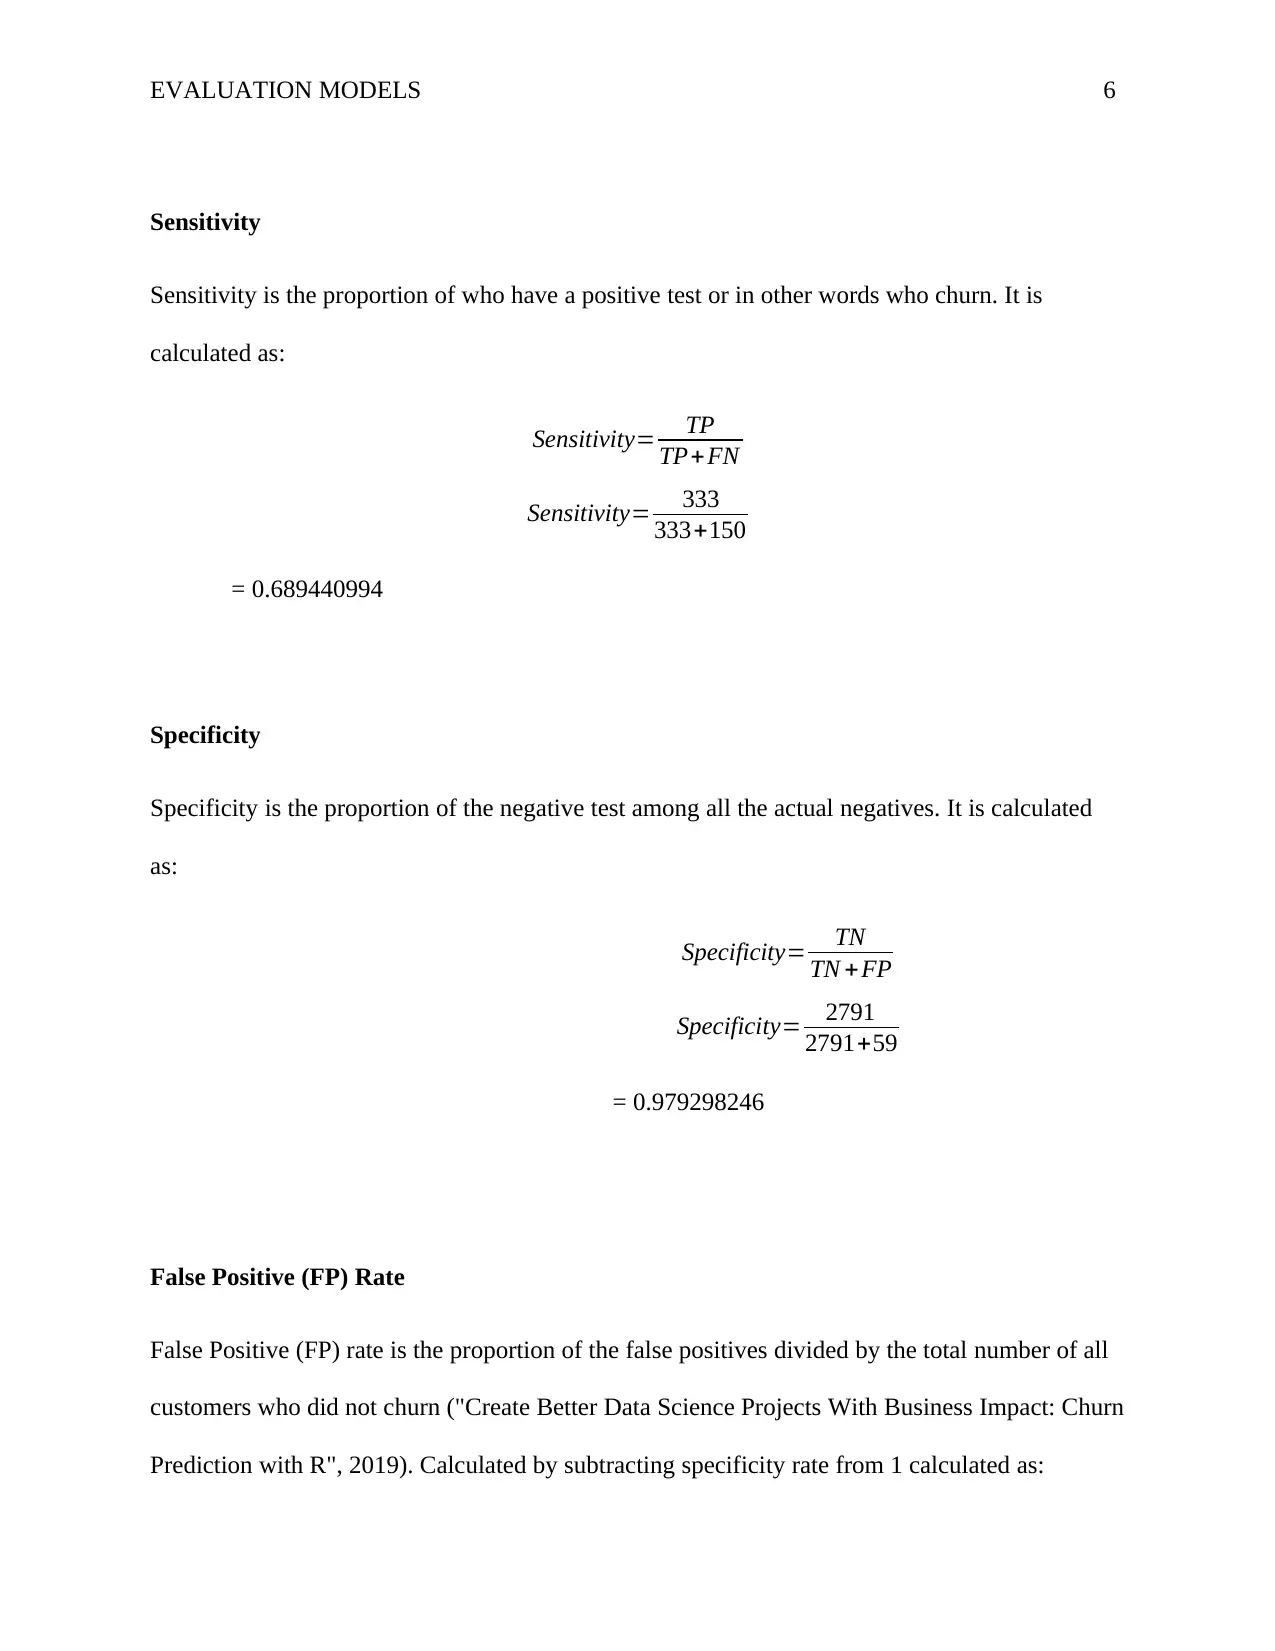
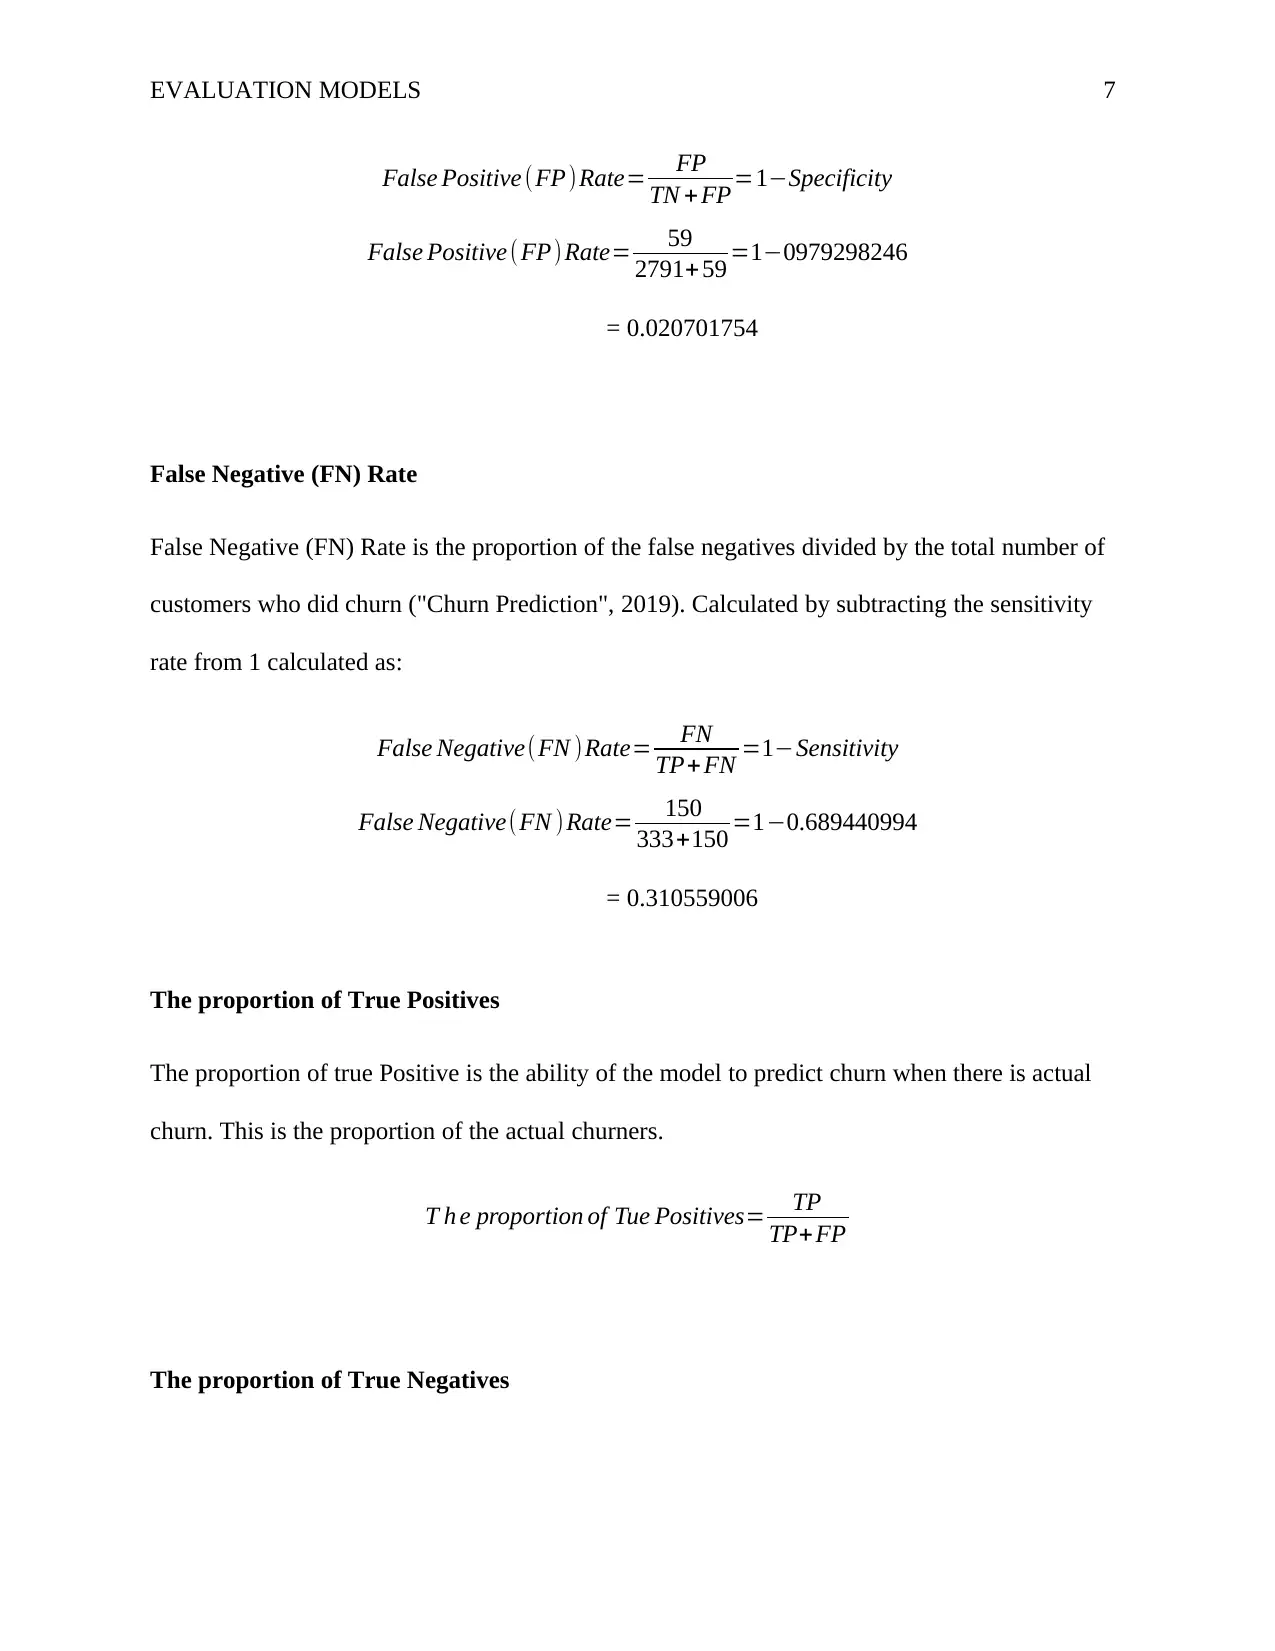
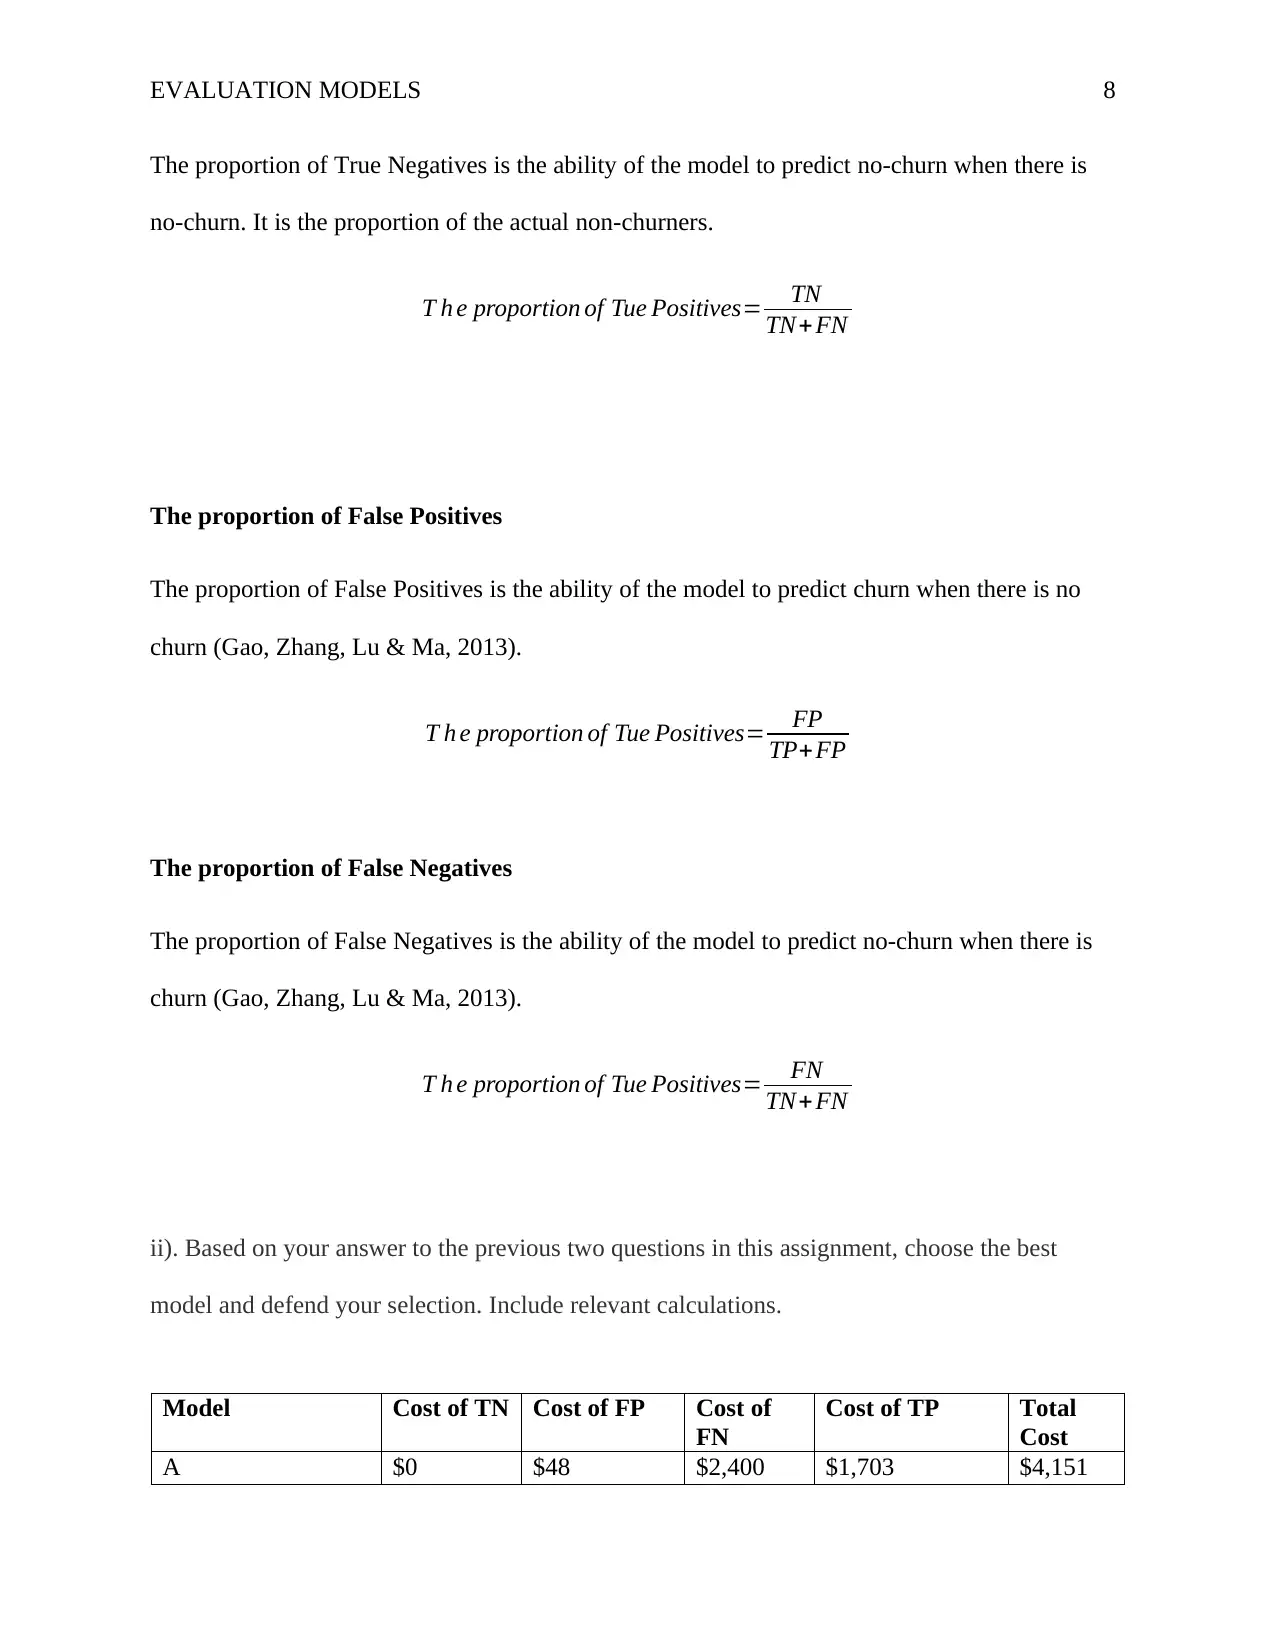
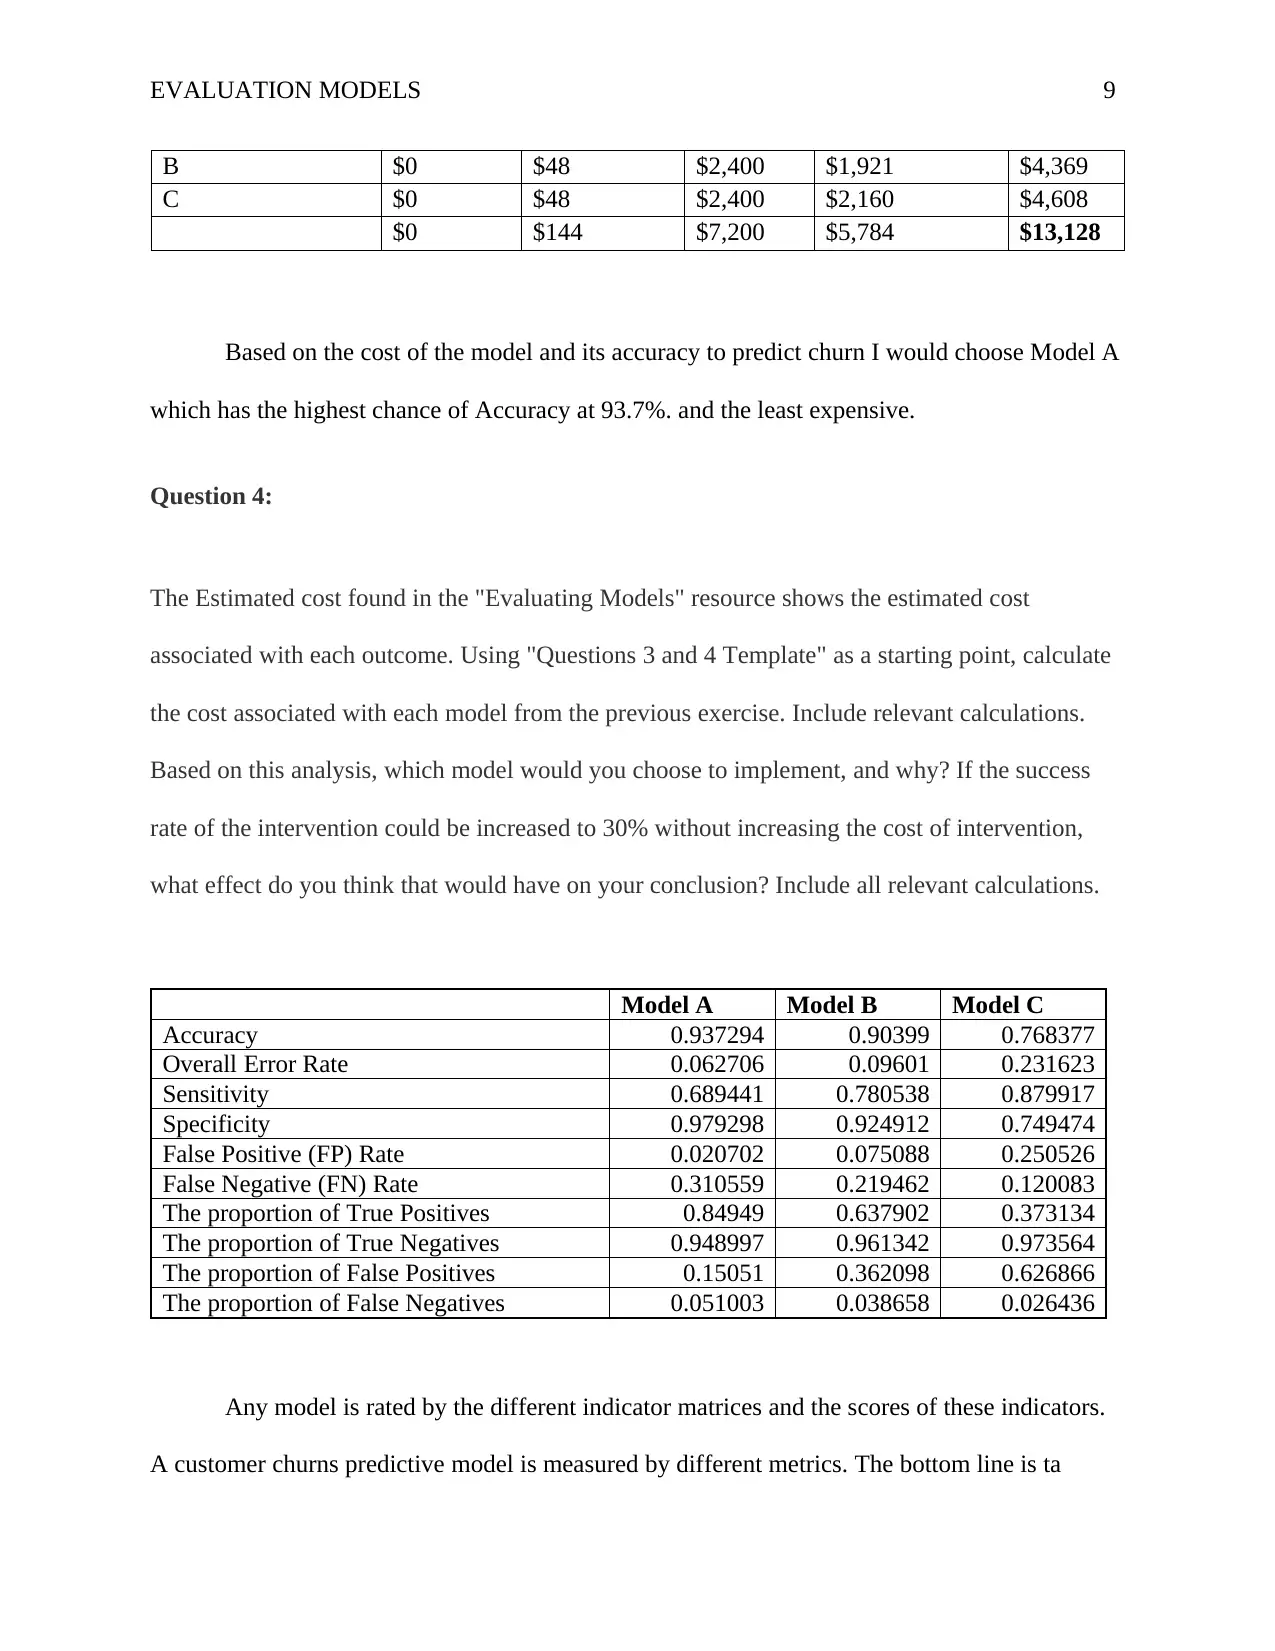
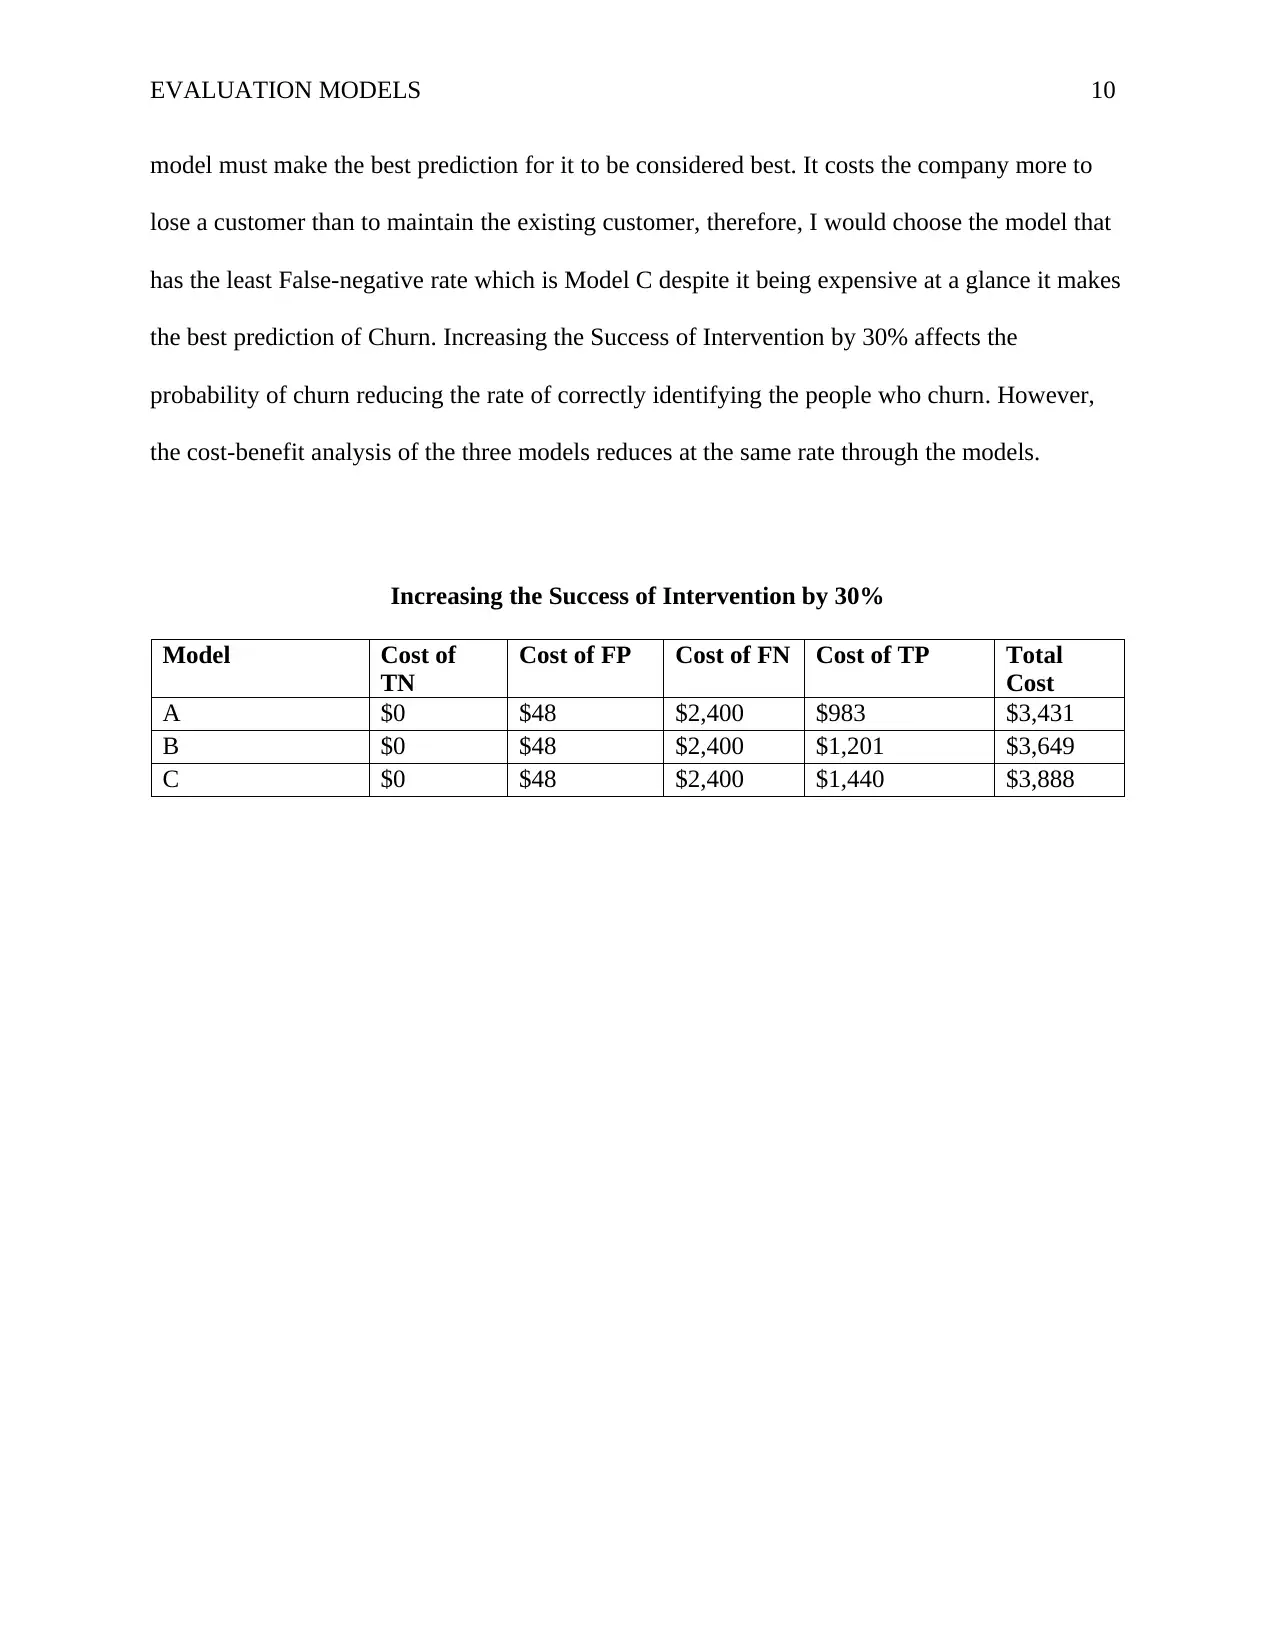
This assignment evaluates three customer churn models (A, B, and C) using provided contingency tables and cost data. The student calculates key metrics such as accuracy, sensitivity, specificity, and false positive/negative rates for each model. The analysis includes determining the cost associated with each model based on the outcomes (true positive, true negative, false positive, and false negative) and their respective costs. The student then selects the best model based on these calculations, considering both accuracy and cost-effectiveness. The assignment also explores the impact of increasing the success rate of intervention on the model's performance and overall cost-benefit analysis. The student provides detailed calculations and justifications for their conclusions, demonstrating an understanding of churn prediction and model evaluation techniques.

Running head: EVALUATION MODELS 1
Evaluating Models
<Name>
<University Name>
Evaluating Models
<Name>
<University Name>
Paraphrase This Document
Need a fresh take? Get an instant paraphrase of this document with our AI Paraphraser

EVALUATION MODELS 2
Evaluating Models
Directions: Use the information provided below to formulate answers for Questions 3 and 4 in
Par1 1 of the Evaluating Models assignment, as specified in the assignment directions.
Contingency Tables (Part 1 - Question 3)
Churn Model
A False True Total
False 2791
TN
59
FP 2850
True 150
FN
333
TP 483
Total 2941 392 3333
Churn Model
B False True Total
False 2636
TN
214
FP 2850
True 106
FN
377
TP 483
Total 2742 591 3333
Churn Model
C False True Total
False 2136
TN
714
FP 2850
True 58
FN
425
TP 483
Total 2194 1139 3333
Outcome Classification Actual
Value
Cost
True Negative Churn = false Churn = false $0
True Positive Churn = true Churn = true $2208
False Negative Churn = false Churn = true $2400
False Positive Churn = true Churn = false $48

EVALUATION MODELS 3
Question 1:
The textbook describes a situation where a false positive is worse than a false negative. Describe
a situation from the medical field (e.g., screen testing for a virus) where a false negative would
be worse than a false positive. Explain why it would be worse.
Suppose you need to bring your dog to a vet for a Lyme disease test, the tests would have four
outcomes.
Disease Present Disease not Present
Positive Test Good results Bad Results FP
Negative Test Worse results FN Good Results
A False Negative test -When the test indicates that Lyme disease is not present while indeed the
dog has the disease it is a worse result because the dog won’t get the treatment and it might end
up spreading or even be severe leading to death.
A False Positive test – For this case, a false positive result would imply that the dog will be
treated from the tick-borne disease which is not present, meaning the owner will spend time and
money for the wrong reasons which are not as bad as compared to the False Negative test results.
⊘ This is a preview!⊘
Do you want full access?
Subscribe today to unlock all pages.

Trusted by 1+ million students worldwide

EVALUATION MODELS 4
Question 2:
In a typical churn model, in which interceding with a potential churner is relatively cheap but
losing a customer is expensive, which error is false negative or a false positive (where positive =
customer predicted to churn)? Explain.
Outcome Classification Actual Value Cost
True Negative Churn = false Churn = false $0
True Positive Churn = true Churn = true $2208
False Negative Churn = false Churn = true $2400
False Positive Churn = true Churn = false $48
Churn Model
Prediction
0 (Negative) 1 (Positive)
Actual
0
Cost = $0
prediction =0
Actual=0
TN
Cost = $48
prediction =1
Actual=0
FP
1
Cost = $2400
prediction =0
Actual=1
FN
Cost = $2208
prediction =1
Actual=1
TP
For a typical churn model where intervention with a potential churner is cheaper than
losing the customer. From the table above the having a false positive churn implies that there
was a positive prediction of churn where intervention was done costing the company $48 while
the actual outcome is that the client did not churn. A False positive churn is cheaper than a false
negative churn – where there was no prediction of churn and no intervention applied to cost the
company $2400 which is more than the FP costing (Olle, 2014).
Paraphrase This Document
Need a fresh take? Get an instant paraphrase of this document with our AI Paraphraser

EVALUATION MODELS 5
Question 3:
Contingency Tables for three different customer churn models are provided in the "Evaluating
Models" resource. Recall that "churn" represents a measure of customer attrition (0 = Customer
did not leave; 1 = Customer leaves). Using the "Questions 3 and 4 Template" as a starting point,
calculate the following for each churn model using Microsoft Excel:
Solution example of Model A.
Accuracy
Accuracy is the total number of correct classifications divided by the total number of all the
cases ("Create Better Data Science Projects With Business Impact: Churn Prediction with R",
2019). Calculated as:
Accuracy= TP+TN
TP+TN + FP+FN
Accuracy= 333+2791
3333
= 0.937293729
Overall Error Rate:
The Overall Error Rate is calculated as 1- the accuracy rate.
=1 - 0.937293729

EVALUATION MODELS 6
Sensitivity
Sensitivity is the proportion of who have a positive test or in other words who churn. It is
calculated as:
Sensitivity= TP
TP+FN
Sensitivity= 333
333+150
= 0.689440994
Specificity
Specificity is the proportion of the negative test among all the actual negatives. It is calculated
as:
Specificity= TN
TN + FP
Specificity= 2791
2791+59
= 0.979298246
False Positive (FP) Rate
False Positive (FP) rate is the proportion of the false positives divided by the total number of all
customers who did not churn ("Create Better Data Science Projects With Business Impact: Churn
Prediction with R", 2019). Calculated by subtracting specificity rate from 1 calculated as:
⊘ This is a preview!⊘
Do you want full access?
Subscribe today to unlock all pages.

Trusted by 1+ million students worldwide

EVALUATION MODELS 7
False Positive (FP)Rate= FP
TN + FP=1−Specificity
False Positive (FP)Rate= 59
2791+ 59 =1−0979298246
= 0.020701754
False Negative (FN) Rate
False Negative (FN) Rate is the proportion of the false negatives divided by the total number of
customers who did churn ("Churn Prediction", 2019). Calculated by subtracting the sensitivity
rate from 1 calculated as:
False Negative(FN )Rate= FN
TP+ FN =1−Sensitivity
False Negative(FN )Rate= 150
333+150 =1−0.689440994
= 0.310559006
The proportion of True Positives
The proportion of true Positive is the ability of the model to predict churn when there is actual
churn. This is the proportion of the actual churners.
T h e proportion of Tue Positives= TP
TP+FP
The proportion of True Negatives
Paraphrase This Document
Need a fresh take? Get an instant paraphrase of this document with our AI Paraphraser

EVALUATION MODELS 8
The proportion of True Negatives is the ability of the model to predict no-churn when there is
no-churn. It is the proportion of the actual non-churners.
T h e proportion of Tue Positives= TN
TN+ FN
The proportion of False Positives
The proportion of False Positives is the ability of the model to predict churn when there is no
churn (Gao, Zhang, Lu & Ma, 2013).
T h e proportion of Tue Positives= FP
TP+FP
The proportion of False Negatives
The proportion of False Negatives is the ability of the model to predict no-churn when there is
churn (Gao, Zhang, Lu & Ma, 2013).
T h e proportion of Tue Positives= FN
TN+ FN
ii). Based on your answer to the previous two questions in this assignment, choose the best
model and defend your selection. Include relevant calculations.
Model Cost of TN Cost of FP Cost of
FN
Cost of TP Total
Cost
A $0 $48 $2,400 $1,703 $4,151

EVALUATION MODELS 9
B $0 $48 $2,400 $1,921 $4,369
C $0 $48 $2,400 $2,160 $4,608
$0 $144 $7,200 $5,784 $13,128
Based on the cost of the model and its accuracy to predict churn I would choose Model A
which has the highest chance of Accuracy at 93.7%. and the least expensive.
Question 4:
The Estimated cost found in the "Evaluating Models" resource shows the estimated cost
associated with each outcome. Using "Questions 3 and 4 Template" as a starting point, calculate
the cost associated with each model from the previous exercise. Include relevant calculations.
Based on this analysis, which model would you choose to implement, and why? If the success
rate of the intervention could be increased to 30% without increasing the cost of intervention,
what effect do you think that would have on your conclusion? Include all relevant calculations.
Model A Model B Model C
Accuracy 0.937294 0.90399 0.768377
Overall Error Rate 0.062706 0.09601 0.231623
Sensitivity 0.689441 0.780538 0.879917
Specificity 0.979298 0.924912 0.749474
False Positive (FP) Rate 0.020702 0.075088 0.250526
False Negative (FN) Rate 0.310559 0.219462 0.120083
The proportion of True Positives 0.84949 0.637902 0.373134
The proportion of True Negatives 0.948997 0.961342 0.973564
The proportion of False Positives 0.15051 0.362098 0.626866
The proportion of False Negatives 0.051003 0.038658 0.026436
Any model is rated by the different indicator matrices and the scores of these indicators.
A customer churns predictive model is measured by different metrics. The bottom line is ta
⊘ This is a preview!⊘
Do you want full access?
Subscribe today to unlock all pages.

Trusted by 1+ million students worldwide

EVALUATION MODELS 10
model must make the best prediction for it to be considered best. It costs the company more to
lose a customer than to maintain the existing customer, therefore, I would choose the model that
has the least False-negative rate which is Model C despite it being expensive at a glance it makes
the best prediction of Churn. Increasing the Success of Intervention by 30% affects the
probability of churn reducing the rate of correctly identifying the people who churn. However,
the cost-benefit analysis of the three models reduces at the same rate through the models.
Increasing the Success of Intervention by 30%
Model Cost of
TN
Cost of FP Cost of FN Cost of TP Total
Cost
A $0 $48 $2,400 $983 $3,431
B $0 $48 $2,400 $1,201 $3,649
C $0 $48 $2,400 $1,440 $3,888
Paraphrase This Document
Need a fresh take? Get an instant paraphrase of this document with our AI Paraphraser

EVALUATION MODELS 11
References
Churn Prediction. (2019). Retrieved 19 September 2019, from
https://towardsdatascience.com/churn-prediction-3a4a36c2129a
Create Better Data Science Projects With Business Impact: Churn Prediction with R. (2019).
Retrieved 19 September 2019, from https://www.dataoptimal.com/churn-prediction-with-r/
Gao, Y., Zhang, G., Lu, J., & Ma, J. (2013). A BI-LEVEL DECISION MODEL FOR
CUSTOMER CHURN ANALYSIS. Computational Intelligence, 30(3), 583-599. DOI:
10.1111/coin.12008
Olle, G. (2014). A Hybrid Churn Prediction Model in Mobile Telecommunication
Industry. International Journal Of E-Education, E-Business, E-Management and E-
Learning. DOI: 10.7763/ijeeee.2014.v4.302

EVALUATION MODELS 12
⊘ This is a preview!⊘
Do you want full access?
Subscribe today to unlock all pages.

Trusted by 1+ million students worldwide
1 out of 12
Your All-in-One AI-Powered Toolkit for Academic Success.
 +13062052269
info@desklib.com
Available 24*7 on WhatsApp / Email
Unlock your academic potential
Copyright © 2020–2026 A2Z Services. All Rights Reserved. Developed and managed by ZUCOL.


