Data Analysis and Digital Operations: Customer Churn Report
VerifiedAdded on 2022/10/19
|18
|2711
|438
Report
AI Summary
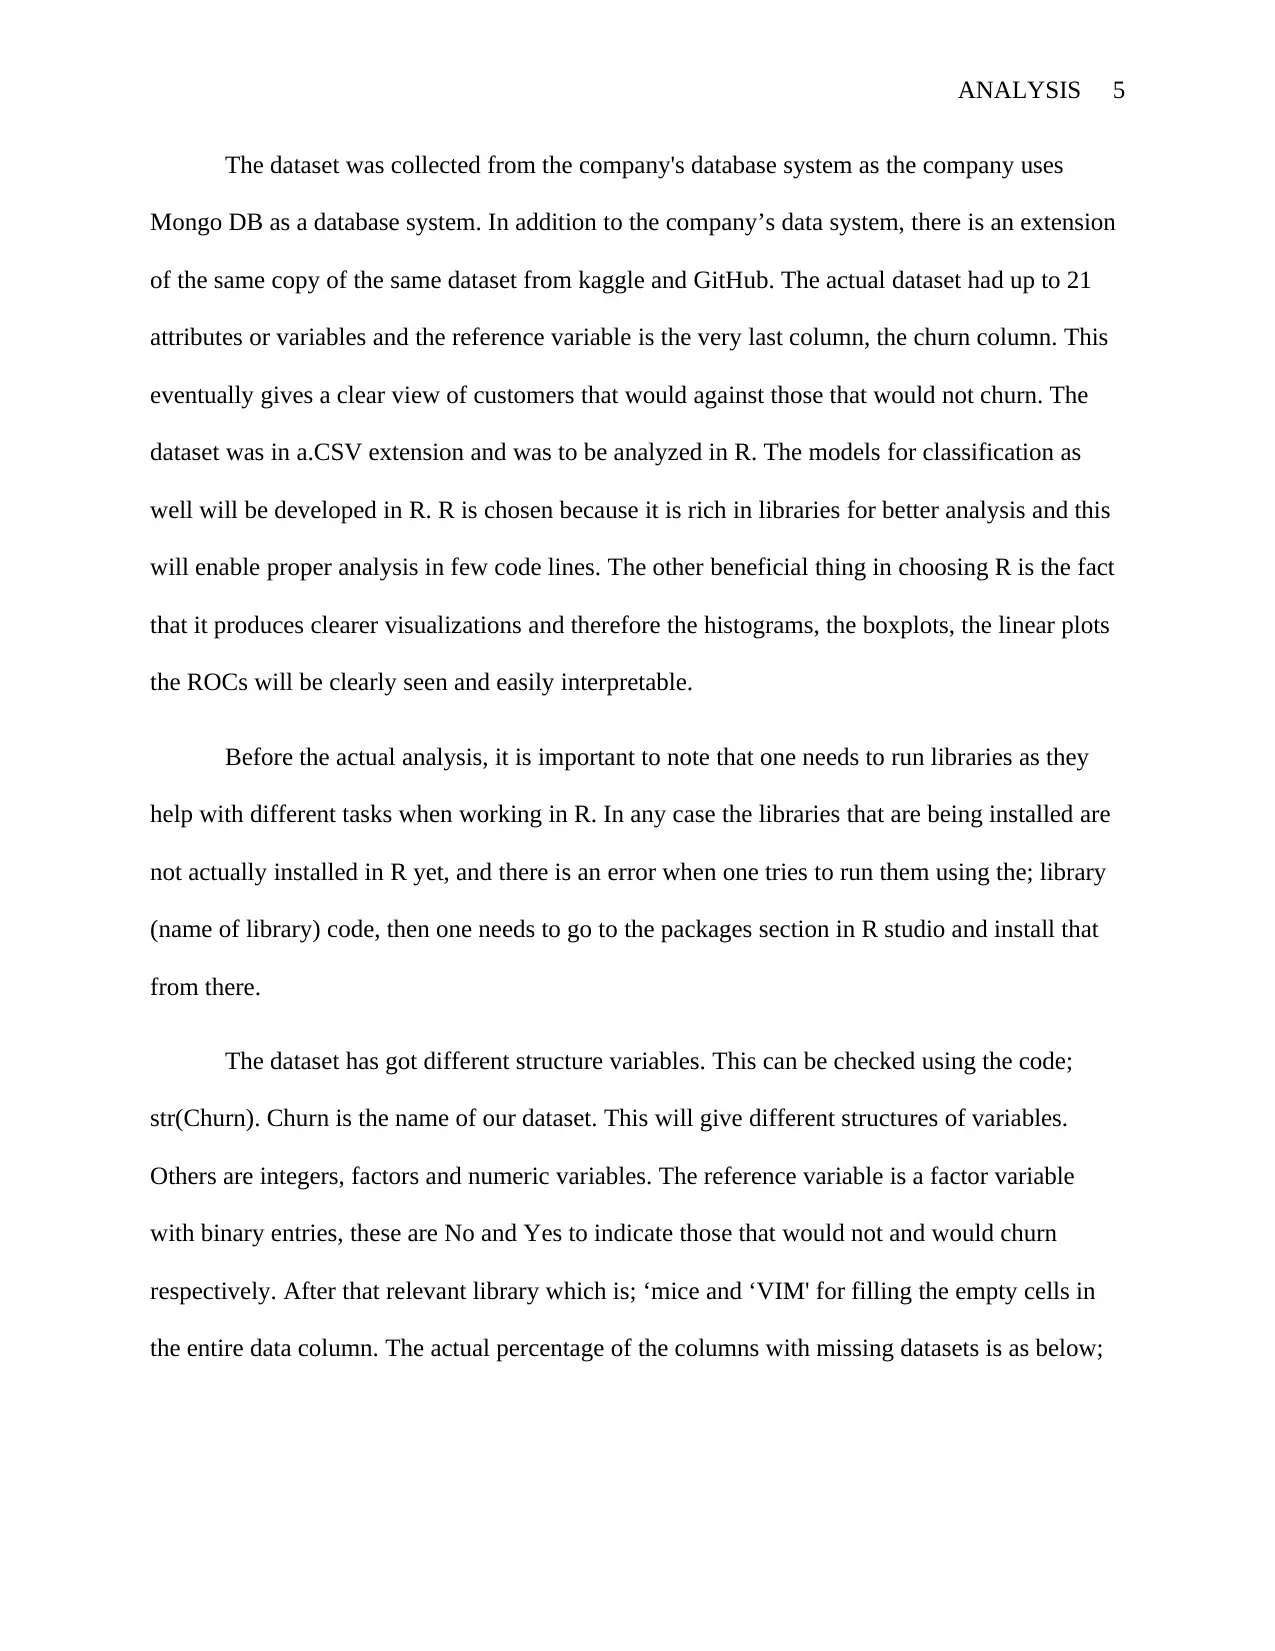
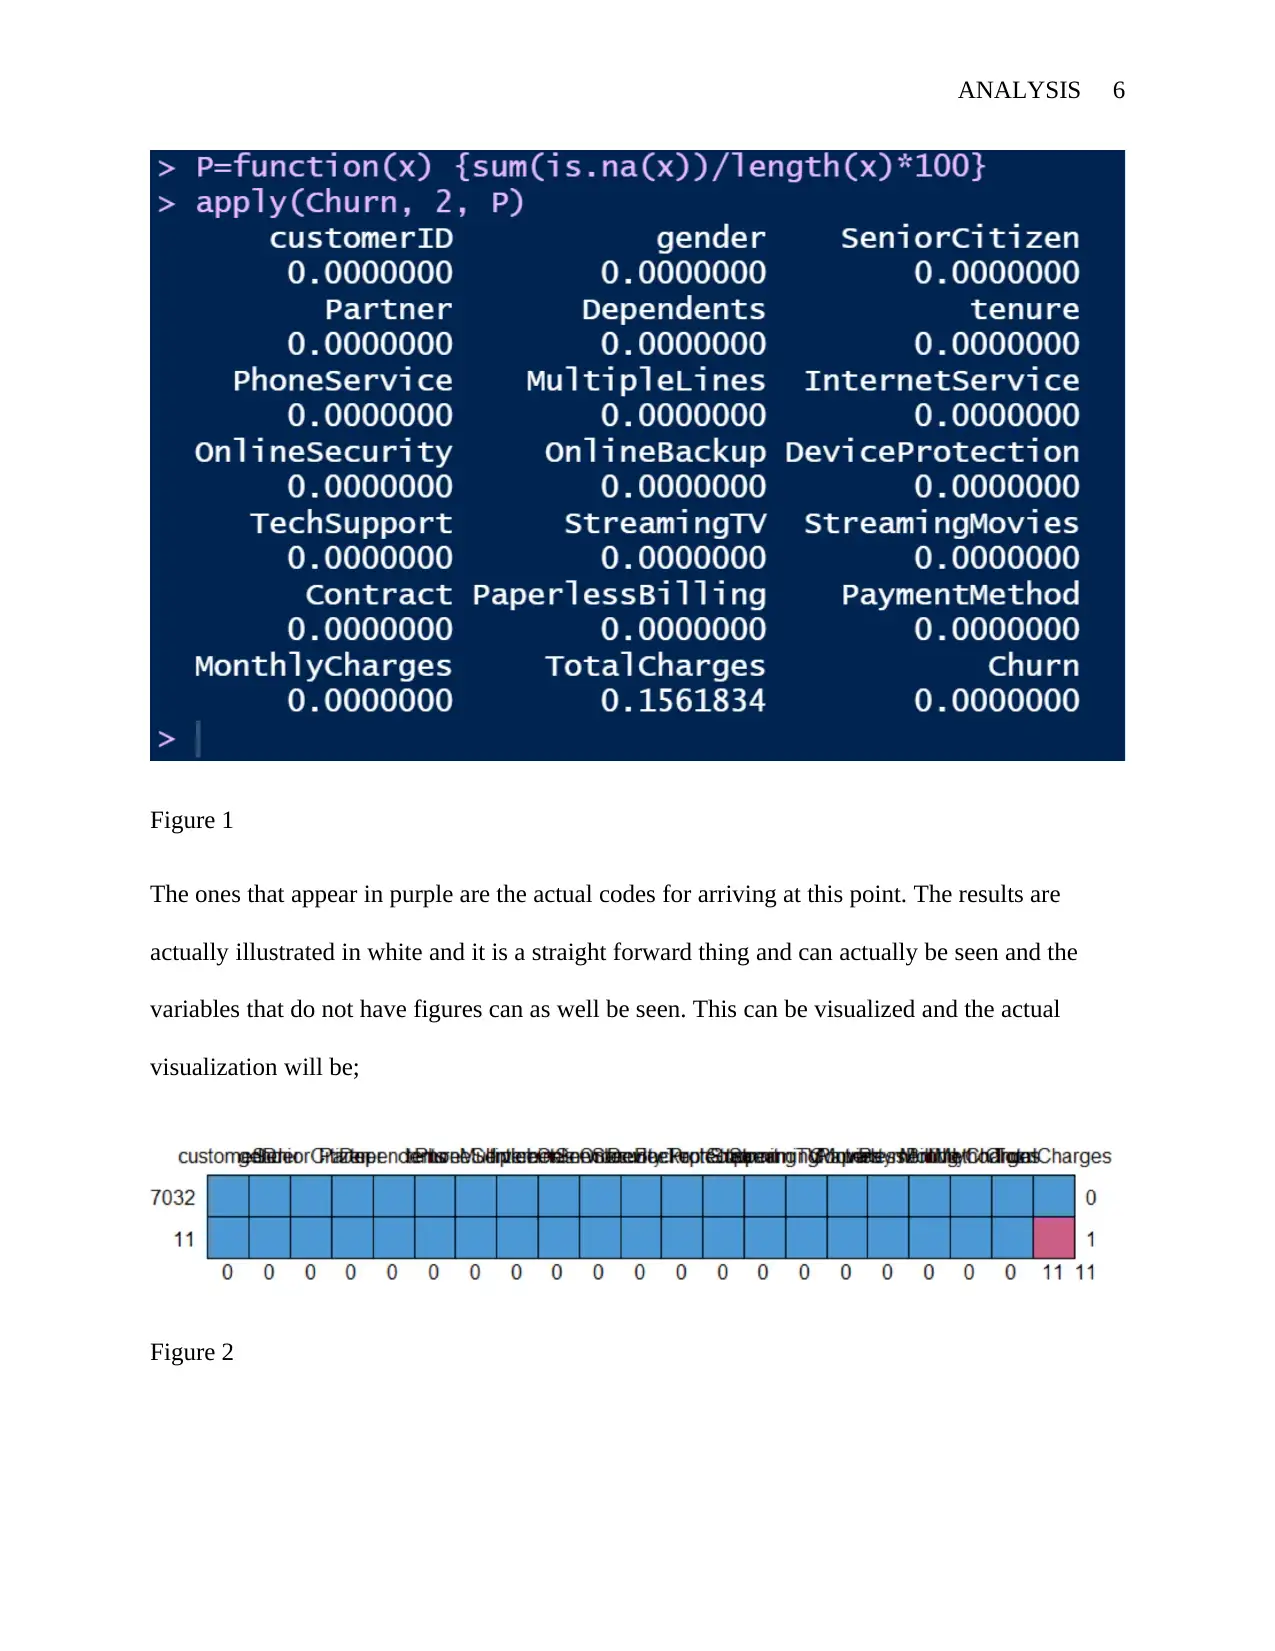
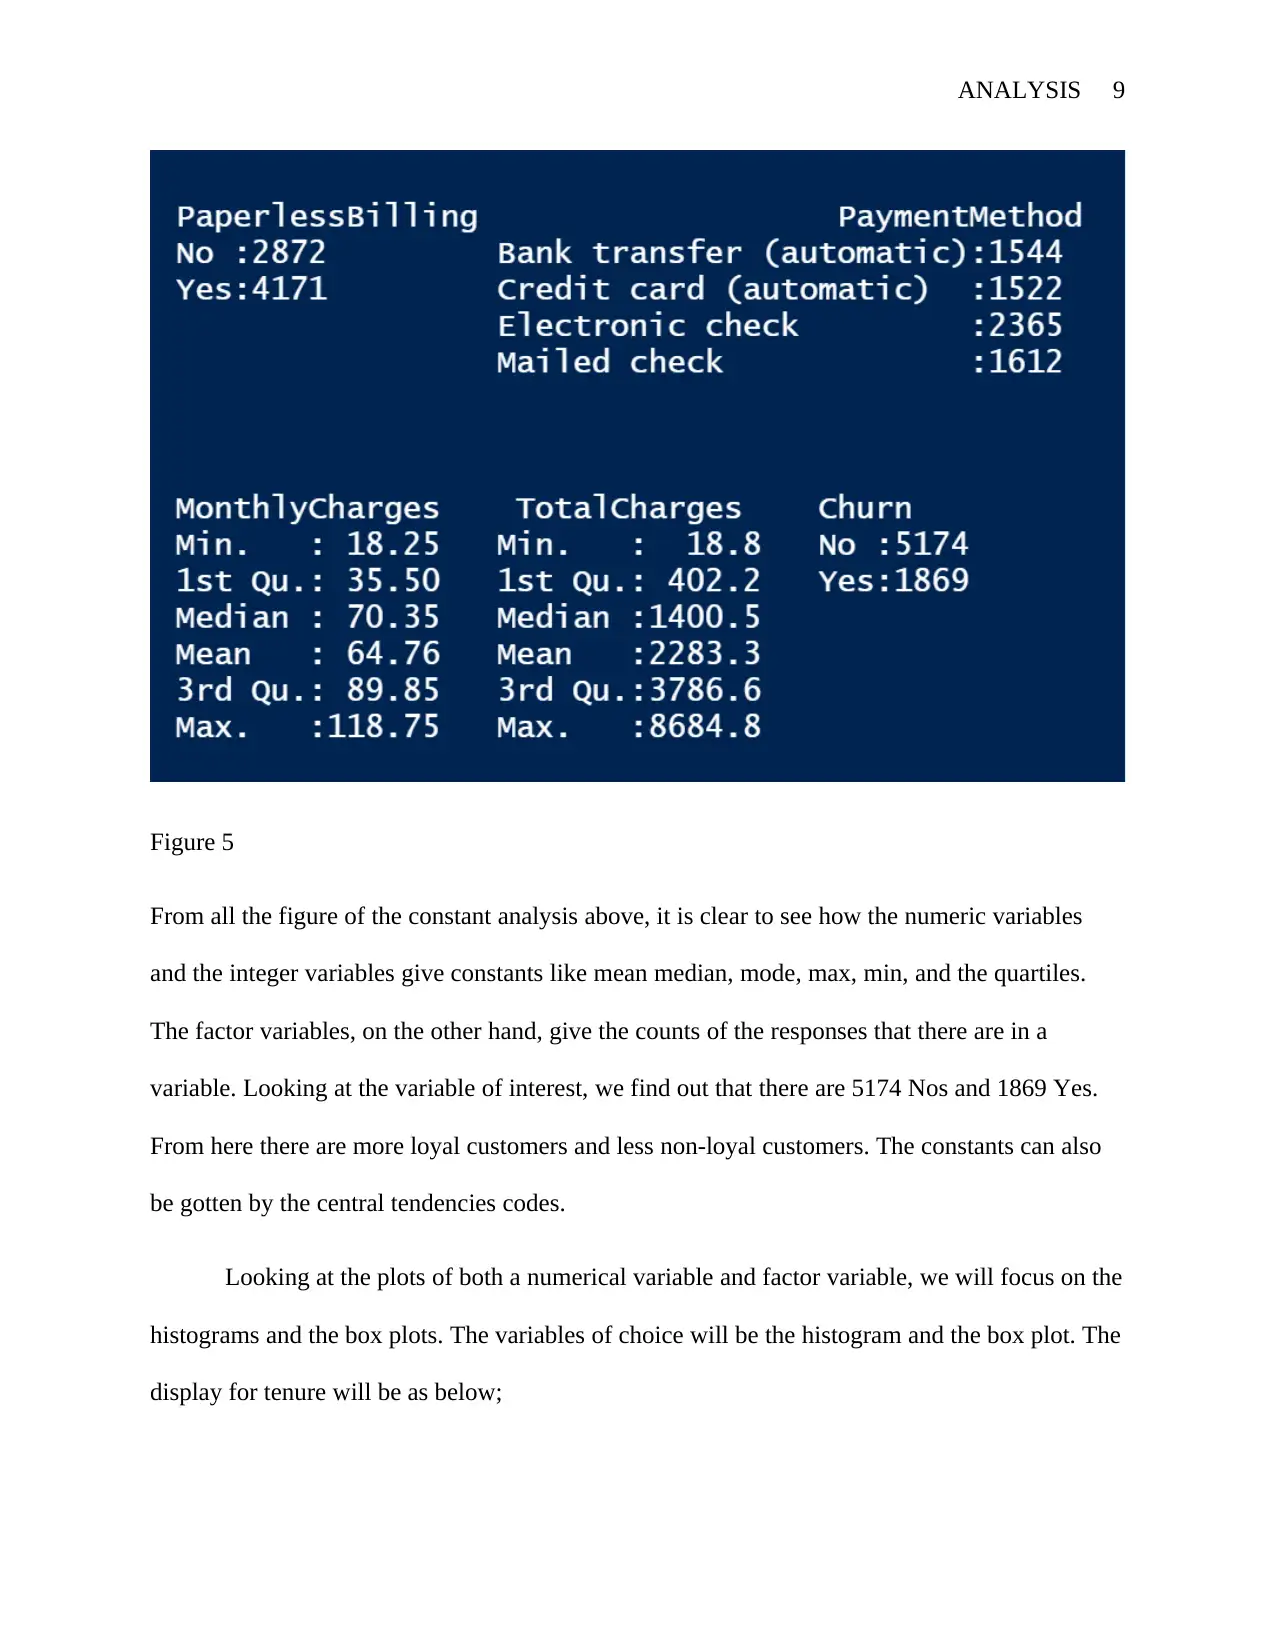
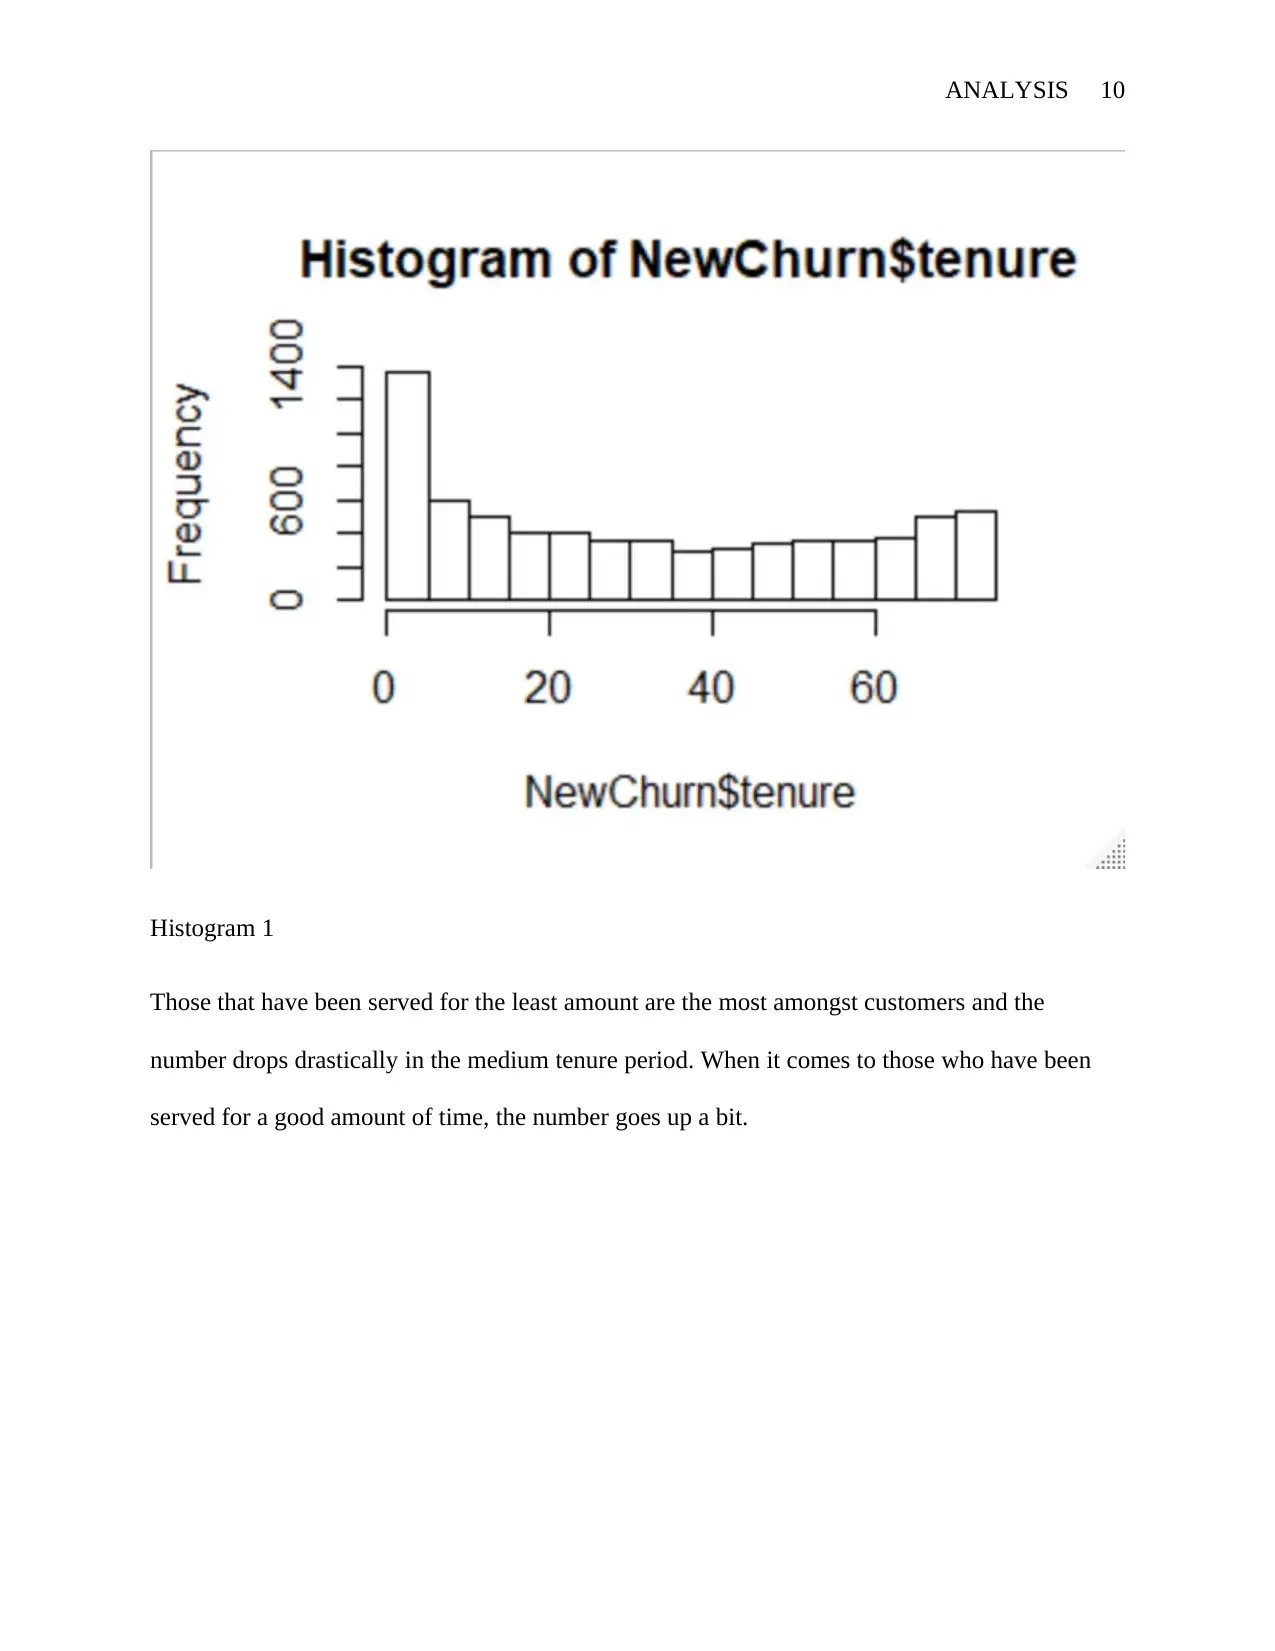
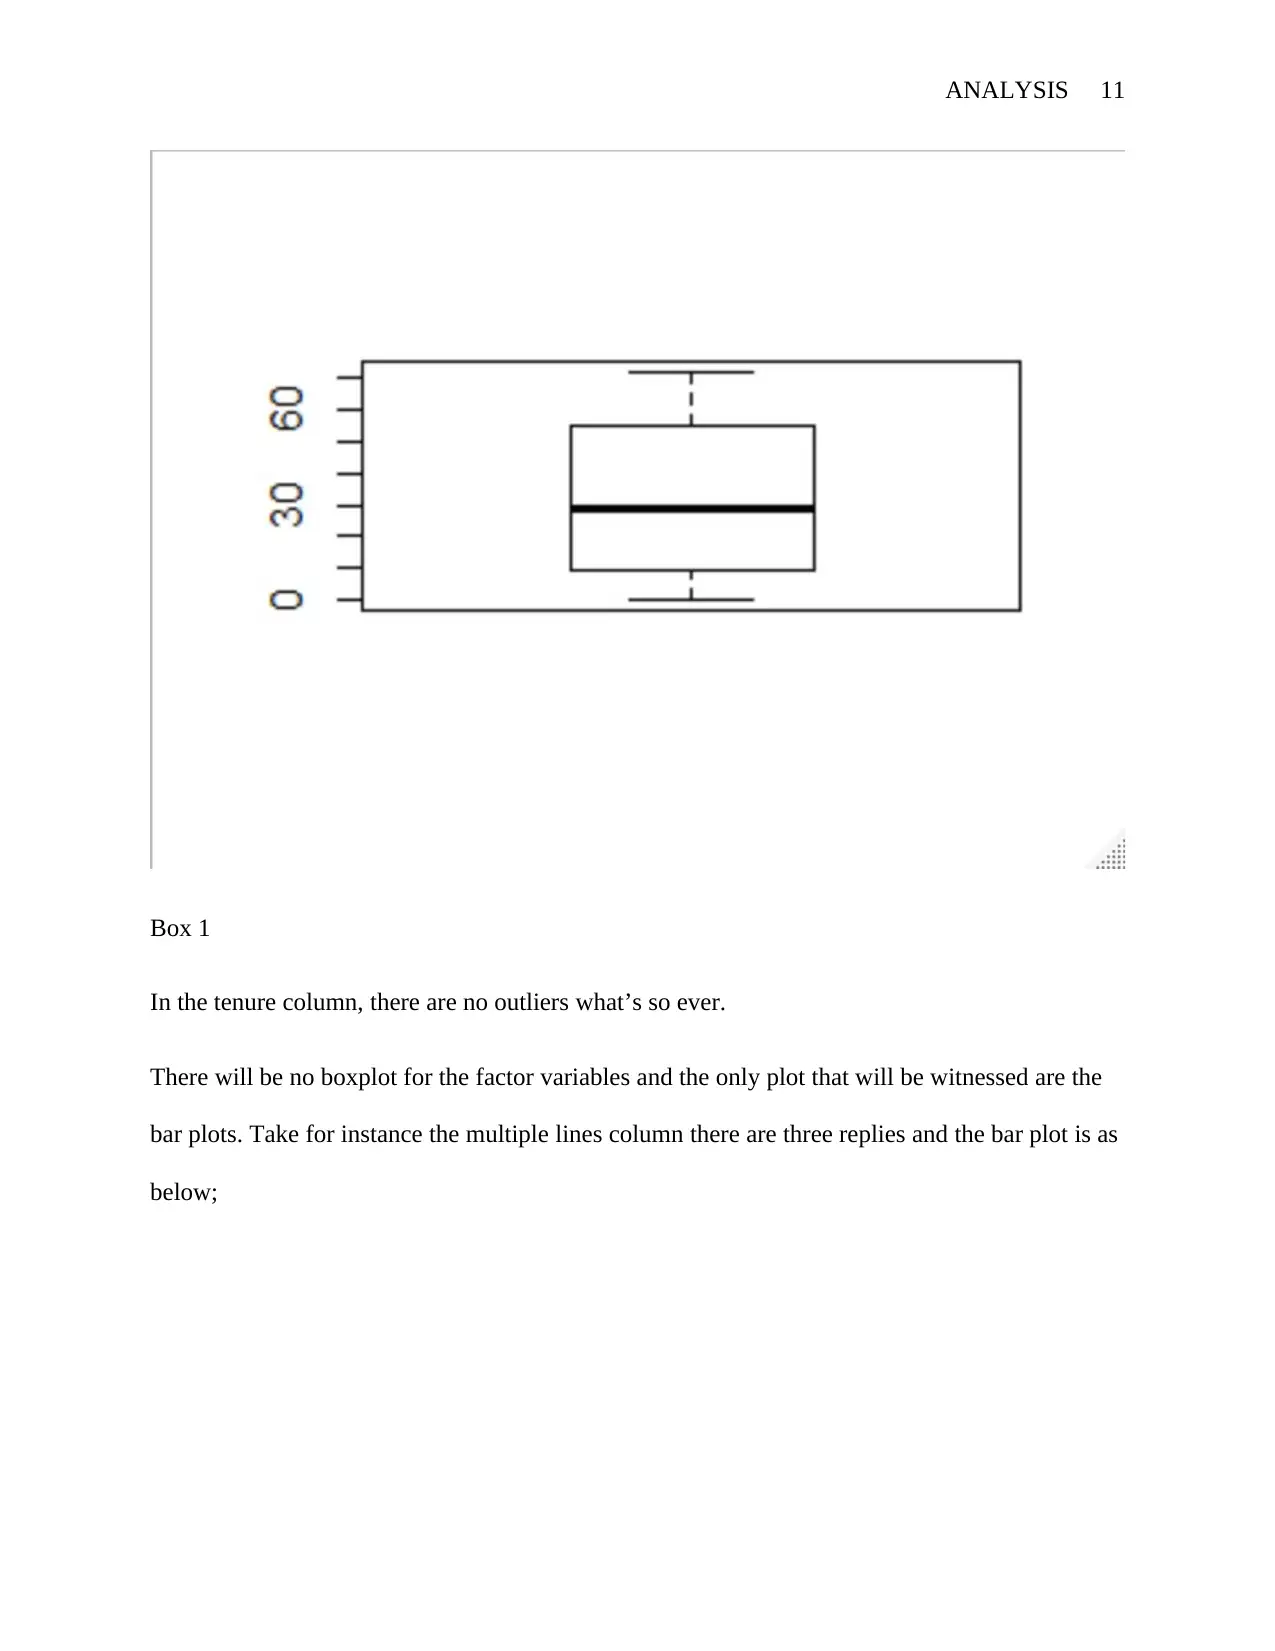
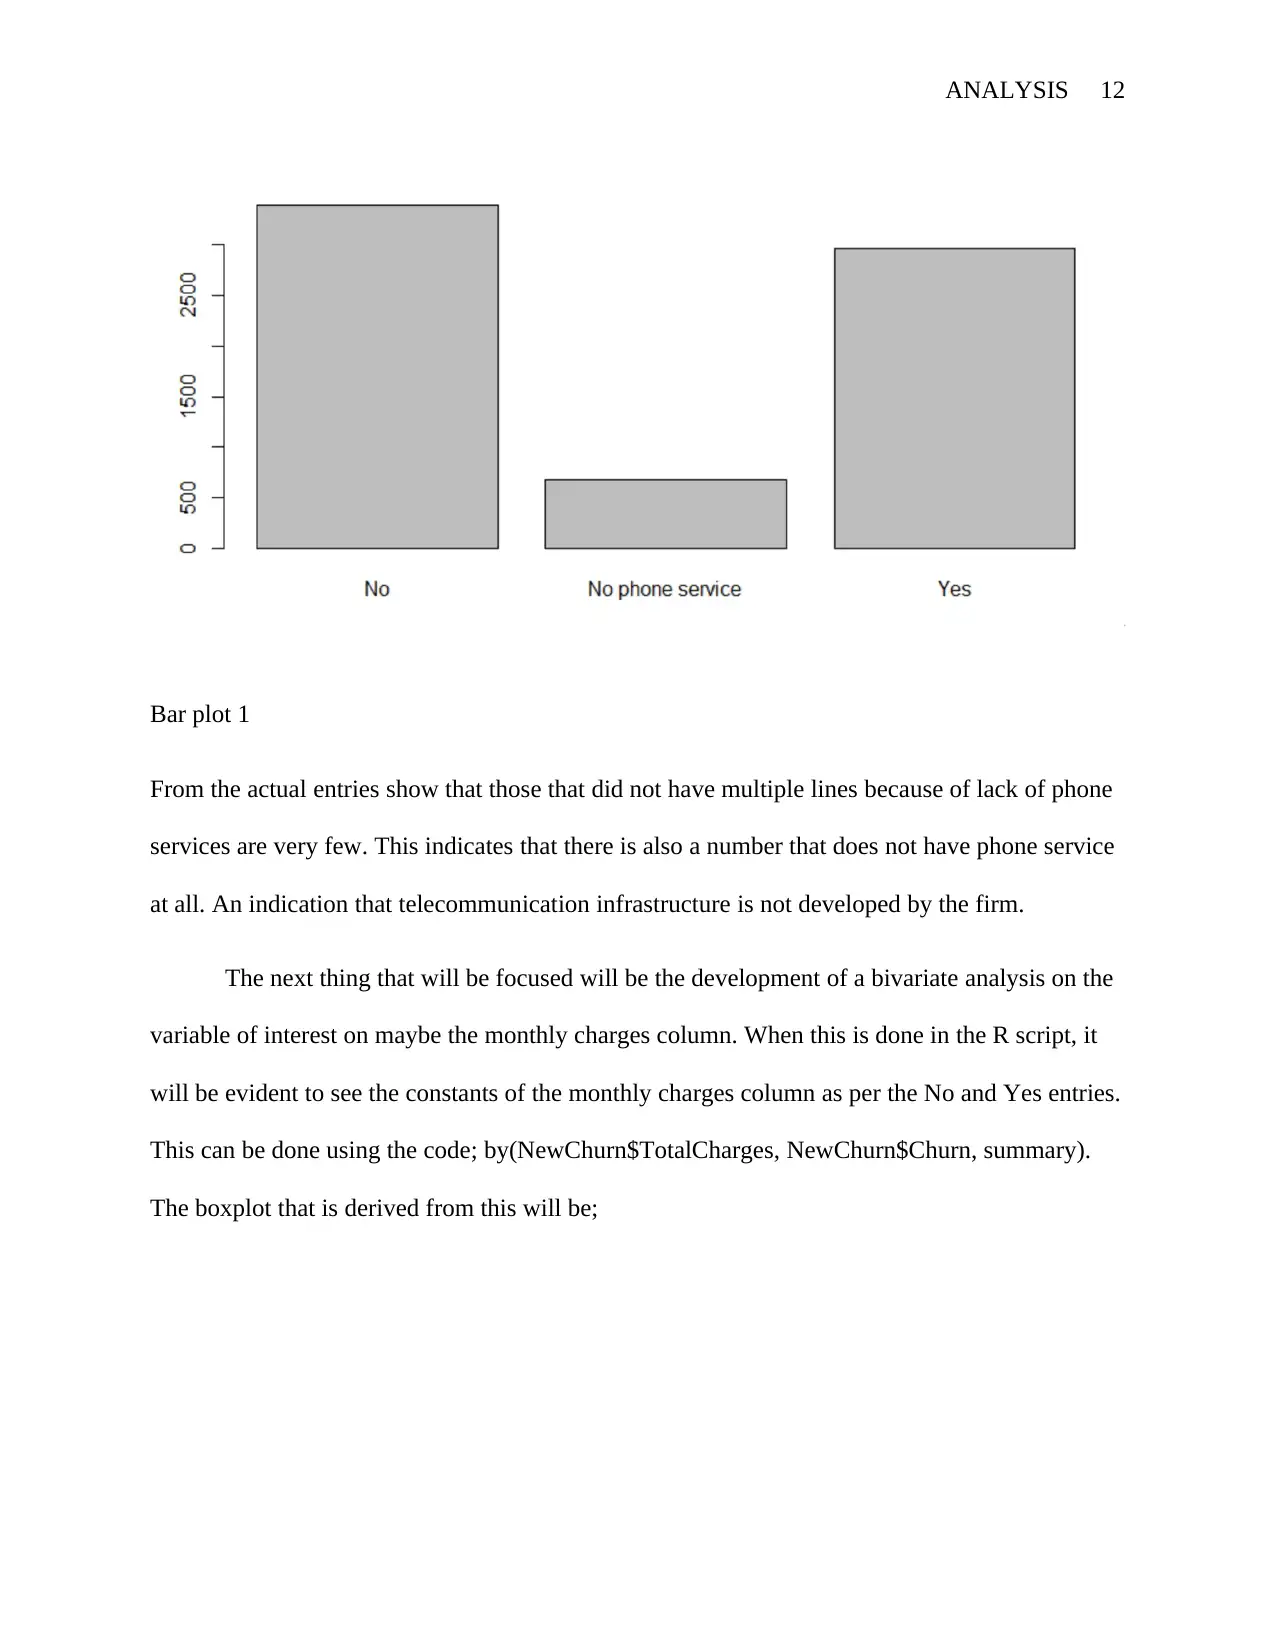
This report provides a comprehensive analysis of customer churn in a telecommunications company. It begins with an executive summary outlining the problem, data collection, analysis, and model development. The introduction identifies customer loyalty as a critical issue, especially with the emergence of new competitors. The report then details the methodology, including data preprocessing, univariate and bivariate analysis, and the application of logistic regression for classification. Data was collected from the company's database, with additional sources from Kaggle and GitHub. The analysis was performed using R, with libraries like 'mice' and 'VIM' used for handling missing data. The report includes visualizations such as histograms and boxplots to illustrate data distributions. A linear regression model was developed to determine relevant variables for the logistic regression model. The final section discusses the model's performance and provides recommendations for improving customer retention, with a focus on identifying inefficiencies and suggesting corrective measures based on the analysis.

ANALYSIS 1
DATA ANALYSIS AND DIGITAL OPERATIONS
NAME OF STUDENT
NAME OF PROFESSOR
NAME OF CLASS
NAME OF SCHOOL
STATE AND CITY
DATE
DATA ANALYSIS AND DIGITAL OPERATIONS
NAME OF STUDENT
NAME OF PROFESSOR
NAME OF CLASS
NAME OF SCHOOL
STATE AND CITY
DATE
Paraphrase This Document
Need a fresh take? Get an instant paraphrase of this document with our AI Paraphraser

ANALYSIS 2
EXECUTIVE SUMMARY
At the start of this report, it is important to note that there was a liberty of selecting a
company, collecting data and choosing an analytical tool for the preprocessing of the data and
analysis. The software must have been computer-supported. Developing predictive models
would be of keen interests well as the data collected would be to help address a problem-solving
the situation.
At the start of the report, there will be an introductory part where the main problem, the
company would be discussed. There will be a follow up on the data collection and the analysis.
Immediately after, results of the analysis, models developed and the test of the actual models that
have been developed as this would help get to know which model is the best and how they
perform on the said dataset. The final part will be the conclusion on why the model developed is
the best for the study of the dataset and the company.
INTRODUCTION
The company of choice will be a telecommunication company. As the data scientist of
the firm, I have been mandated with the task of looking at customers’ loyalty to the firm. The
need to do this came after new players got into the same line of operation as that of the company
that I work for. The players seemed to have gotten into the business with promising packages
and this must have caused other customers to think otherwise and were seen as not being loyal to
the firm. In other words, they were shaky and indicated the sign of shifting forces to a different
telecommunication firm. Losing customers is deadly and this is largely in two ways; there will be
loss of revenue since the prescriptions of the previous customers will not be there. This will

ANALYSIS 3
eventually to a loss on profits that are being earned. The next deadly aspect is the firm will have
to spend a lot more cash on trying to convince new potential customers to join. This protective
measure arises because once customers have churned a service from a provider, the service
provider will eventually be looking for new customers to fill the void. It is easier to maintain the
loyalty of existing customers as opposed to getting new customers.
To have a look into which actual customers would churn against the ones that would not
churn, there will be a use of customer churn dataset. The mining of the dataset will be discussed
in the next sections. Form the proper analysis, there will be a classification of those customers
who are expected to churn against those who are not expected to. There will be a corrective
measure that will, therefore, be discussed in the conclusion and recommendations section.
Giving a little background on the algorithms that will be used in analysis and prediction,
it is only advisable to start from what machine learning is. There are four common types of
machine learning classes where algorithms are being derived from. These are; supervised
learning, semi-supervised, unsupervised learning and reinforced learning. We will be classifying
our dataset and this requires the use of a supervised learning technique hence a supervised
learning algorithm in the long run.
The analysis of the study that we are about to conduct will be based on a varied sets of
analysis. There will be an actual data preprocessing, where missing data entries are filled before
the main data analysis. After the imputation of missing data points, there will be univariate
analysis to help look at how the data variables relate with one another. There will be categorical,
numerical as well as factor variable analysis. There will be histograms plotted and the actual
boxplots done to help aid in the actual visualizations of the distribution of the variables
diagrammatically and the extent of the outliers that must have been there.
⊘ This is a preview!⊘
Do you want full access?
Subscribe today to unlock all pages.

Trusted by 1+ million students worldwide

ANALYSIS 4
The main analytical technique will be a classification technique, in this way, what we will
be having is, the logistic regression. Before the logistic regression, there will be the
determination of the statistically relevant variables and this will be done by the use of, linear
regression. Linear regression is a regression model and yet logistic regression is a classification
model. After the determination of the relevant variables, then there will be the development of
the actual logistic regression where the different sets of customers will be classified to help
group which customers might leave from the ones who might not.
POSSIBLE INEFFICIENCIES
The inefficiencies that ca be identified are of two types. There can be an oversight in the
operations of the company of over pricing the services that they actually offer customers ad this
makes customers to actually opt to go to a different service provider hence the provider loosing
big time in profits and reputation as well.
The next inefficiency can be on the type of analysis. Poor data gives poor results and
therefore the source from where data is from should be checked critically. After the download of
the actual dataset, there should be a better choice made on what analysis tool to be used. This
should actually be an informed analytical tool. There should be a proper cleaning of dataset for
better results in analysis and developing algorithms.
DATA COLLECTION AND ANALYSIS (AVAILABLE DATA SOURCE)
Paraphrase This Document
Need a fresh take? Get an instant paraphrase of this document with our AI Paraphraser

ANALYSIS 5
The dataset was collected from the company's database system as the company uses
Mongo DB as a database system. In addition to the company’s data system, there is an extension
of the same copy of the same dataset from kaggle and GitHub. The actual dataset had up to 21
attributes or variables and the reference variable is the very last column, the churn column. This
eventually gives a clear view of customers that would against those that would not churn. The
dataset was in a.CSV extension and was to be analyzed in R. The models for classification as
well will be developed in R. R is chosen because it is rich in libraries for better analysis and this
will enable proper analysis in few code lines. The other beneficial thing in choosing R is the fact
that it produces clearer visualizations and therefore the histograms, the boxplots, the linear plots
the ROCs will be clearly seen and easily interpretable.
Before the actual analysis, it is important to note that one needs to run libraries as they
help with different tasks when working in R. In any case the libraries that are being installed are
not actually installed in R yet, and there is an error when one tries to run them using the; library
(name of library) code, then one needs to go to the packages section in R studio and install that
from there.
The dataset has got different structure variables. This can be checked using the code;
str(Churn). Churn is the name of our dataset. This will give different structures of variables.
Others are integers, factors and numeric variables. The reference variable is a factor variable
with binary entries, these are No and Yes to indicate those that would not and would churn
respectively. After that relevant library which is; ‘mice and ‘VIM' for filling the empty cells in
the entire data column. The actual percentage of the columns with missing datasets is as below;

ANALYSIS 6
Figure 1
The ones that appear in purple are the actual codes for arriving at this point. The results are
actually illustrated in white and it is a straight forward thing and can actually be seen and the
variables that do not have figures can as well be seen. This can be visualized and the actual
visualization will be;
Figure 2
⊘ This is a preview!⊘
Do you want full access?
Subscribe today to unlock all pages.

Trusted by 1+ million students worldwide

ANALYSIS 7
In this case, only total charges lack 0.15 per cent of its cases. This gets imputed and thereafter
there can be the actual analysis on a complete data set. After the clean-up of the dataset, the
name can be changed and in my case, the dataset was changed to NewChurn.
The new data set can now be analyzed for constants statistical values using the
summary(NewChurn) code line. Here there will be the analysis output of all the variable types.
The outputs are as below;
Figure 3
Paraphrase This Document
Need a fresh take? Get an instant paraphrase of this document with our AI Paraphraser

ANALYSIS 8
Figure 4
Figure 4

ANALYSIS 9
Figure 5
From all the figure of the constant analysis above, it is clear to see how the numeric variables
and the integer variables give constants like mean median, mode, max, min, and the quartiles.
The factor variables, on the other hand, give the counts of the responses that there are in a
variable. Looking at the variable of interest, we find out that there are 5174 Nos and 1869 Yes.
From here there are more loyal customers and less non-loyal customers. The constants can also
be gotten by the central tendencies codes.
Looking at the plots of both a numerical variable and factor variable, we will focus on the
histograms and the box plots. The variables of choice will be the histogram and the box plot. The
display for tenure will be as below;
⊘ This is a preview!⊘
Do you want full access?
Subscribe today to unlock all pages.

Trusted by 1+ million students worldwide

ANALYSIS 10
Histogram 1
Those that have been served for the least amount are the most amongst customers and the
number drops drastically in the medium tenure period. When it comes to those who have been
served for a good amount of time, the number goes up a bit.
Histogram 1
Those that have been served for the least amount are the most amongst customers and the
number drops drastically in the medium tenure period. When it comes to those who have been
served for a good amount of time, the number goes up a bit.
Paraphrase This Document
Need a fresh take? Get an instant paraphrase of this document with our AI Paraphraser

ANALYSIS 11
Box 1
In the tenure column, there are no outliers what’s so ever.
There will be no boxplot for the factor variables and the only plot that will be witnessed are the
bar plots. Take for instance the multiple lines column there are three replies and the bar plot is as
below;
Box 1
In the tenure column, there are no outliers what’s so ever.
There will be no boxplot for the factor variables and the only plot that will be witnessed are the
bar plots. Take for instance the multiple lines column there are three replies and the bar plot is as
below;

ANALYSIS 12
Bar plot 1
From the actual entries show that those that did not have multiple lines because of lack of phone
services are very few. This indicates that there is also a number that does not have phone service
at all. An indication that telecommunication infrastructure is not developed by the firm.
The next thing that will be focused will be the development of a bivariate analysis on the
variable of interest on maybe the monthly charges column. When this is done in the R script, it
will be evident to see the constants of the monthly charges column as per the No and Yes entries.
This can be done using the code; by(NewChurn$TotalCharges, NewChurn$Churn, summary).
The boxplot that is derived from this will be;
⊘ This is a preview!⊘
Do you want full access?
Subscribe today to unlock all pages.

Trusted by 1+ million students worldwide
1 out of 18
Related Documents

Your All-in-One AI-Powered Toolkit for Academic Success.
+13062052269
info@desklib.com
Available 24*7 on WhatsApp / Email
Unlock your academic potential
Copyright © 2020–2025 A2Z Services. All Rights Reserved. Developed and managed by ZUCOL.