Marketing Analytics: Tesco PLC Customer Churn Analysis
VerifiedAdded on 2023/06/08
|18
|4139
|78
Report
AI Summary
This report provides an analysis of a dataset from Tesco PLC, a British multinational supermarket chain. The objective is to predict customer churn using binary classification trees and evaluate the model's performance through the RFM (Recency, Frequency, Monetary) method. The report includes an introduction to the problem, a literature review of relevant research, and a description of the dataset, which contains data on 30,000 Tesco Clubcard customers. The methodology section details the use of IBM SPSS Modeler for binary classification and Excel for RFM analysis. The results section presents the findings from both techniques, and an evaluation of the model's effectiveness. The report concludes with recommendations for Tesco PLC to improve customer retention and reduce marketing expenditures. The report also discusses the importance of customer data in understanding customer behavior and making customized offers. The report uses techniques like Classification and Regression (C&R) and RFM to analyze the data.

marketing analytics
Paraphrase This Document
Need a fresh take? Get an instant paraphrase of this document with our AI Paraphraser

Executive summary
This activity intends to break down the dataset that is provided for delivering successful
results for the Tesco PLC organization. It is an organization which refers to the British
multinational market chain. Basically, it’s headquarter in located in Welwyn Garden city,
United Kingdom, England and Hertfordshire. In the world, as per marketplace it has top
rankings, as the largest retailer and largest income gaining retailer. Nearly, its shops are
spread out in twelve countries of Europe and Asia. The ranking positions are 3rd and 2nd
respectively. The following are the products it sells, Bakery, Grocery, Apparel, Deli, Fresh
Produce, Liquor, Dairy, Meat and the General Merchandise. It benefits are expanded by
boosting in the certainty with two levels such as Gold and Silver. Tesco developed as the UK
largest store chain, which actually transformed the grocery store business of the country. It
dispatches club card point where the cardholders could gather one club card point for each
one Europe they pay in its Website and in Tesco Stores. A model needs to be built which will
predict the clients’ troubles. This information is gather with the help of using the binary
classification trees. Further, the developed model exhibitions are assessed, with the help of
RFM technique. With the help of SPSS modeller programming, the Binary characterization
strategy is completed. Whereas, the RFM technique is completed with the help of Excel.
1
Table of Contents
1 Introduction.......................................................................................................................3
2 Problem Definition............................................................................................................3
3 Literature Review.............................................................................................................4
4 Data Set..............................................................................................................................5
5 Methodology......................................................................................................................5
6 Analysis and Results.........................................................................................................8
6.1 Classification and Regression (C&R) – IBM SPSS Modeller...............................8
6.2 RFM Method– Excel...............................................................................................12
6.3 Evaluation................................................................................................................13
7 Conclusion and Recommendations...............................................................................14
References...............................................................................................................................16
2
⊘ This is a preview!⊘
Do you want full access?
Subscribe today to unlock all pages.
Trusted by 1+ million students worldwide
1 Introduction
This project intends to break down the dataset that is provided for delivering successful
results for the Tesco PLC organization. It is an organization which refers to the British
multinational market chain. Basically, it’s headquarter in located in Welwyn Garden city,
United Kingdom, England and Hertfordshire. On the planet, this general store chain positions
as the 3rd greatest retailer, for its incomes it has again positioned as the second greatest
retailer. Crosswise over Europe and Asia, it contains stores in almost twelve nations. In the
UK, Thailand, Hungary, and in Malaysia, it has turned into the market pioneer for the basic
supply showcase. The following products it sells includes, Deli, Bakery, Apparel, Fresh
Produce, Dairy, Liquor, Grocery, Meat and the General Merchandise. It benefits are
expanded by boosting in the certainty with two levels such as Gold and Silver. Tesco
advancement to wind up the UK greatest general store chain, besides it essentially adjusted
the market business of the nation. It dispatches club card point where the cardholders could
gather one club card point for each one Europe they pay in its Website and in Tesco Stores.
Such as procedure is used for giving chance to the organization for accumulating the
information related to clients’ purchase behaviour, which can be used to make customized
offers and it can lead the proposed maintenance struggles. This report plans to build a model
which can foresee the client’s troubles from the provided informational indexes, where the
Classification and Regression (C&R) is used and the developed model exhibitions are
accessed. Additionally, the developed model exhibitions is assessed with the help of RFM
strategy. This report will examine all these aspects briefly. With the help of SPSS modeller
programming, the Binary characterization strategy is completed. Whereas, the RFM
technique is completed with the help of Excel.
2 Problem Definition
The Tesco PLC general store tie requires to investigate the given dataset to develop the
model to anticipate the client agitate from gave informational collections by utilizing the
parallel classification trees and furthermore assess the built model exhibitions. Likewise,
assess the developed model exhibitions by utilizing the RFM strategy. The Binary
classification trees technique is finished by utilizing the SPSS modeler programming and
RFM strategy is finished by utilizing Excel. These are will be broke down and executed.
These examination are must be contribute the client maintenance and diminishes the
3
Paraphrase This Document
Need a fresh take? Get an instant paraphrase of this document with our AI Paraphraser
promoting use on the grounds that the present offers are does not decreases the advertising
use (Clemente, Giner-Bosch and San Matías, 2018).
3 Literature Review
As per this paper (Tamaddoni, Stakhovych& Ewing, 2015), one of the issues from
Customer beat expectation is the stress to the present associations. Perceptive models can be
delivered for recognizing future churners. As the amount of suitable gathering systems
assembles, it has ended up being harder to assess which one is the best for our application and
which parameters to use for its endorsement. To pick the most legitimate system, alternate
points of view isolated from precision which is the most understood parameter can and
should be considered as: quality, speed, interpretability and comfort. In this paper we propose
a reasoning for evaluating truthful models for game plan with the use of a composite marker.
This composite pointer gauges multidimensional thoughts which can't be gotten by a lone
parameter and help pioneers to deal with this staggering issue. Three decisions are proposed
giving particular weights to the included parameters considering the last client's needs. Our
framework finds which the best classifier is by boosting the estimation of the composite
marker. We test our recommendation on a game plan of five beat arrange models drawn from
a honest to goodness issue, three of them being established on solitary classifiers and the
other two being worked by using solidified classifiers. Another extra regard offered by this
work is to consider the data factors decision impact on the execution of the mix desire appear.
We will consider four interesting decisions: one of a kind components, add up to factors
(together with one of a kind ones), Principal part investigation (PCA) and stacking system.
Numerical results using bona fide data from a Spanish retailing association are shown and
inspected remembering the true objective to exhibit the execution and authenticity of our
suggestion.
This paper depicts (Dingli, Marmara and Fournier, 2017), Customer are one of the
association's most essential assets. In perspective of this, associations need to give clients'
persuading powers with a specific objective for holding and to develop the business. A
negative cooperation with a clients may infer that Customer may blend. A basic edge inside
the business is to have a not too bad understanding of client's needs, whereby widely
inclusive points of view of their precedents may be explored. Transversely over endeavours,
data on client's economics, important esteem based data and once in a while shopper
steadfastness (Net Promoter Scores) are secured and may be used for examination.
Researchers analyse that earnings and edges increase if the right Customer are held
4
conversely with attracting new ones. With data mining frameworks, data may be taken care
of and separated to recognize examples and individual lead measures. Researchers
furthermore discuss that it is winding up more gainful to apply data mining systems instead
of free quantifiable models to foresee results. The reason behind this, is a result of the steady
augmentation in data. This paper discusses the data availability and examination required to
update and enhance business techniques to reduce Customer with a high tendency to beat.
The Customer who have been perceived as churners will be passed on to the Sales and
Marketing gathering of the adjacent supermarket. A more significant understanding with
respect to why these Customer may deliver will be passed on. Following this, using the info
achieved from the Customer, a support campaign will be proposed to center around the
conceivable beating Customer.
4 Data Set
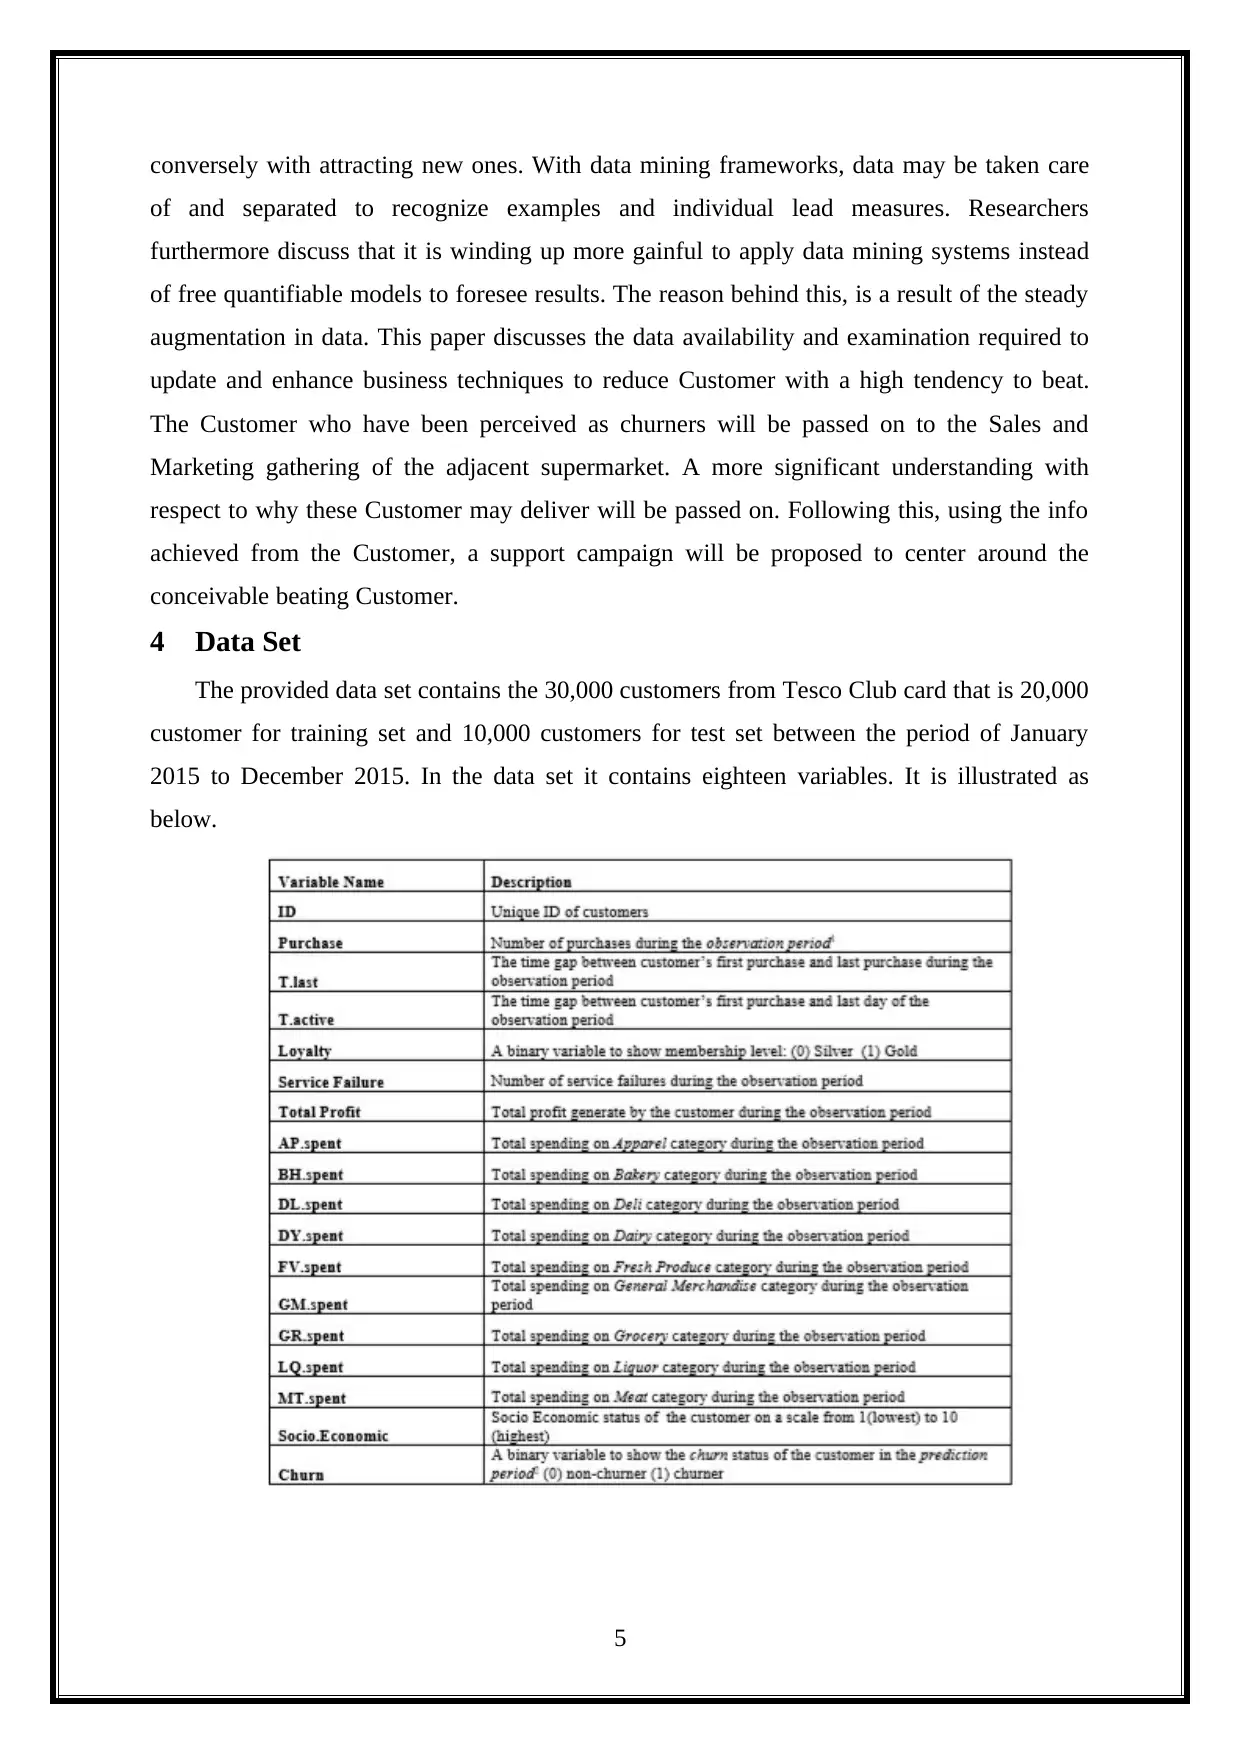
The provided data set contains the 30,000 customers from Tesco Club card that is 20,000
customer for training set and 10,000 customers for test set between the period of January
2015 to December 2015. In the data set it contains eighteen variables. It is illustrated as
below.
5
of and separated to recognize examples and individual lead measures. Researchers
furthermore discuss that it is winding up more gainful to apply data mining systems instead
of free quantifiable models to foresee results. The reason behind this, is a result of the steady
augmentation in data. This paper discusses the data availability and examination required to
update and enhance business techniques to reduce Customer with a high tendency to beat.
The Customer who have been perceived as churners will be passed on to the Sales and
Marketing gathering of the adjacent supermarket. A more significant understanding with
respect to why these Customer may deliver will be passed on. Following this, using the info
achieved from the Customer, a support campaign will be proposed to center around the
conceivable beating Customer.
4 Data Set
The provided data set contains the 30,000 customers from Tesco Club card that is 20,000
customer for training set and 10,000 customers for test set between the period of January
2015 to December 2015. In the data set it contains eighteen variables. It is illustrated as
below.
5
⊘ This is a preview!⊘
Do you want full access?
Subscribe today to unlock all pages.
Trusted by 1+ million students worldwide
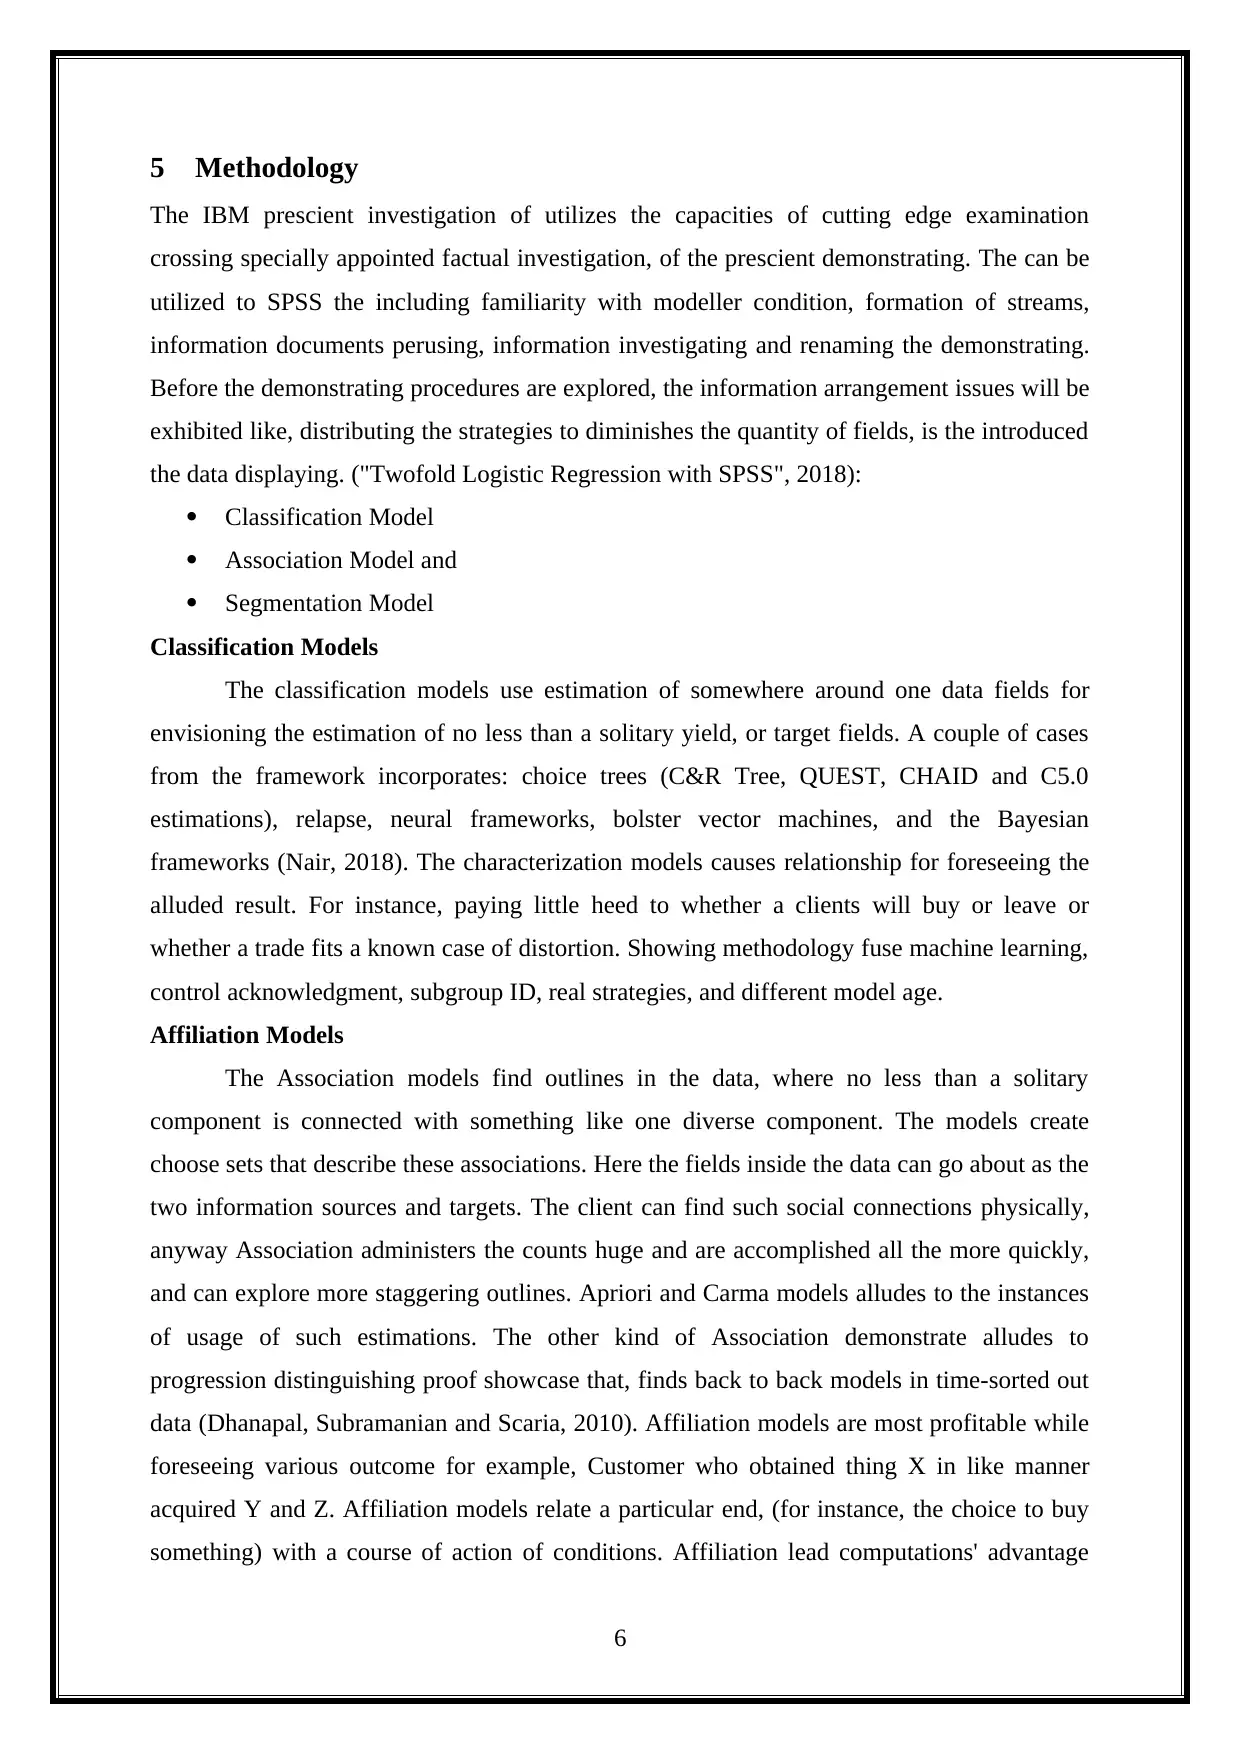
5 Methodology
The IBM prescient investigation of utilizes the capacities of cutting edge examination
crossing specially appointed factual investigation, of the prescient demonstrating. The can be
utilized to SPSS the including familiarity with modeller condition, formation of streams,
information documents perusing, information investigating and renaming the demonstrating.
Before the demonstrating procedures are explored, the information arrangement issues will be
exhibited like, distributing the strategies to diminishes the quantity of fields, is the introduced
the data displaying. ("Twofold Logistic Regression with SPSS", 2018):
Classification Model
Association Model and
Segmentation Model
Classification Models
The classification models use estimation of somewhere around one data fields for
envisioning the estimation of no less than a solitary yield, or target fields. A couple of cases
from the framework incorporates: choice trees (C&R Tree, QUEST, CHAID and C5.0
estimations), relapse, neural frameworks, bolster vector machines, and the Bayesian
frameworks (Nair, 2018). The characterization models causes relationship for foreseeing the
alluded result. For instance, paying little heed to whether a clients will buy or leave or
whether a trade fits a known case of distortion. Showing methodology fuse machine learning,
control acknowledgment, subgroup ID, real strategies, and different model age.
Affiliation Models
The Association models find outlines in the data, where no less than a solitary
component is connected with something like one diverse component. The models create
choose sets that describe these associations. Here the fields inside the data can go about as the
two information sources and targets. The client can find such social connections physically,
anyway Association administers the counts huge and are accomplished all the more quickly,
and can explore more staggering outlines. Apriori and Carma models alludes to the instances
of usage of such estimations. The other kind of Association demonstrate alludes to
progression distinguishing proof showcase that, finds back to back models in time-sorted out
data (Dhanapal, Subramanian and Scaria, 2010). Affiliation models are most profitable while
foreseeing various outcome for example, Customer who obtained thing X in like manner
acquired Y and Z. Affiliation models relate a particular end, (for instance, the choice to buy
something) with a course of action of conditions. Affiliation lead computations' advantage
6
Paraphrase This Document
Need a fresh take? Get an instant paraphrase of this document with our AI Paraphraser
over the more standard choice tree estimations (C5.0 and C&RT) incorporates, Associations
could be among any of the characteristics. The choice tree estimation creates the standards
with only a singular end, while the Association computations attempt for finding various
principles, each one of which may have a flip side (S. Fader, 2018).
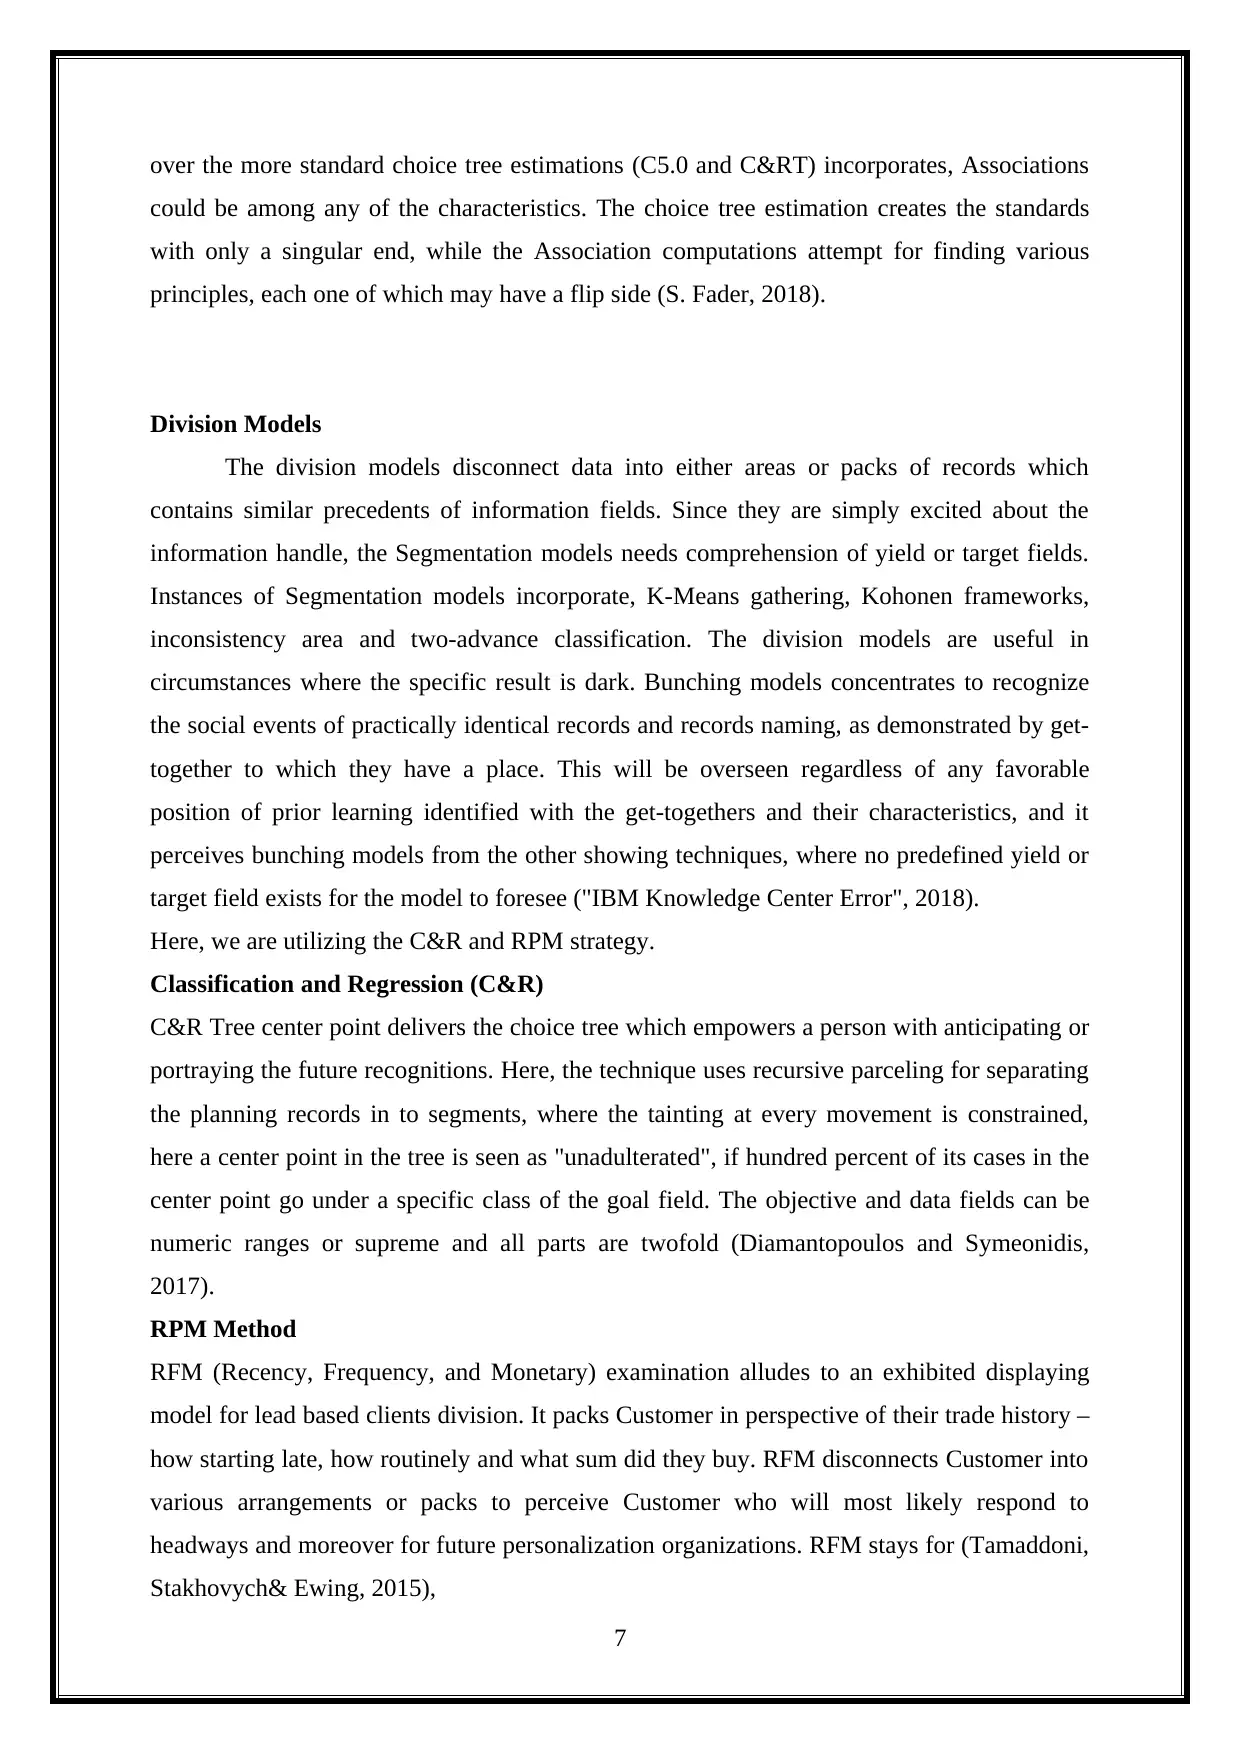
Division Models
The division models disconnect data into either areas or packs of records which
contains similar precedents of information fields. Since they are simply excited about the
information handle, the Segmentation models needs comprehension of yield or target fields.
Instances of Segmentation models incorporate, K-Means gathering, Kohonen frameworks,
inconsistency area and two-advance classification. The division models are useful in
circumstances where the specific result is dark. Bunching models concentrates to recognize
the social events of practically identical records and records naming, as demonstrated by get-
together to which they have a place. This will be overseen regardless of any favorable
position of prior learning identified with the get-togethers and their characteristics, and it
perceives bunching models from the other showing techniques, where no predefined yield or
target field exists for the model to foresee ("IBM Knowledge Center Error", 2018).
Here, we are utilizing the C&R and RPM strategy.
Classification and Regression (C&R)
C&R Tree center point delivers the choice tree which empowers a person with anticipating or
portraying the future recognitions. Here, the technique uses recursive parceling for separating
the planning records in to segments, where the tainting at every movement is constrained,
here a center point in the tree is seen as "unadulterated", if hundred percent of its cases in the
center point go under a specific class of the goal field. The objective and data fields can be
numeric ranges or supreme and all parts are twofold (Diamantopoulos and Symeonidis,
2017).
RPM Method
RFM (Recency, Frequency, and Monetary) examination alludes to an exhibited displaying
model for lead based clients division. It packs Customer in perspective of their trade history –
how starting late, how routinely and what sum did they buy. RFM disconnects Customer into
various arrangements or packs to perceive Customer who will most likely respond to
headways and moreover for future personalization organizations. RFM stays for (Tamaddoni,
Stakhovych& Ewing, 2015),
7
could be among any of the characteristics. The choice tree estimation creates the standards
with only a singular end, while the Association computations attempt for finding various
principles, each one of which may have a flip side (S. Fader, 2018).
Division Models
The division models disconnect data into either areas or packs of records which
contains similar precedents of information fields. Since they are simply excited about the
information handle, the Segmentation models needs comprehension of yield or target fields.
Instances of Segmentation models incorporate, K-Means gathering, Kohonen frameworks,
inconsistency area and two-advance classification. The division models are useful in
circumstances where the specific result is dark. Bunching models concentrates to recognize
the social events of practically identical records and records naming, as demonstrated by get-
together to which they have a place. This will be overseen regardless of any favorable
position of prior learning identified with the get-togethers and their characteristics, and it
perceives bunching models from the other showing techniques, where no predefined yield or
target field exists for the model to foresee ("IBM Knowledge Center Error", 2018).
Here, we are utilizing the C&R and RPM strategy.
Classification and Regression (C&R)
C&R Tree center point delivers the choice tree which empowers a person with anticipating or
portraying the future recognitions. Here, the technique uses recursive parceling for separating
the planning records in to segments, where the tainting at every movement is constrained,
here a center point in the tree is seen as "unadulterated", if hundred percent of its cases in the
center point go under a specific class of the goal field. The objective and data fields can be
numeric ranges or supreme and all parts are twofold (Diamantopoulos and Symeonidis,
2017).
RPM Method
RFM (Recency, Frequency, and Monetary) examination alludes to an exhibited displaying
model for lead based clients division. It packs Customer in perspective of their trade history –
how starting late, how routinely and what sum did they buy. RFM disconnects Customer into
various arrangements or packs to perceive Customer who will most likely respond to
headways and moreover for future personalization organizations. RFM stays for (Tamaddoni,
Stakhovych& Ewing, 2015),
7
• Recency – How starting late the clients acquired
• Frequency – How often the clients purchases
• Monetary (or once in a while Margin) – How much they spend
Each one of these measures is a basic pointer of how extraordinary a clients they are, yet
together you get an exceptional scoring metric that can uncover to you a fantastic plan about
where (or who) your advantage is beginning from (Dingli, Marmara and Fournier, 2017).
6 Analysis and Results
Here, we will develop the model to foresee the client stir from gave informational
indexes by utilizing the twofold arrangement trees (Classification and Regression (C&R))
and assess the built model performances (Kashwan&Velu, 2013). Additionally, assess the
built model exhibitions by utilizing the RFM strategy. The Binary grouping trees strategy is
finished by utilizing the SPSS modeller programming and RFM technique is finished by
utilizing Excel("How to Use Excel to Identify Your Best Customers | CogniView Blog",
2018) , ,(Tsai and Lu, 2010).
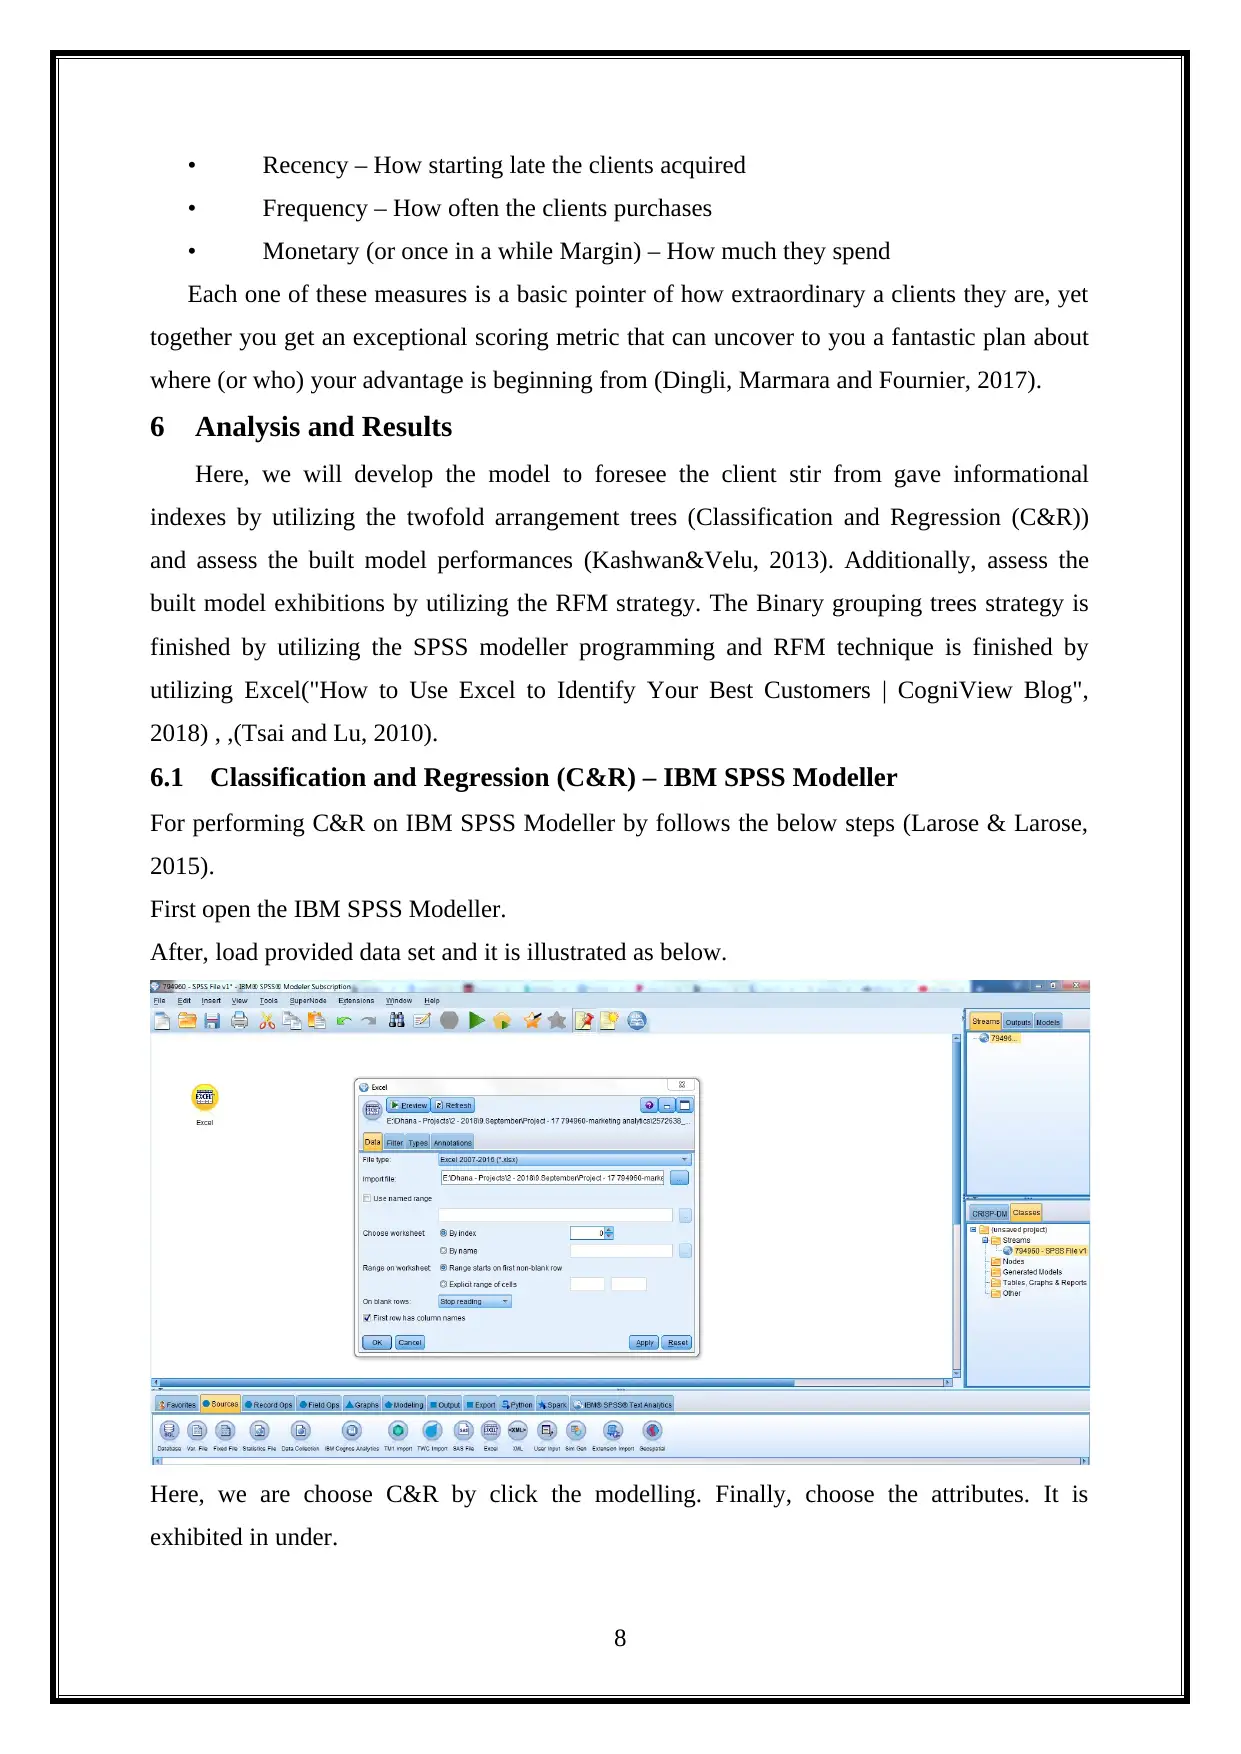
6.1 Classification and Regression (C&R) – IBM SPSS Modeller
For performing C&R on IBM SPSS Modeller by follows the below steps (Larose & Larose,
2015).
First open the IBM SPSS Modeller.
After, load provided data set and it is illustrated as below.
Here, we are choose C&R by click the modelling. Finally, choose the attributes. It is
exhibited in under.
8
• Frequency – How often the clients purchases
• Monetary (or once in a while Margin) – How much they spend
Each one of these measures is a basic pointer of how extraordinary a clients they are, yet
together you get an exceptional scoring metric that can uncover to you a fantastic plan about
where (or who) your advantage is beginning from (Dingli, Marmara and Fournier, 2017).
6 Analysis and Results
Here, we will develop the model to foresee the client stir from gave informational
indexes by utilizing the twofold arrangement trees (Classification and Regression (C&R))
and assess the built model performances (Kashwan&Velu, 2013). Additionally, assess the
built model exhibitions by utilizing the RFM strategy. The Binary grouping trees strategy is
finished by utilizing the SPSS modeller programming and RFM technique is finished by
utilizing Excel("How to Use Excel to Identify Your Best Customers | CogniView Blog",
2018) , ,(Tsai and Lu, 2010).
6.1 Classification and Regression (C&R) – IBM SPSS Modeller
For performing C&R on IBM SPSS Modeller by follows the below steps (Larose & Larose,
2015).
First open the IBM SPSS Modeller.
After, load provided data set and it is illustrated as below.
Here, we are choose C&R by click the modelling. Finally, choose the attributes. It is
exhibited in under.
8
⊘ This is a preview!⊘
Do you want full access?
Subscribe today to unlock all pages.
Trusted by 1+ million students worldwide
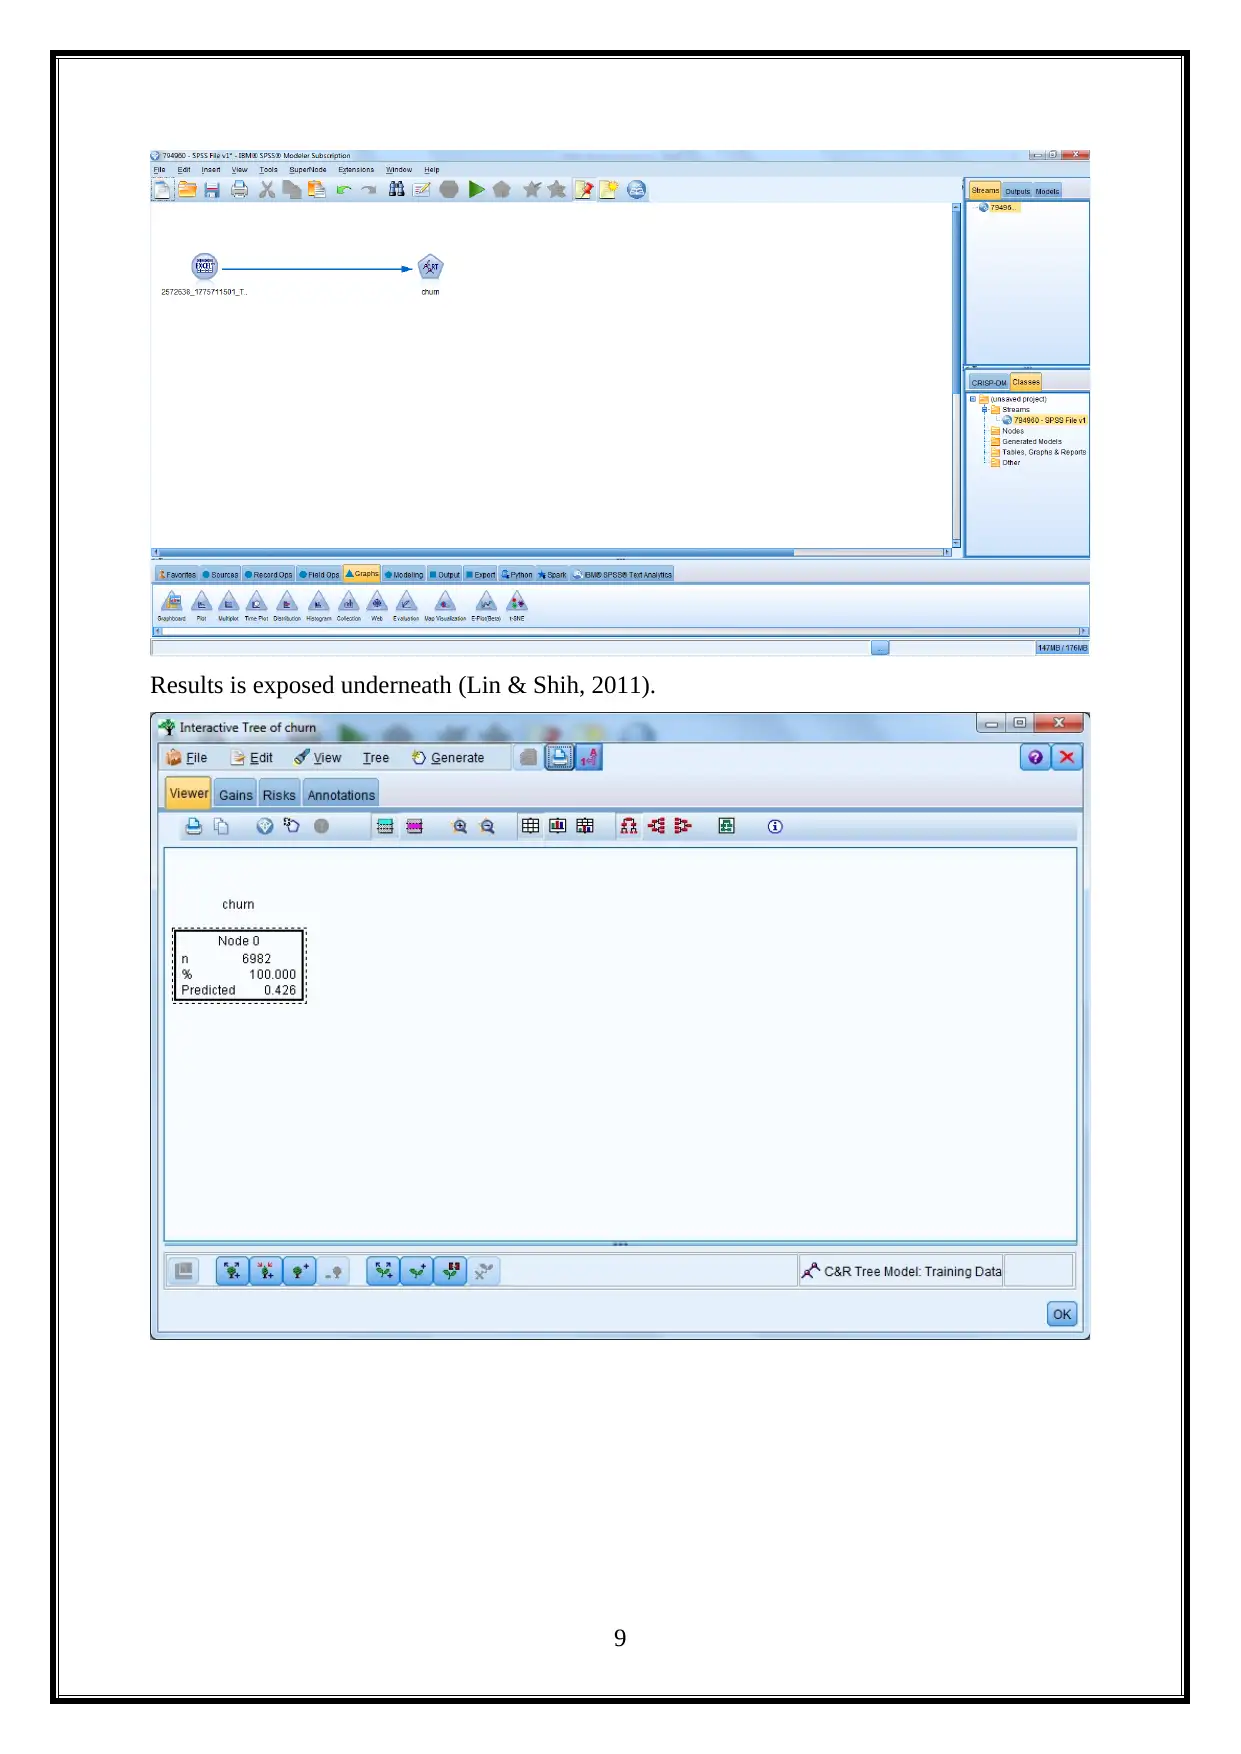
Results is exposed underneath (Lin & Shih, 2011).
9
9
Paraphrase This Document
Need a fresh take? Get an instant paraphrase of this document with our AI Paraphraser
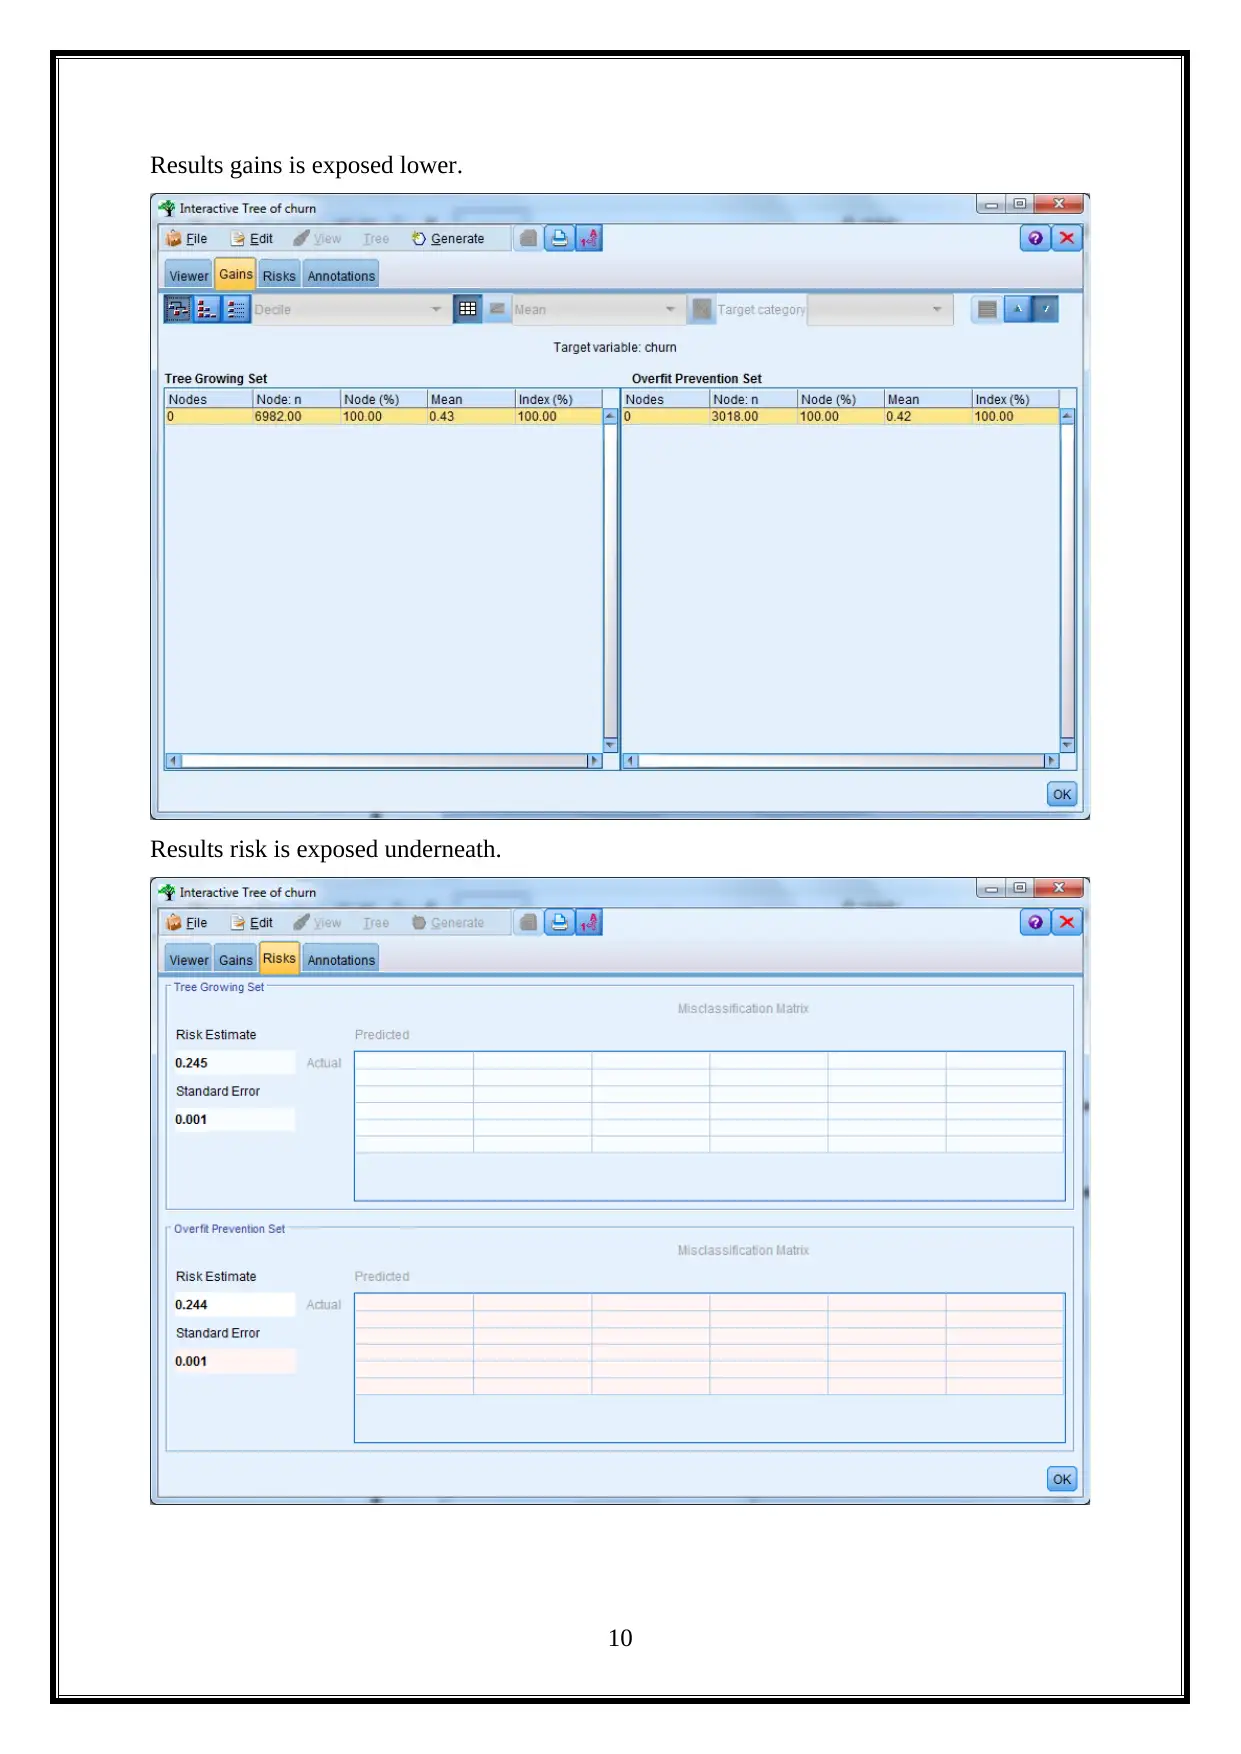
Results gains is exposed lower.
Results risk is exposed underneath.
10
Results risk is exposed underneath.
10
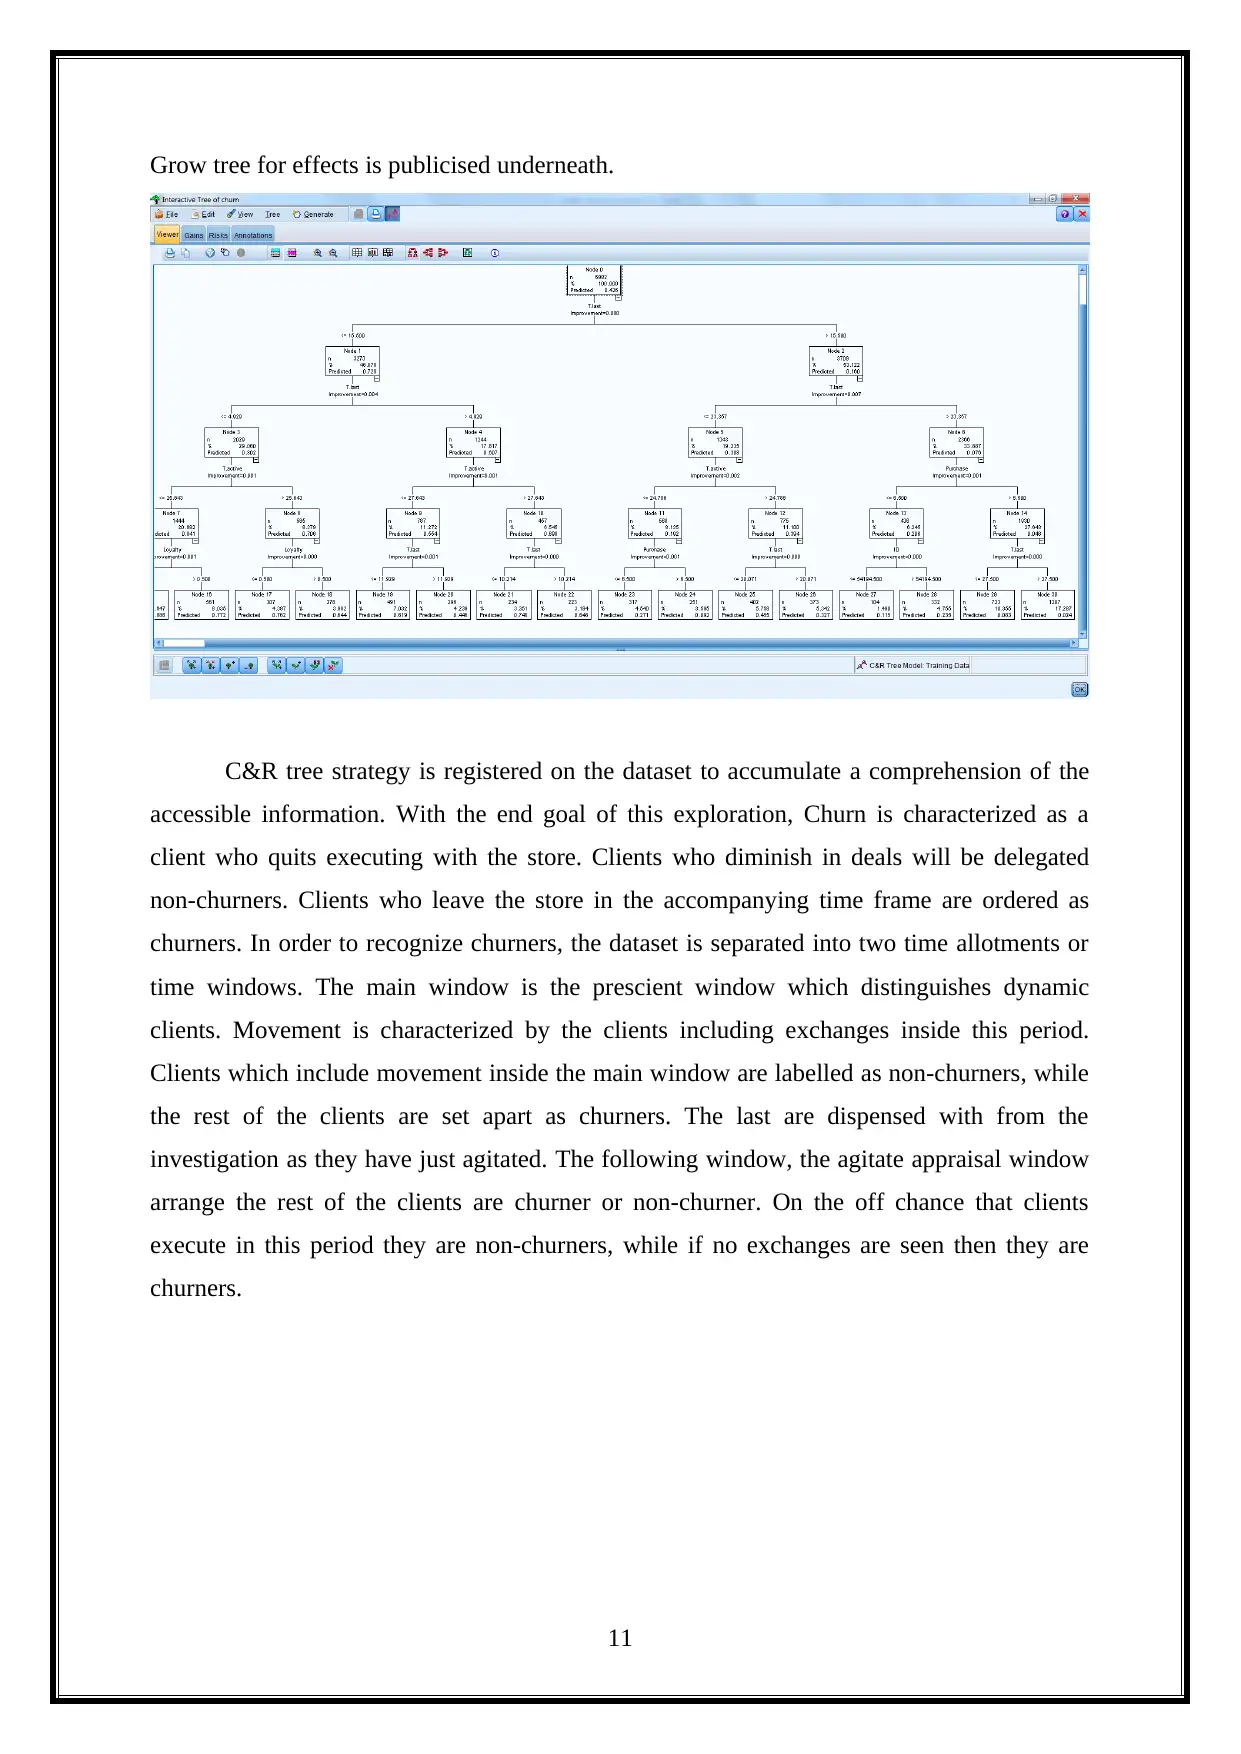
Grow tree for effects is publicised underneath.
C&R tree strategy is registered on the dataset to accumulate a comprehension of the
accessible information. With the end goal of this exploration, Churn is characterized as a
client who quits executing with the store. Clients who diminish in deals will be delegated
non-churners. Clients who leave the store in the accompanying time frame are ordered as
churners. In order to recognize churners, the dataset is separated into two time allotments or
time windows. The main window is the prescient window which distinguishes dynamic
clients. Movement is characterized by the clients including exchanges inside this period.
Clients which include movement inside the main window are labelled as non-churners, while
the rest of the clients are set apart as churners. The last are dispensed with from the
investigation as they have just agitated. The following window, the agitate appraisal window
arrange the rest of the clients are churner or non-churner. On the off chance that clients
execute in this period they are non-churners, while if no exchanges are seen then they are
churners.
11
⊘ This is a preview!⊘
Do you want full access?
Subscribe today to unlock all pages.
Trusted by 1+ million students worldwide
1 out of 18


Your All-in-One AI-Powered Toolkit for Academic Success.
+13062052269
info@desklib.com
Available 24*7 on WhatsApp / Email
![[object Object]](/_next/static/media/star-bottom.7253800d.svg)
Unlock your academic potential
Copyright © 2020–2026 A2Z Services. All Rights Reserved. Developed and managed by ZUCOL.