Customer Complaint Analysis Report: Performance and Analysis

Verified

Added on  2022/07/29

|5
|659
|21
Report
AI Summary
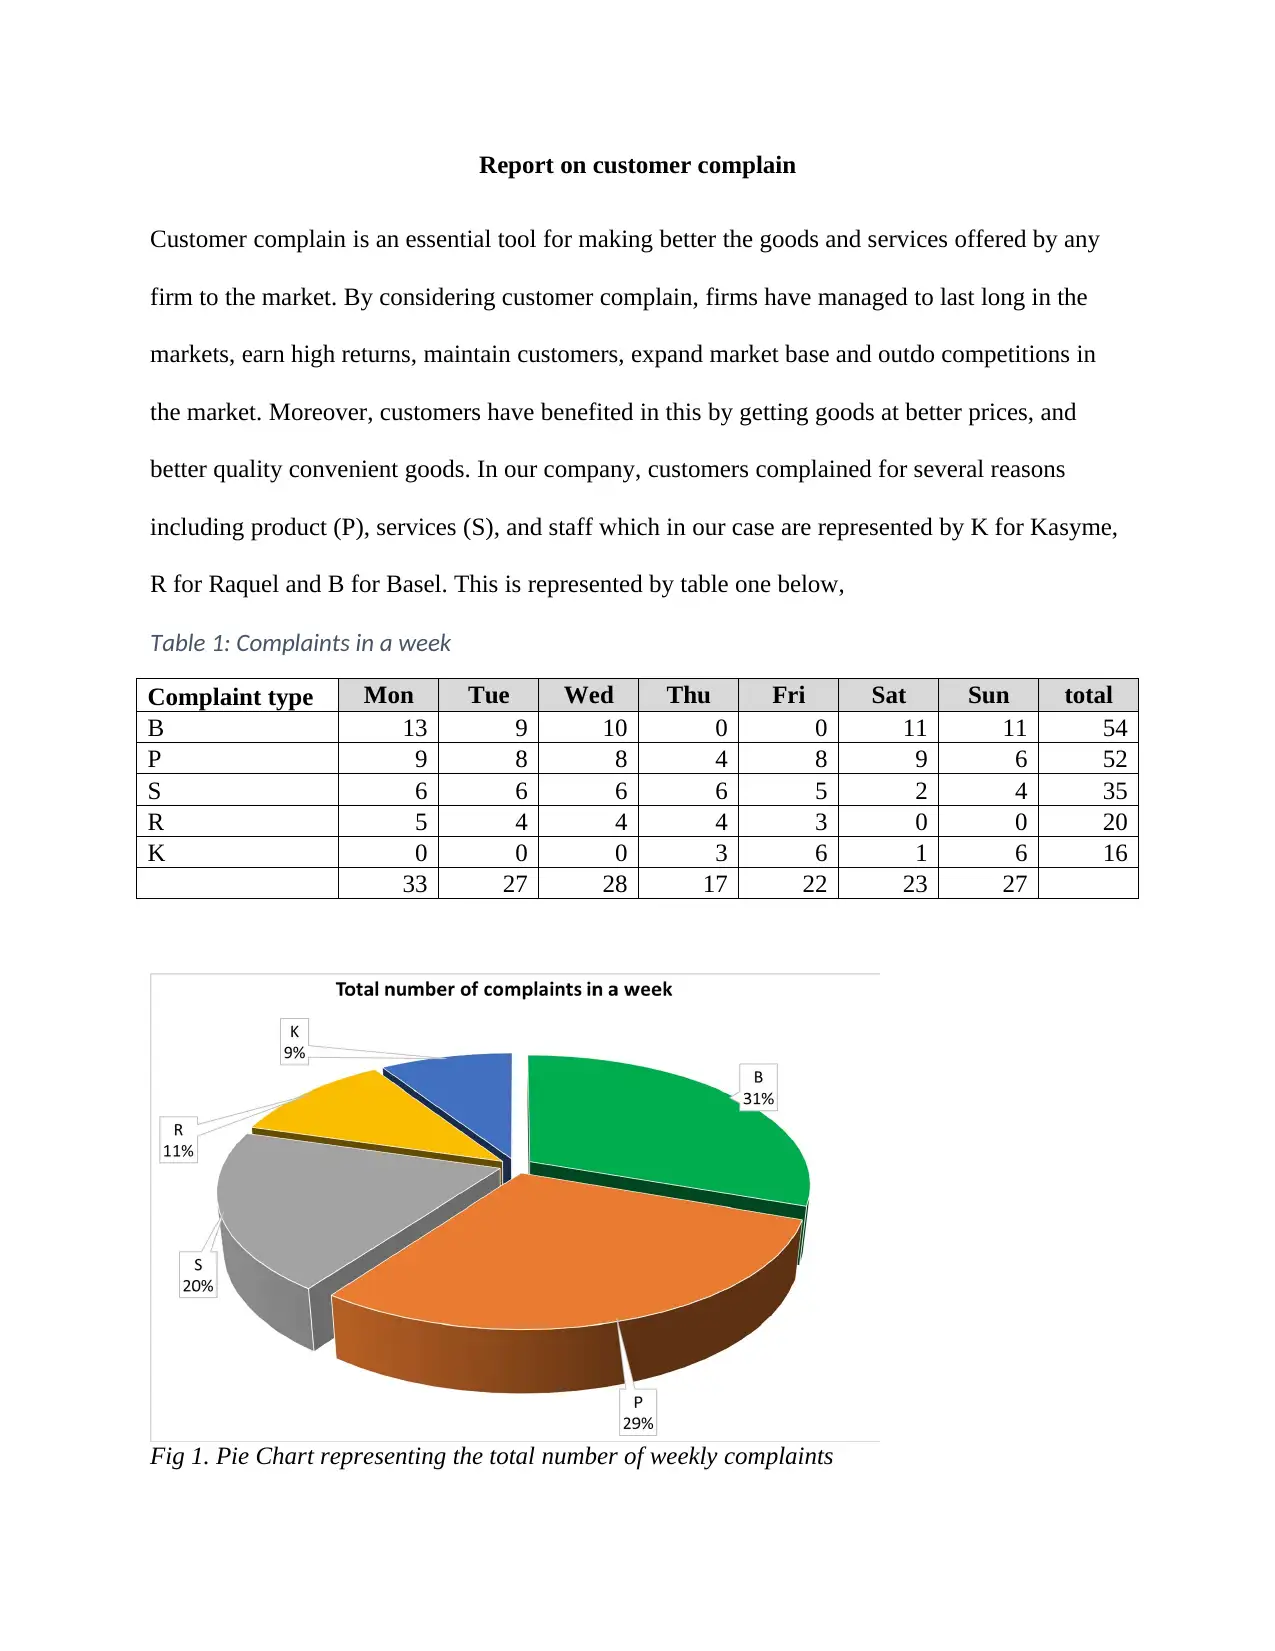
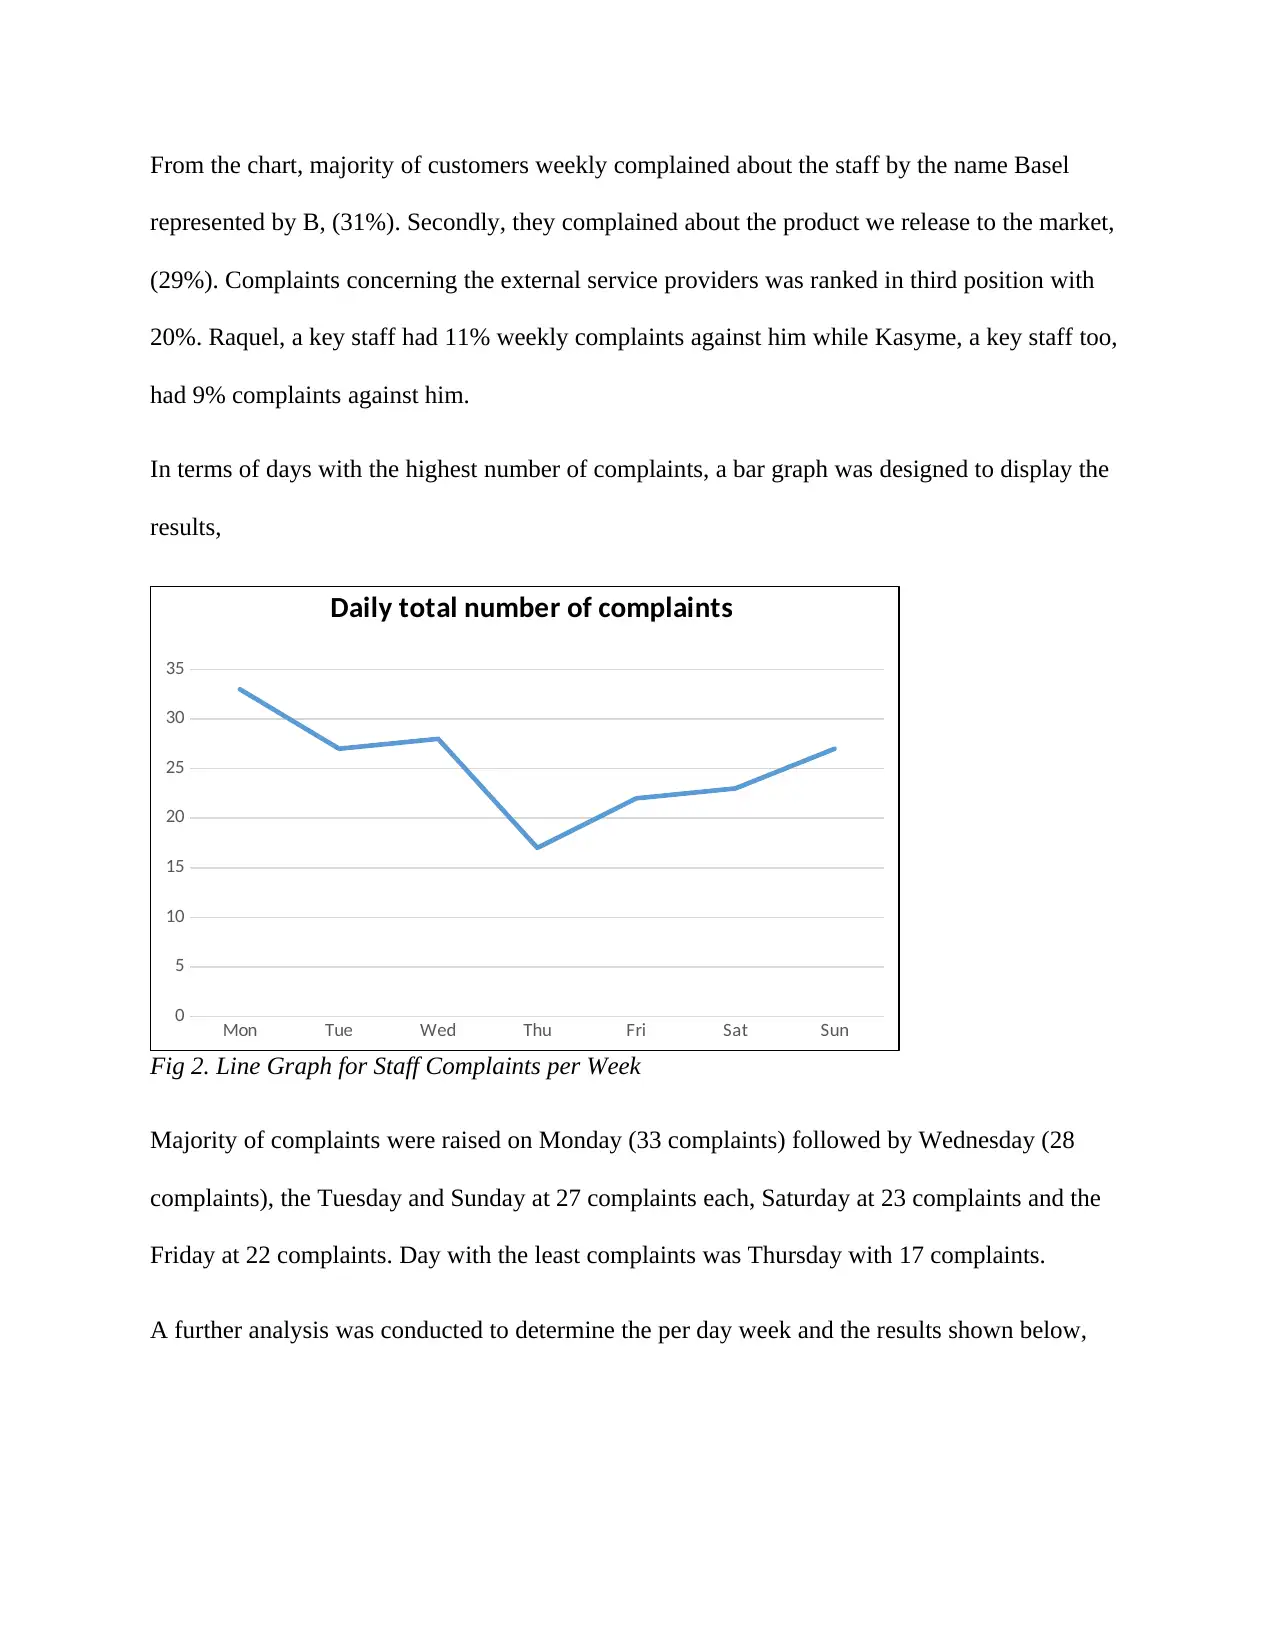
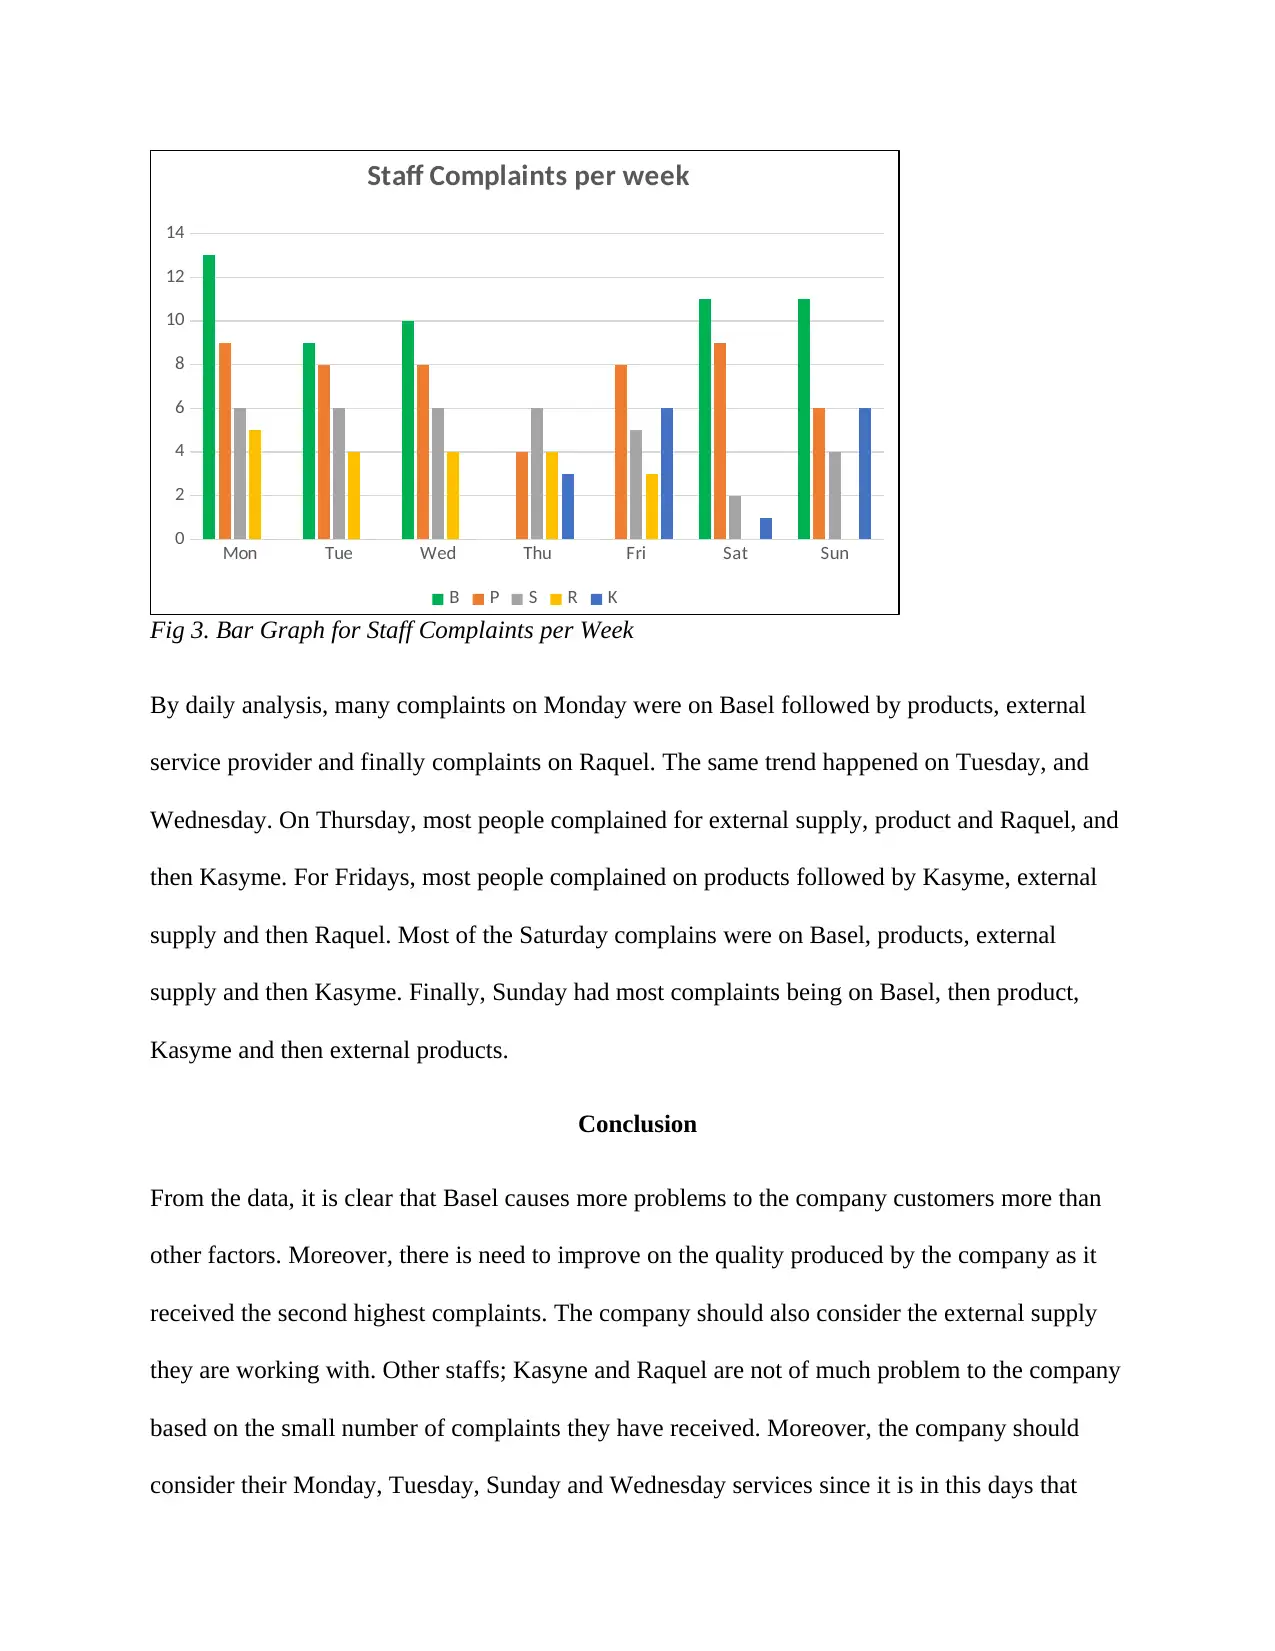
This report analyzes customer complaint data collected over a week, focusing on complaints related to staff (Kasyme, Raquel, Basel), products, and external services. The data is presented in tables and graphs, revealing that Basel is the primary source of customer complaints, followed by product quality issues. The report highlights the days with the highest complaint volumes and analyzes the root causes. It concludes by recommending improvements in product quality, external service providers, and staff performance, particularly focusing on Basel's impact. The report also suggests considering staff shift adjustments to regulate the number of complaints and improve customer satisfaction.
Document Page
Research and Analysis Report
Student’s Name
Institution
Date
tabler-icon-diamond-filled.svg

Secure Best Marks with AI Grader

Need help grading? Try our AI Grader for instant feedback on your assignments.
Document Page
Report on customer complain
Customer complain is an essential tool for making better the goods and services offered by any
firm to the market. By considering customer complain, firms have managed to last long in the
markets, earn high returns, maintain customers, expand market base and outdo competitions in
the market. Moreover, customers have benefited in this by getting goods at better prices, and
better quality convenient goods. In our company, customers complained for several reasons
including product (P), services (S), and staff which in our case are represented by K for Kasyme,
R for Raquel and B for Basel. This is represented by table one below,
Table 1: Complaints in a week
Complaint type Mon Tue Wed Thu Fri Sat Sun total
B 13 9 10 0 0 11 11 54
P 9 8 8 4 8 9 6 52
S 6 6 6 6 5 2 4 35
R 5 4 4 4 3 0 0 20
K 0 0 0 3 6 1 6 16
33 27 28 17 22 23 27
Fig 1. Pie Chart representing the total number of weekly complaints
Document Page
From the chart, majority of customers weekly complained about the staff by the name Basel
represented by B, (31%). Secondly, they complained about the product we release to the market,
(29%). Complaints concerning the external service providers was ranked in third position with
20%. Raquel, a key staff had 11% weekly complaints against him while Kasyme, a key staff too,
had 9% complaints against him.
In terms of days with the highest number of complaints, a bar graph was designed to display the
results,
Mon Tue Wed Thu Fri Sat Sun
0
5
10
15
20
25
30
35
Daily total number of complaints
Fig 2. Line Graph for Staff Complaints per Week
Majority of complaints were raised on Monday (33 complaints) followed by Wednesday (28
complaints), the Tuesday and Sunday at 27 complaints each, Saturday at 23 complaints and the
Friday at 22 complaints. Day with the least complaints was Thursday with 17 complaints.
A further analysis was conducted to determine the per day week and the results shown below,
Document Page
Mon Tue Wed Thu Fri Sat Sun
0
2
4
6
8
10
12
14
Staff Complaints per week
B P S R K
Fig 3. Bar Graph for Staff Complaints per Week
By daily analysis, many complaints on Monday were on Basel followed by products, external
service provider and finally complaints on Raquel. The same trend happened on Tuesday, and
Wednesday. On Thursday, most people complained for external supply, product and Raquel, and
then Kasyme. For Fridays, most people complained on products followed by Kasyme, external
supply and then Raquel. Most of the Saturday complains were on Basel, products, external
supply and then Kasyme. Finally, Sunday had most complaints being on Basel, then product,
Kasyme and then external products.
Conclusion
From the data, it is clear that Basel causes more problems to the company customers more than
other factors. Moreover, there is need to improve on the quality produced by the company as it
received the second highest complaints. The company should also consider the external supply
they are working with. Other staffs; Kasyne and Raquel are not of much problem to the company
based on the small number of complaints they have received. Moreover, the company should
consider their Monday, Tuesday, Sunday and Wednesday services since it is in this days that
tabler-icon-diamond-filled.svg

Secure Best Marks with AI Grader

Need help grading? Try our AI Grader for instant feedback on your assignments.
Document Page
they receive high number of complaints. Finally, the company should consider shifts for staff to
regulate the number of complaints as most of complaints arise when Basel is work which may
likely reduce the sales volume.
chevron_up_icon
1 out of 5
circle_padding
hide_on_mobile
zoom_out_icon
logo.png

Your All-in-One AI-Powered Toolkit for Academic Success.

Available 24*7 on WhatsApp / Email

[object Object]