Digital Marketing Report: Analyzing Customer Engagement Worldwide

Verified

Added on  2022/12/27

|20
|3860
|1
Report
AI Summary
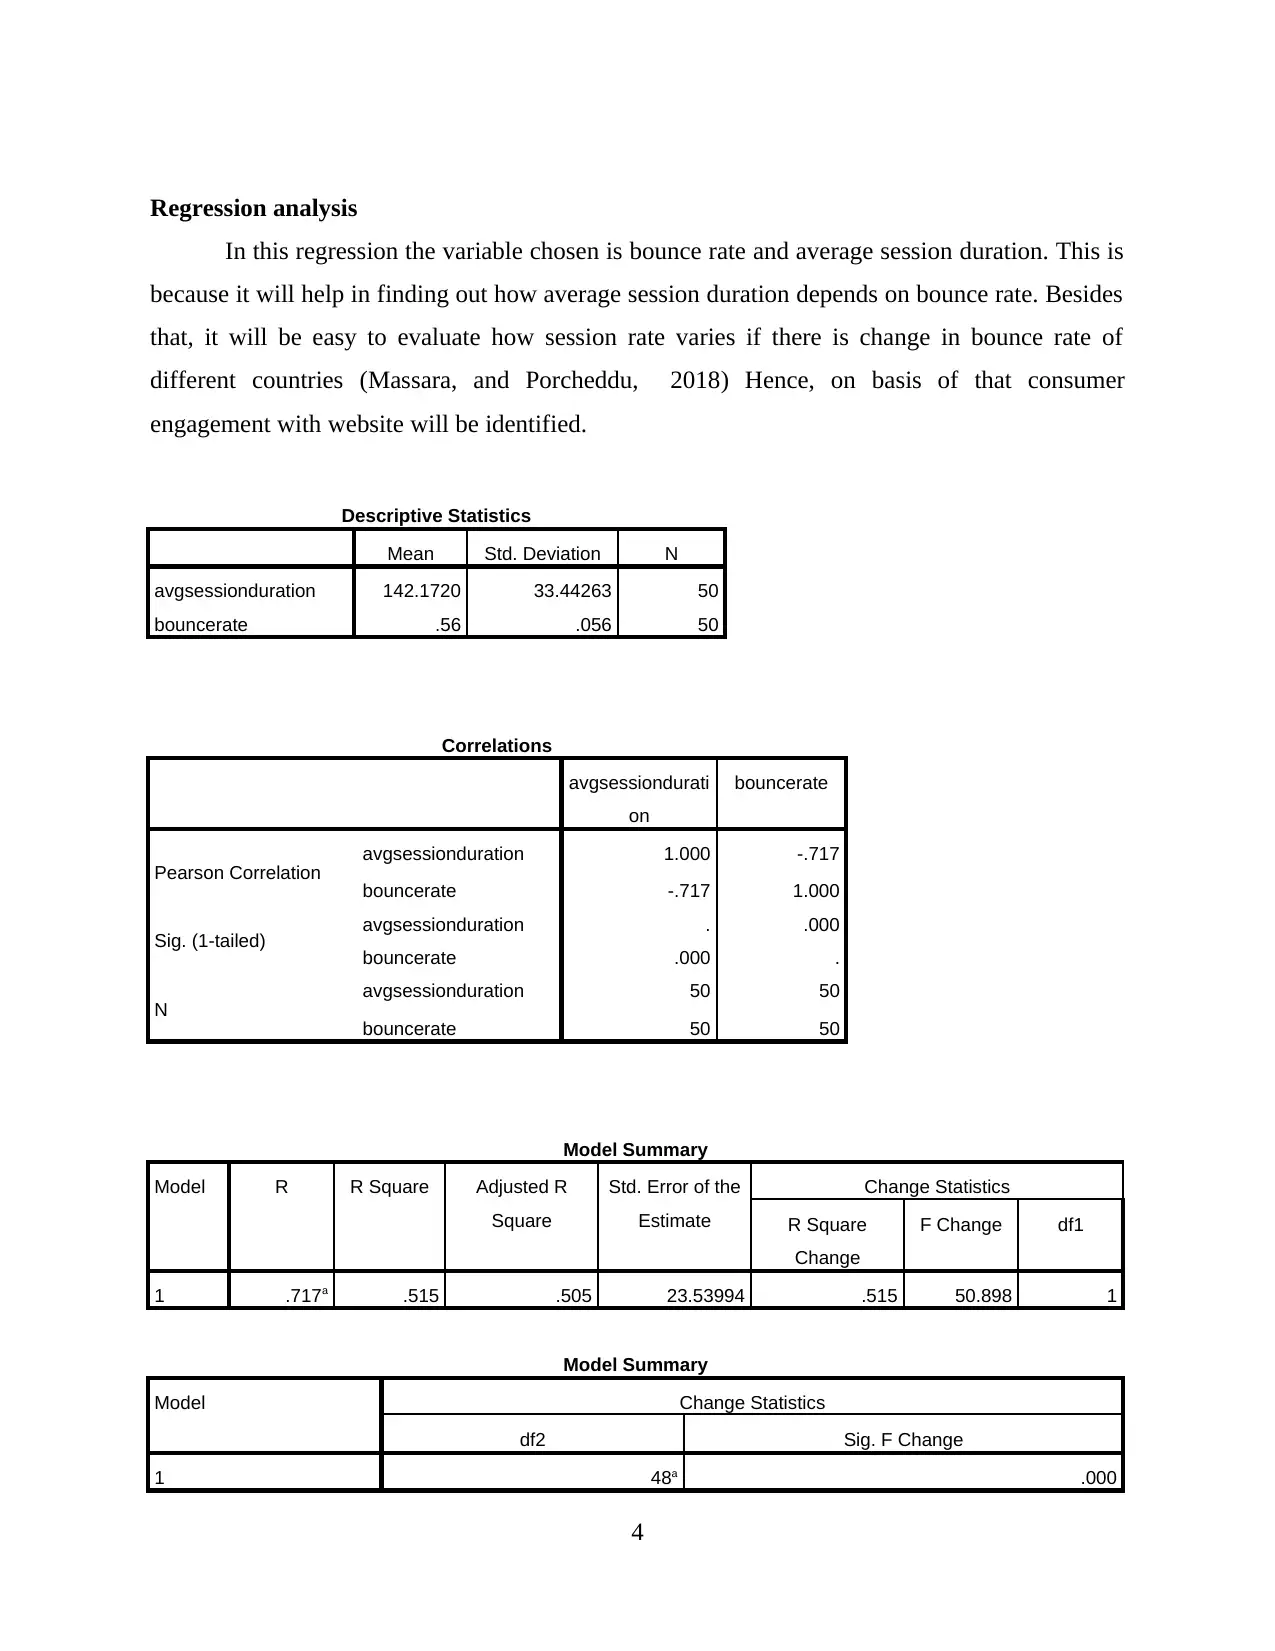
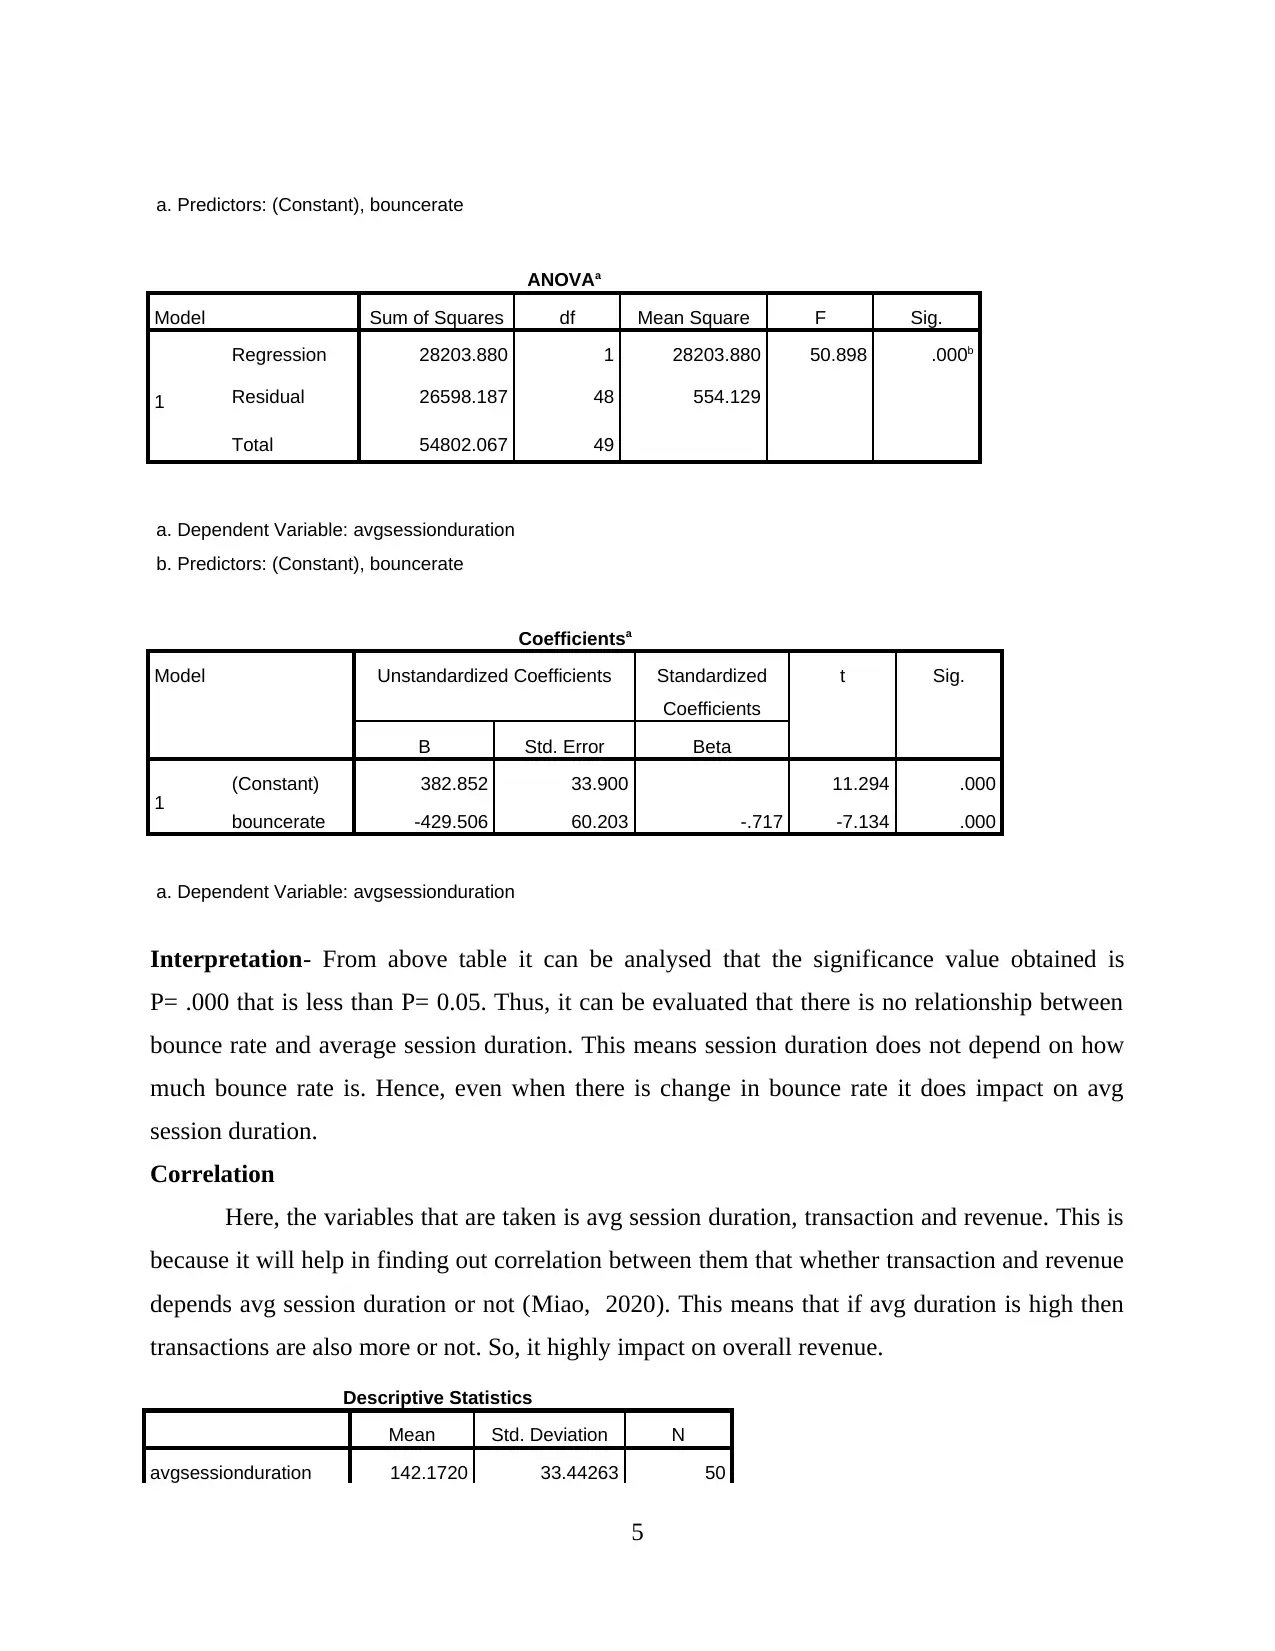
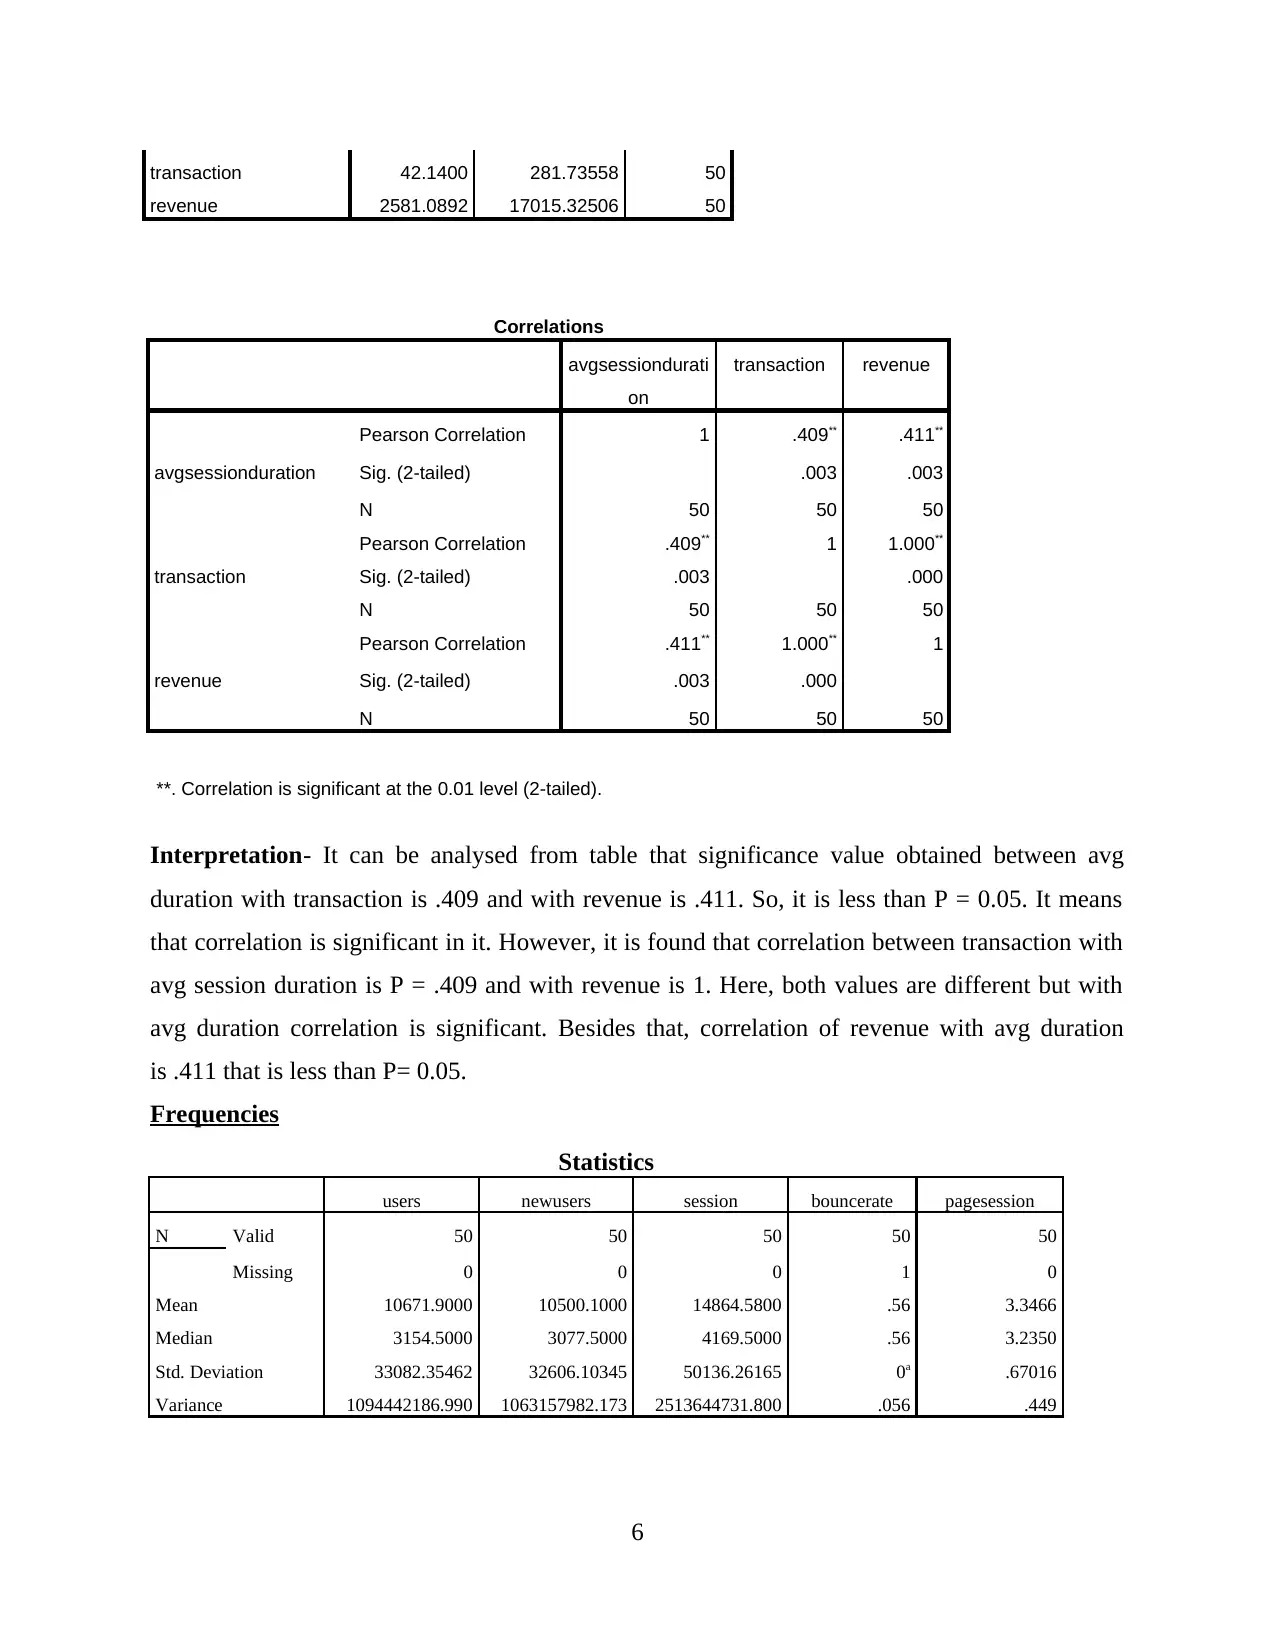
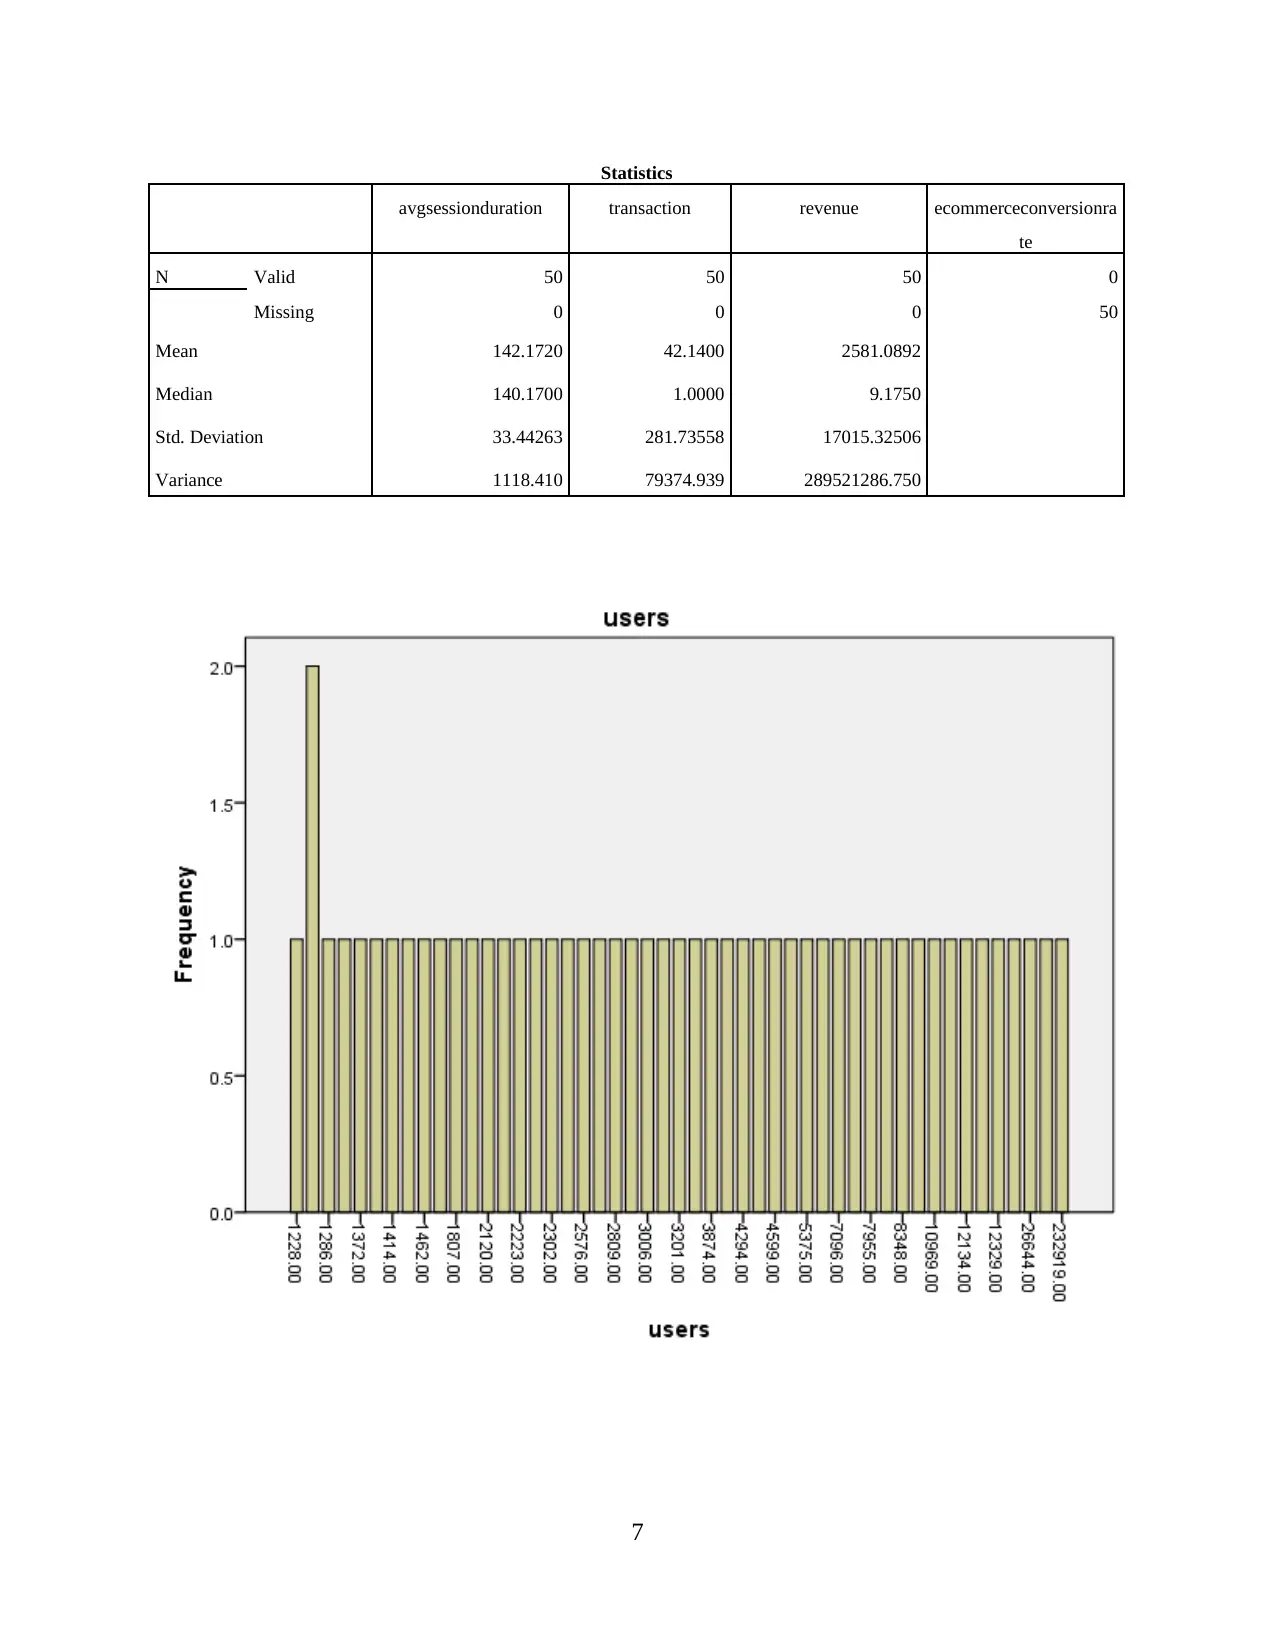
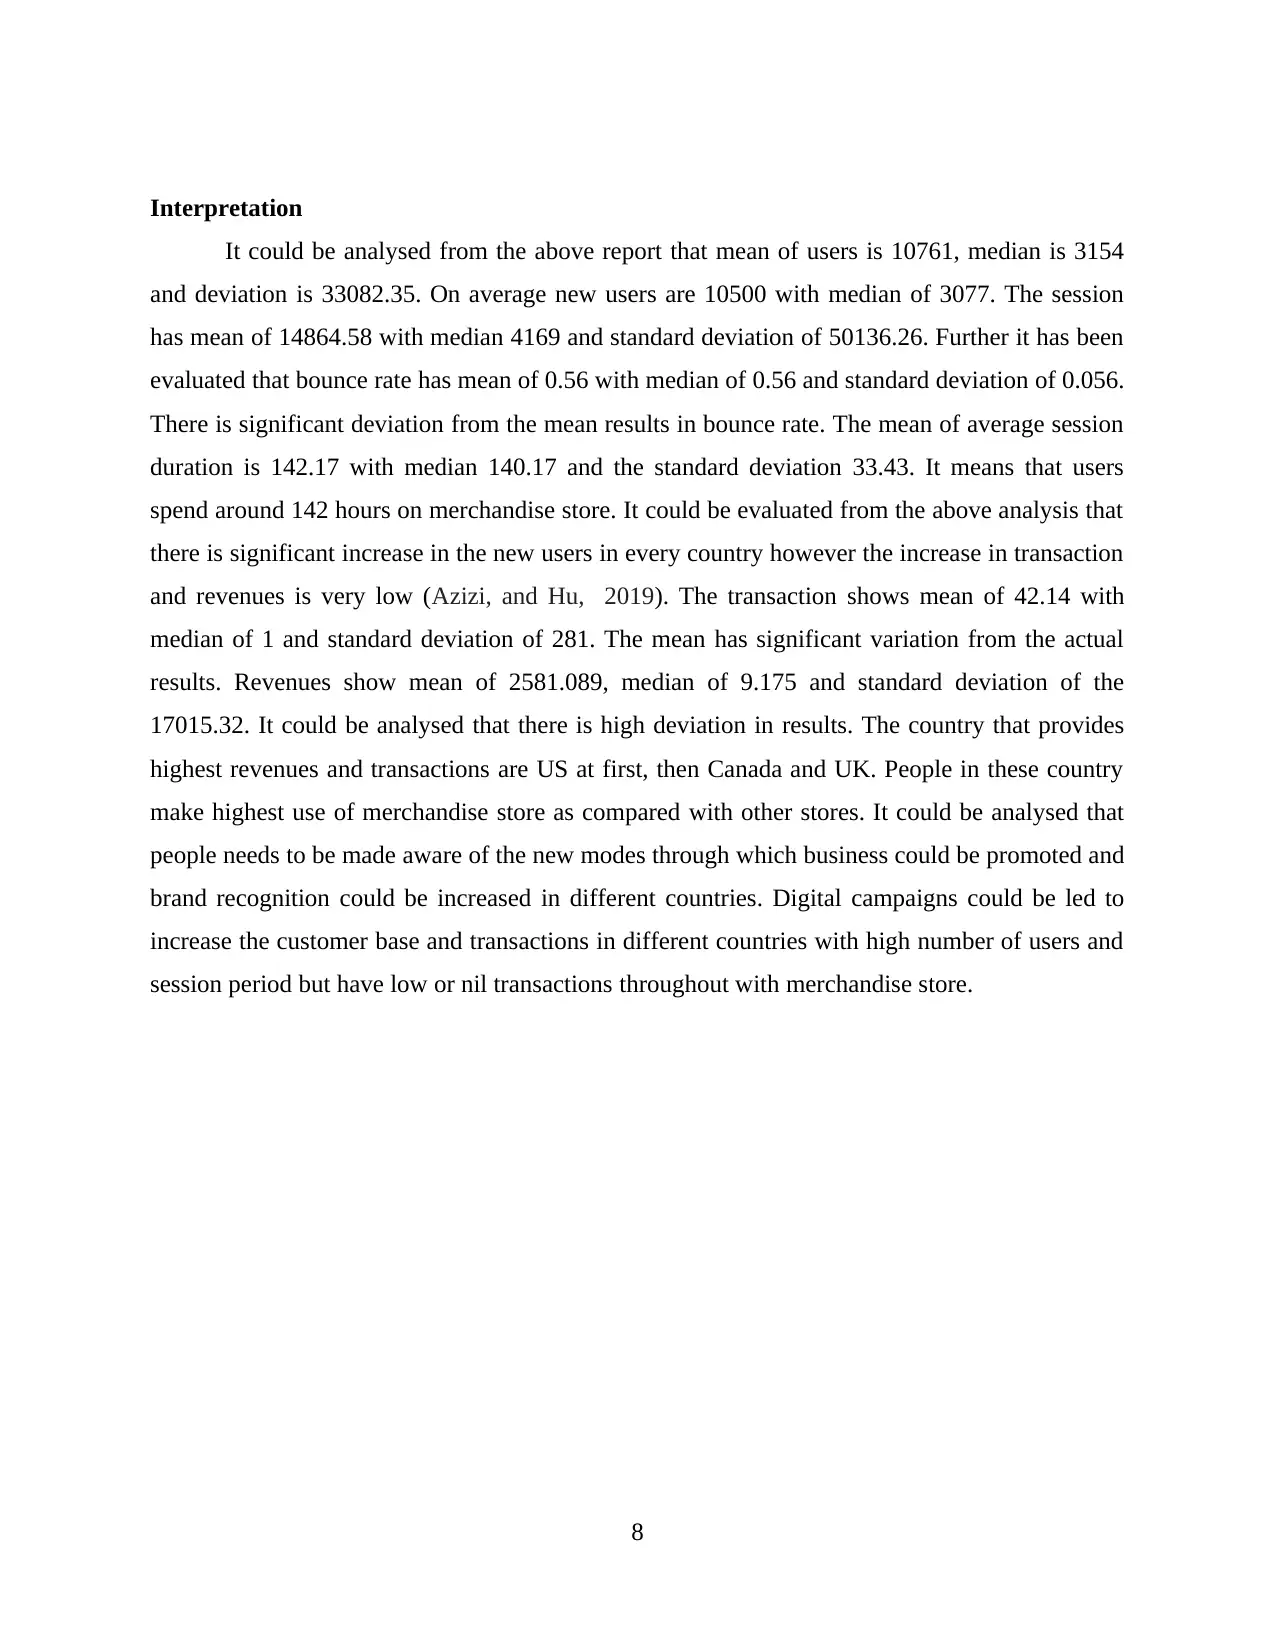
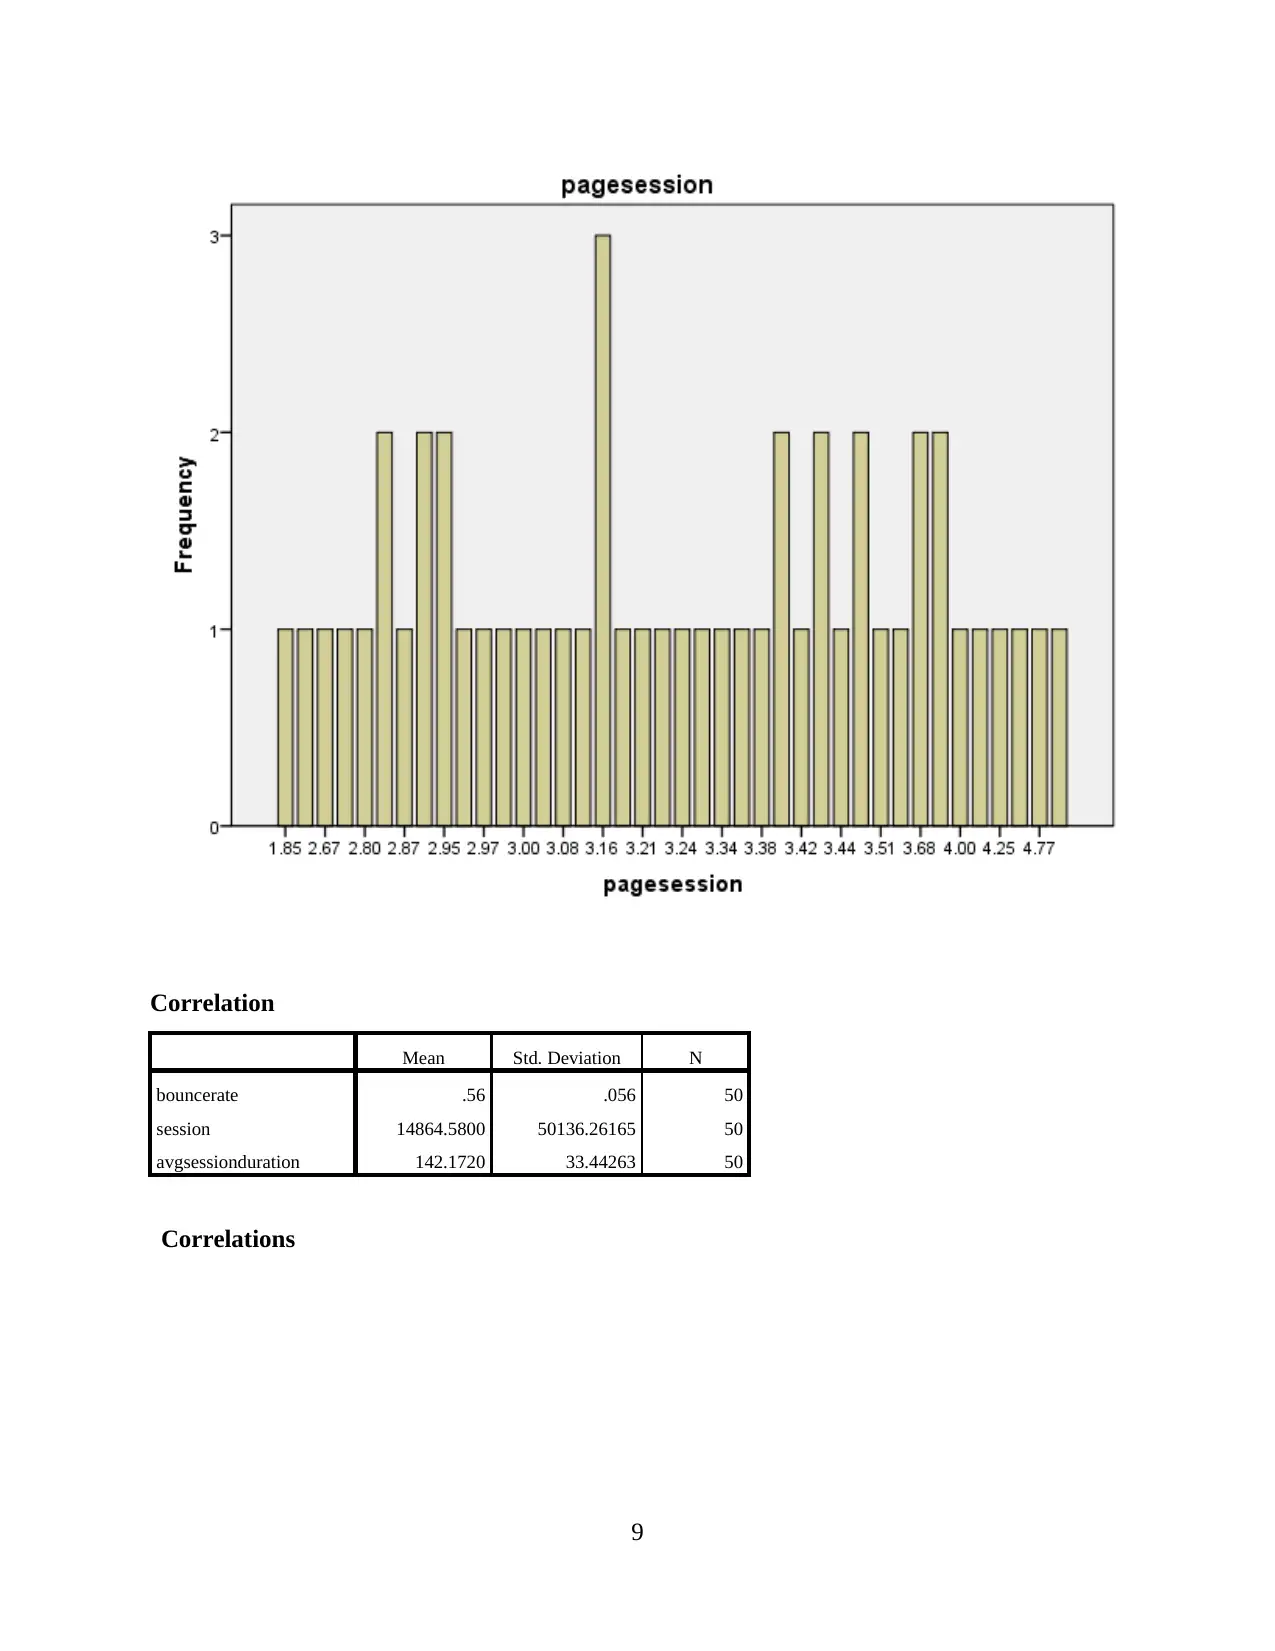
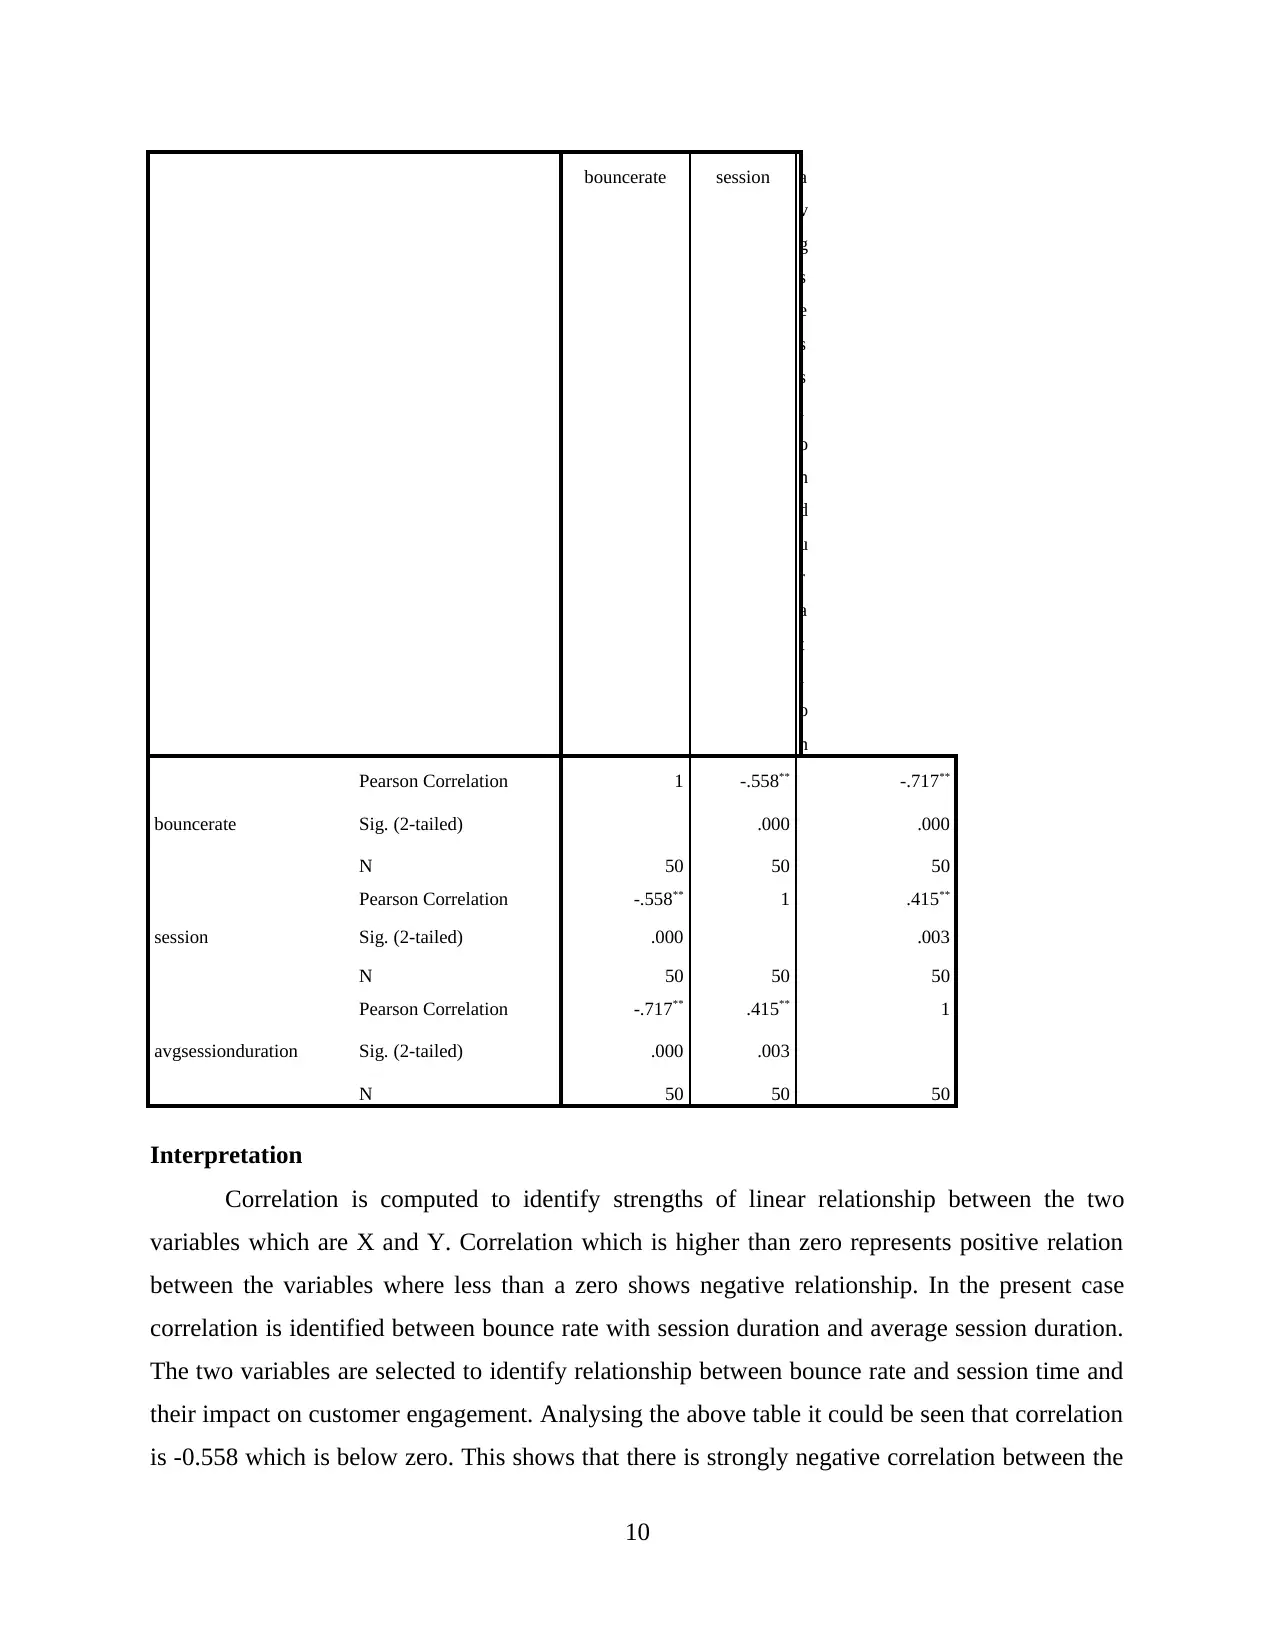
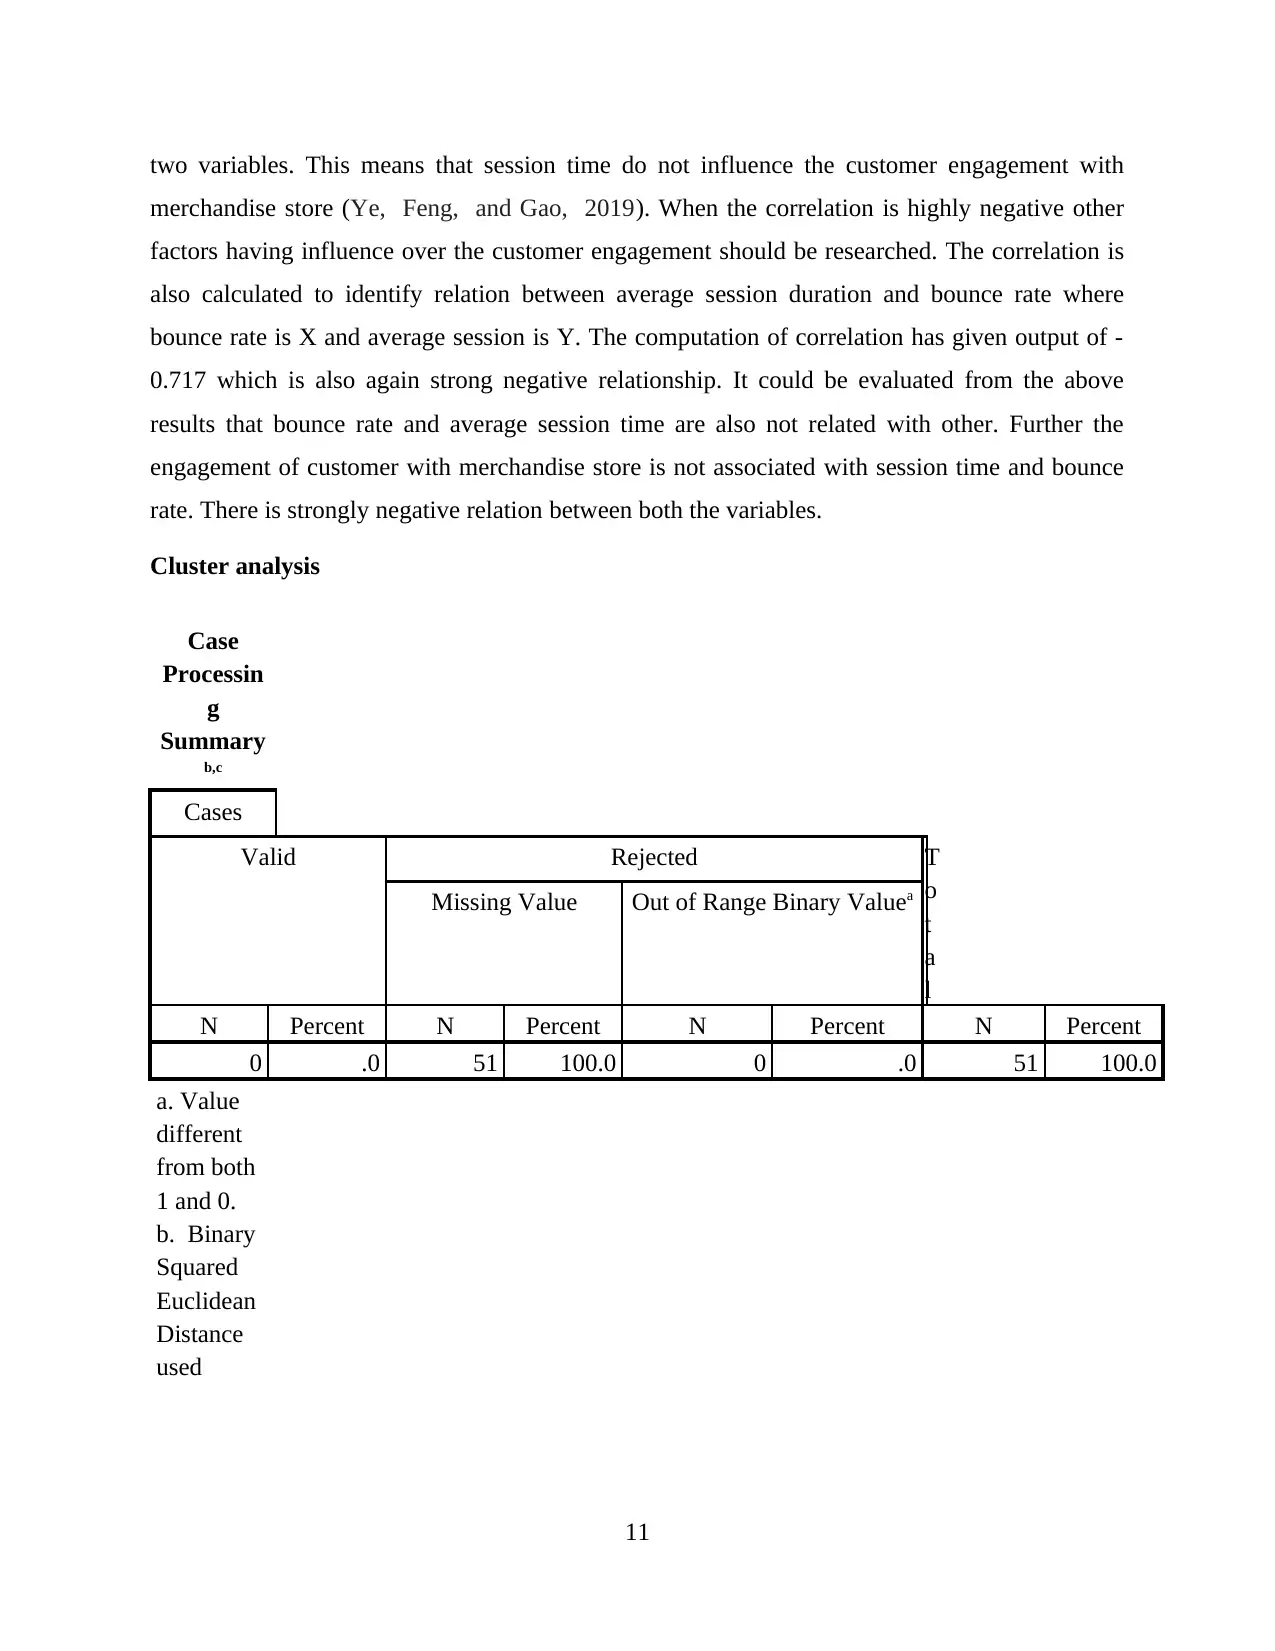
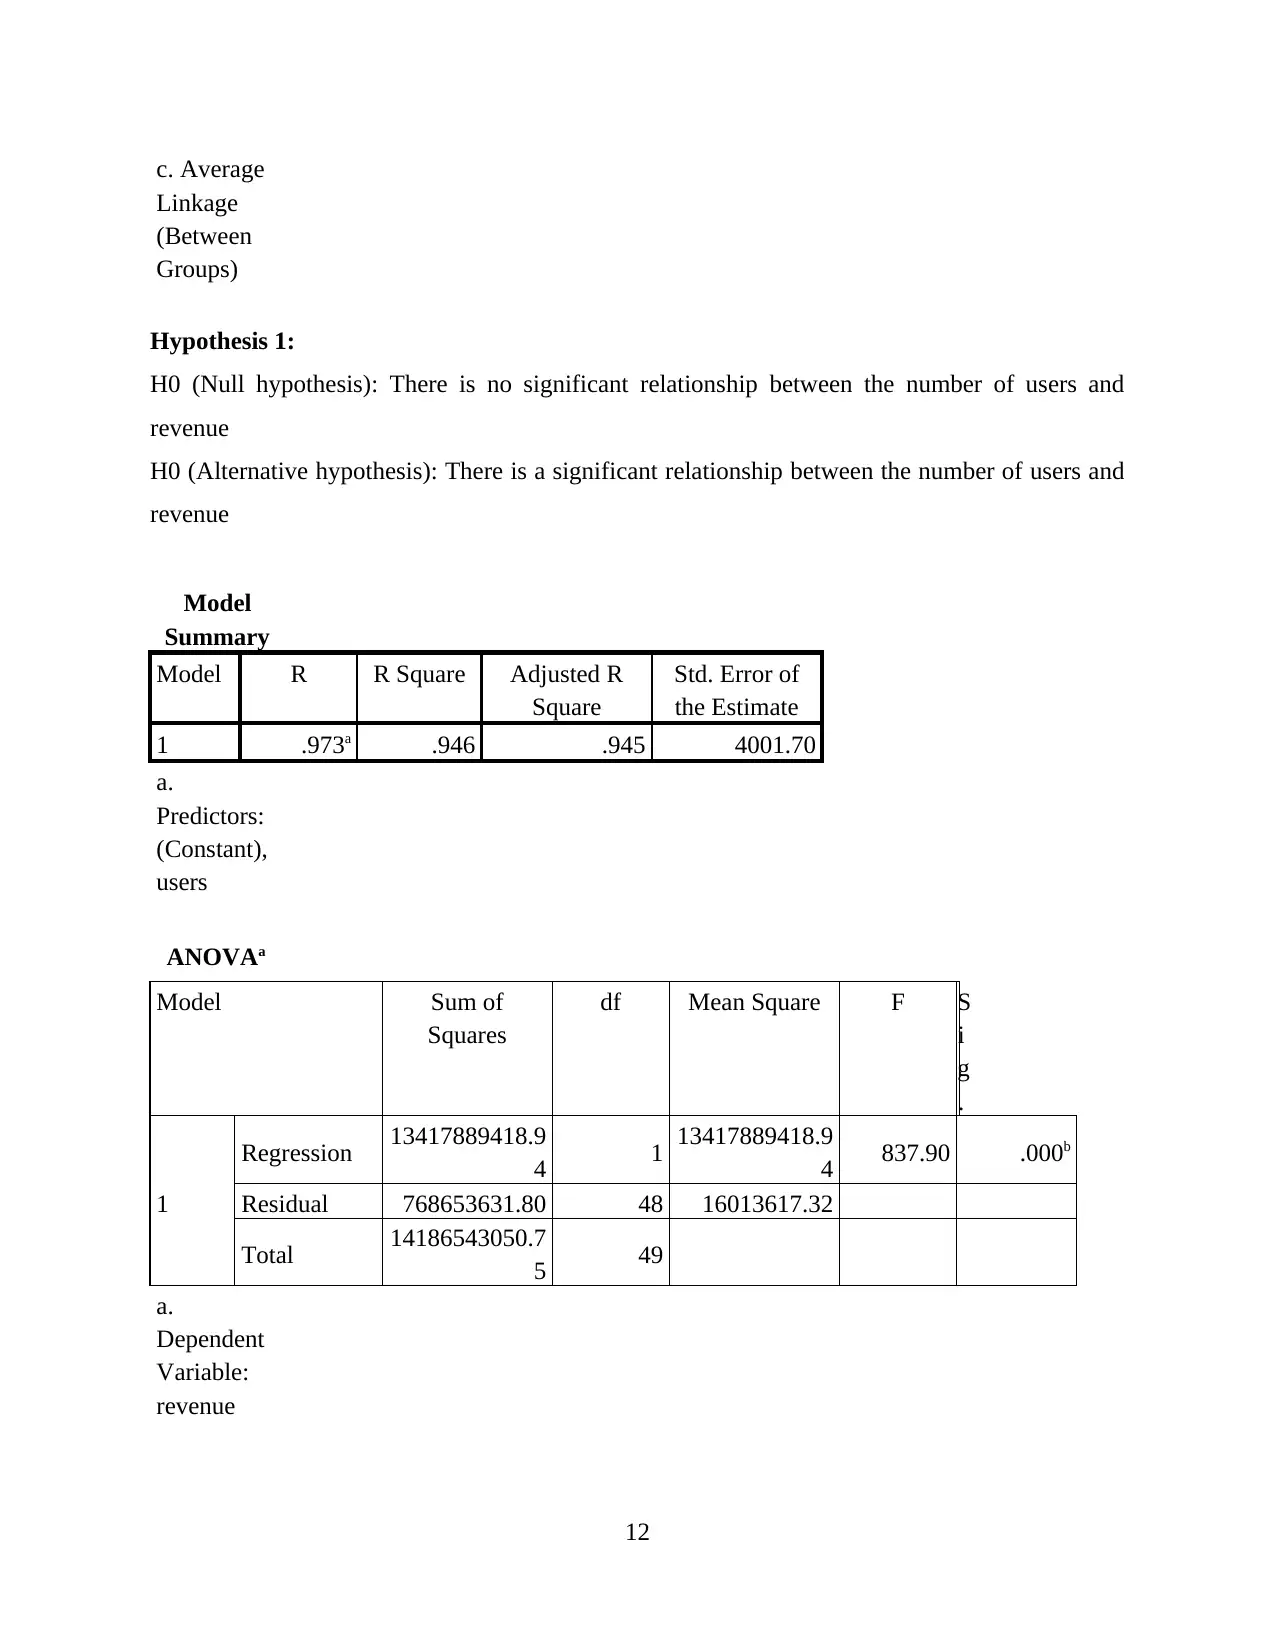
This report provides an analysis of customer engagement with the Google Merchandise Store, focusing on identifying high and low engagement levels across different countries. The study utilizes data from January 2020 to January 2021, incorporating metrics such as number of users, revenue, bounce rate, and transactions. Data analysis is performed using SPSS, including frequency analysis, regression analysis, and correlation analysis to determine relationships between variables like bounce rate and average session duration, as well as average session duration, transactions, and revenue. The findings reveal a negative correlation between bounce rate and average session duration, indicating that session duration does not depend on bounce rate. The report also indicates a significant correlation between average session duration and both transactions and revenue. Additionally, the analysis suggests a strong positive relationship between the number of users and revenue. The report concludes with recommendations to enhance customer engagement through digital marketing campaigns, particularly in countries with high user numbers but low transaction rates. The report also highlights the importance of increasing brand awareness in different countries to boost customer engagement and drive revenue growth.
Document Page
Digital marketing
1
tabler-icon-diamond-filled.svg

Paraphrase This Document

Need a fresh take? Get an instant paraphrase of this document with our AI Paraphraser
Document Page
Table of Contents
INTRODUCTION...........................................................................................................................3
CONCLUSION................................................................................................................................3
REFERENCES................................................................................................................................4
2
Document Page
INTRODUCTION
At higher levels the digital marketing means advertising that are delivered using digital
channels like search engines, social media, websites, email and the mobile apps. Digital
marketing refers to method through which the companies will endorse the goods, services and
the brands. It uses online and internet based digital technologies like the mobile phones, desktop
computers and the other tools (Steils, 2021). The importance of digital media has been increased
after the invent of different platforms used for social interactions. Digital marketing methods
have proper combination of the SEO, SEM, influencer marketing, content marketing, campaign
marketing, e-commerce and such other activities. The present report is based on Google
Merchandise Store who aims at identifying the customer engagement in different countries
around the world. It will analyse the level of engagement to identify which country is highly
engaged and which is least engaged. It will provide the company to analyse where digital
marketing efforts are to be made for increasing the customer engagement with Google
Merchandise Store.
Objectives
ï‚· To analyse the consumer engagement with website in different countries
In order to evaluate consumer engagement with website in different countries, the data is
taken which consists of many things. Here, dataset is obtained of Google Merchandise store of 1
year that of 1st Jan 2020 to Jan 2021 (Desai and Phadtare, 2017). In that data of each country and
number of users is specified in it. Also, revenue, bounce rate, transactions, etc. are included in it.
So, this will enable in analysing that in which country organisation is able to generate high
revenue. The data is analysed with help of SPSS in which various test are applied in it. With that
it will give insight on which country there are large number of customers. Along with it, in this
various test such as regression, correlation, etc. is applied to find out relationship between
variables. In addition, frequency of data will be interpreted. This will show in how many
countries consumer are engaged more and what is reason behind it. SPSS will also help in taking
proper decisions. Also, on basis of that decision can be easily taken. Thus, data analysis is
explained as below
Frequencies
3
Document Page
Regression analysis
In this regression the variable chosen is bounce rate and average session duration. This is
because it will help in finding out how average session duration depends on bounce rate. Besides
that, it will be easy to evaluate how session rate varies if there is change in bounce rate of
different countries (Massara, and Porcheddu, 2018) Hence, on basis of that consumer
engagement with website will be identified.
Descriptive Statistics
Mean Std. Deviation N
avgsessionduration 142.1720 33.44263 50
bouncerate .56 .056 50
Correlations
avgsessiondurati
on
bouncerate
Pearson Correlation avgsessionduration 1.000 -.717
bouncerate -.717 1.000
Sig. (1-tailed) avgsessionduration . .000
bouncerate .000 .
N avgsessionduration 50 50
bouncerate 50 50
Model Summary
Model R R Square Adjusted R
Square
Std. Error of the
Estimate
Change Statistics
R Square
Change
F Change df1
1 .717a .515 .505 23.53994 .515 50.898 1
Model Summary
Model Change Statistics
df2 Sig. F Change
1 48a .000
4
tabler-icon-diamond-filled.svg

Paraphrase This Document

Need a fresh take? Get an instant paraphrase of this document with our AI Paraphraser
Document Page
a. Predictors: (Constant), bouncerate
ANOVAa
Model Sum of Squares df Mean Square F Sig.
1
Regression 28203.880 1 28203.880 50.898 .000b
Residual 26598.187 48 554.129
Total 54802.067 49
a. Dependent Variable: avgsessionduration
b. Predictors: (Constant), bouncerate
Coefficientsa
Model Unstandardized Coefficients Standardized
Coefficients
t Sig.
B Std. Error Beta
1 (Constant) 382.852 33.900 11.294 .000
bouncerate -429.506 60.203 -.717 -7.134 .000
a. Dependent Variable: avgsessionduration
Interpretation- From above table it can be analysed that the significance value obtained is
P= .000 that is less than P= 0.05. Thus, it can be evaluated that there is no relationship between
bounce rate and average session duration. This means session duration does not depend on how
much bounce rate is. Hence, even when there is change in bounce rate it does impact on avg
session duration.
Correlation
Here, the variables that are taken is avg session duration, transaction and revenue. This is
because it will help in finding out correlation between them that whether transaction and revenue
depends avg session duration or not (Miao, 2020). This means that if avg duration is high then
transactions are also more or not. So, it highly impact on overall revenue.
Descriptive Statistics
Mean Std. Deviation N
avgsessionduration 142.1720 33.44263 50
5
Document Page
transaction 42.1400 281.73558 50
revenue 2581.0892 17015.32506 50
Correlations
avgsessiondurati
on
transaction revenue
avgsessionduration
Pearson Correlation 1 .409** .411**
Sig. (2-tailed) .003 .003
N 50 50 50
transaction
Pearson Correlation .409** 1 1.000**
Sig. (2-tailed) .003 .000
N 50 50 50
revenue
Pearson Correlation .411** 1.000** 1
Sig. (2-tailed) .003 .000
N 50 50 50
**. Correlation is significant at the 0.01 level (2-tailed).
Interpretation- It can be analysed from table that significance value obtained between avg
duration with transaction is .409 and with revenue is .411. So, it is less than P = 0.05. It means
that correlation is significant in it. However, it is found that correlation between transaction with
avg session duration is P = .409 and with revenue is 1. Here, both values are different but with
avg duration correlation is significant. Besides that, correlation of revenue with avg duration
is .411 that is less than P= 0.05.
Frequencies
Statistics
users newusers session bouncerate pagesession
N Valid 50 50 50 50 50
Missing 0 0 0 1 0
Mean 10671.9000 10500.1000 14864.5800 .56 3.3466
Median 3154.5000 3077.5000 4169.5000 .56 3.2350
Std. Deviation 33082.35462 32606.10345 50136.26165 0a .67016
Variance 1094442186.990 1063157982.173 2513644731.800 .056 .449
6
Document Page
Statistics
avgsessionduration transaction revenue ecommerceconversionra
te
N Valid 50 50 50 0
Missing 0 0 0 50
Mean 142.1720 42.1400 2581.0892
Median 140.1700 1.0000 9.1750
Std. Deviation 33.44263 281.73558 17015.32506
Variance 1118.410 79374.939 289521286.750
7
tabler-icon-diamond-filled.svg

Paraphrase This Document

Need a fresh take? Get an instant paraphrase of this document with our AI Paraphraser
Document Page
Interpretation
It could be analysed from the above report that mean of users is 10761, median is 3154
and deviation is 33082.35. On average new users are 10500 with median of 3077. The session
has mean of 14864.58 with median 4169 and standard deviation of 50136.26. Further it has been
evaluated that bounce rate has mean of 0.56 with median of 0.56 and standard deviation of 0.056.
There is significant deviation from the mean results in bounce rate. The mean of average session
duration is 142.17 with median 140.17 and the standard deviation 33.43. It means that users
spend around 142 hours on merchandise store. It could be evaluated from the above analysis that
there is significant increase in the new users in every country however the increase in transaction
and revenues is very low (Azizi, and Hu, 2019). The transaction shows mean of 42.14 with
median of 1 and standard deviation of 281. The mean has significant variation from the actual
results. Revenues show mean of 2581.089, median of 9.175 and standard deviation of the
17015.32. It could be analysed that there is high deviation in results. The country that provides
highest revenues and transactions are US at first, then Canada and UK. People in these country
make highest use of merchandise store as compared with other stores. It could be analysed that
people needs to be made aware of the new modes through which business could be promoted and
brand recognition could be increased in different countries. Digital campaigns could be led to
increase the customer base and transactions in different countries with high number of users and
session period but have low or nil transactions throughout with merchandise store.
8
Document Page
Correlation
Mean Std. Deviation N
bouncerate .56 .056 50
session 14864.5800 50136.26165 50
avgsessionduration 142.1720 33.44263 50
Correlations
9
Document Page
bouncerate session a
v
g
s
e
s
s
i
o
n
d
u
r
a
t
i
o
n
bouncerate
Pearson Correlation 1 -.558** -.717**
Sig. (2-tailed) .000 .000
N 50 50 50
session
Pearson Correlation -.558** 1 .415**
Sig. (2-tailed) .000 .003
N 50 50 50
avgsessionduration
Pearson Correlation -.717** .415** 1
Sig. (2-tailed) .000 .003
N 50 50 50
Interpretation
Correlation is computed to identify strengths of linear relationship between the two
variables which are X and Y. Correlation which is higher than zero represents positive relation
between the variables where less than a zero shows negative relationship. In the present case
correlation is identified between bounce rate with session duration and average session duration.
The two variables are selected to identify relationship between bounce rate and session time and
their impact on customer engagement. Analysing the above table it could be seen that correlation
is -0.558 which is below zero. This shows that there is strongly negative correlation between the
10
tabler-icon-diamond-filled.svg

Paraphrase This Document

Need a fresh take? Get an instant paraphrase of this document with our AI Paraphraser
Document Page
two variables. This means that session time do not influence the customer engagement with
merchandise store (Ye, Feng, and Gao, 2019). When the correlation is highly negative other
factors having influence over the customer engagement should be researched. The correlation is
also calculated to identify relation between average session duration and bounce rate where
bounce rate is X and average session is Y. The computation of correlation has given output of -
0.717 which is also again strong negative relationship. It could be evaluated from the above
results that bounce rate and average session time are also not related with other. Further the
engagement of customer with merchandise store is not associated with session time and bounce
rate. There is strongly negative relation between both the variables.
Cluster analysis
Case
Processin
g
Summary
b,c
Cases
Valid Rejected T
o
t
a
l
Missing Value Out of Range Binary Valuea
N Percent N Percent N Percent N Percent
0 .0 51 100.0 0 .0 51 100.0
a. Value
different
from both
1 and 0.
b. Binary
Squared
Euclidean
Distance
used
11
Document Page
c. Average
Linkage
(Between
Groups)
Hypothesis 1:
H0 (Null hypothesis): There is no significant relationship between the number of users and
revenue
H0 (Alternative hypothesis): There is a significant relationship between the number of users and
revenue
Model
Summary
Model R R Square Adjusted R
Square
Std. Error of
the Estimate
1 .973a .946 .945 4001.70
a.
Predictors:
(Constant),
users
ANOVAa
Model Sum of
Squares
df Mean Square F S
i
g
.
1
Regression 13417889418.9
4 1 13417889418.9
4 837.90 .000b
Residual 768653631.80 48 16013617.32
Total 14186543050.7
5 49
a.
Dependent
Variable:
revenue
12
chevron_up_icon
1 out of 20
circle_padding
hide_on_mobile
zoom_out_icon
[object Object]