Dissertation: Customer Loyalty Programs in Beauty & Health Retailing
VerifiedAdded on 2020/07/22
|136
|49447
|35
Thesis and Dissertation
AI Summary
This dissertation investigates the relationship between customer loyalty programs and store loyalty within the beauty and health retailing industry in Hong Kong. The research explores the competitive landscape, cultural context, and distribution channels specific to the region, considering the influence of factors like price sensitivity and communication strategies. The study examines the historical development and attributes of customer loyalty programs, as well as their impact on store loyalty, and incorporates visual merchandising as a key element. The research employs a survey methodology to gather data on demographics, store loyalty, customer loyalty programs, and related variables, followed by data analysis using descriptive statistics, frequency tables, and mediation and moderation analyses. The findings, recommendations, limitations, and directions for future research are provided in the conclusion. The research aims to provide insights for practitioners and managers in the beauty and health retail sector, ultimately benefiting customers through enhanced fulfillment of expectations.
DISSERTATION
(Measuring impact of customer loyalty programs & Mediating factors on
store loyalty: The beauty and health retailing stores in Hong Kong)
(Measuring impact of customer loyalty programs & Mediating factors on
store loyalty: The beauty and health retailing stores in Hong Kong)
Paraphrase This Document
Need a fresh take? Get an instant paraphrase of this document with our AI Paraphraser
Table of Contents
INTRODUCTION...........................................................................................................................1
1 1.1 Background...................................................................................................................1
1.1.1 Hong Kong Special Administrative Region.........................................................2
1.1.2 Culture in Hong Kong..........................................................................................3
1.1.3 Context of Beauty & Health Care Products.........................................................4
1.1.4 Distribution Channels in Hong Kong..................................................................5
1.2 Justification of Proposed Research..................................................................................6
1.2.1 Importance of Customer Loyalty Programs in Beauty & Health Care Products
retailing context in Hong Kong.....................................................................................7
1.2.2 Price Sensitivity in Chinese Society....................................................................8
1.3 Aim & Objectives............................................................................................................9
1.4 Research Questions.......................................................................................................12
1.5 Intended Research Methodology...................................................................................14
1.6 Outline of Dissertation..................................................................................................17
2.0 LITERATURE REVIEW........................................................................................................18
2.1 STORE LOYALTY.......................................................................................................18
2.1.1 Behavioural Action............................................................................................22
2.1.2 Word-of-mouth .................................................................................................23
2.1.3 Commitment ......................................................................................................25
2.2 CUSTOMER LOYALTY PROGRAMMES................................................................27
2.2.1 General History..................................................................................................28
2.2.2 Hard Attributes ..................................................................................................30
2.2.3 Soft Attributes ...................................................................................................32
2.2.4 Impacts of Customer Loyalty Programmes on Store Loyalty............................33
2.3 COMMUNICATIONS WITH CUSTOMERS..............................................................37
2.3.1 Illustration of Communication with Customers.................................................37
2.3.2 Association with Store Loyalty..........................................................................38
2.4 VISUAL MERCHANDISING.....................................................................................39
2.4.1 Content of Visual Merchandising......................................................................39
2.4.2 Connection to Communication with Customers................................................40
2.5 Development of Hypotheses..........................................................................................41
2.6 Development of Research Model..................................................................................43
2.6.1 Review of the Parental Frameworks..................................................................44
2.6.2 Proposed Model in Current Study......................................................................45
CHAPTER 3: RESEARCH METHODOLOGY...........................................................................48
3.1 Introduction...................................................................................................................48
3.2 Research methodology..................................................................................................49
3.3 Research design.............................................................................................................50
3.3.1 Type of research design.....................................................................................51
3.3.2 Research methods..............................................................................................52
3.3.3 Survey research..................................................................................................52
3.3.4 Sampling............................................................................................................53
3.3.5 Questionnaire.....................................................................................................54
3.3.6 Product Categories.............................................................................................54
3.3.7 Research Framework..........................................................................................54
3.4 Data Collection..............................................................................................................55
3.4.1 Demographic Information .................................................................................57
3.4.2 Store Loyalty......................................................................................................59
3.4.3 Customer Loyalty Program................................................................................61
3.4.4 Price Sensitivity.................................................................................................62
3.4.5 Communication with Customer.........................................................................63
3.4.6 Visual Merchandisin..........................................................................................63
3.4.7 Price Image........................................................................................................64
3.4.8 Location.............................................................................................................64
3.5 Measures........................................................................................................................65
3.7 Validity..........................................................................................................................66
3.8 Ethical considerations....................................................................................................67
3.9 Significance and Limitation of research design............................................................67
3.10 Conclusion...................................................................................................................67
CHAPTER 4: DATA ANALYSIS................................................................................................69
4.1 Introduction...................................................................................................................69
⊘ This is a preview!⊘
Do you want full access?
Subscribe today to unlock all pages.
Trusted by 1+ million students worldwide
4.2 Descriptive analyses......................................................................................................69
4.3 Frequencies tables.........................................................................................................72
4.4 Cronbach's alpha test.....................................................................................................86
4.5 Chi square test and cross tabulation..............................................................................87
4.6 Mediation and moderation analayses through process macro.......................................90
4.7 Summary of hypotheses results.....................................................................................93
CHAPTER 5: CONCLUSION AND RECOMMENDATIONS ..................................................95
5.1 Introduction...................................................................................................................95
5.2 Findings.........................................................................................................................95
5.3 Decision stage................................................................................................................98
5.4 Summary of findings...................................................................................................102
5.5 Recommendations.......................................................................................................104
5.6 Limitation and direction for future research................................................................104
5.7 Summary and conclusion............................................................................................105
REFERENCES............................................................................................................................106
APPENDIX..................................................................................................................................125
Paraphrase This Document
Need a fresh take? Get an instant paraphrase of this document with our AI Paraphraser
INTRODUCTION
In the current research work, the connection between the customer loyalty program and
the store loyalty in the local beauty and health retailing industry was investigated so as to provide
the hints for the practitioners in the field of having a better understanding of their target groups
as well as the effectiveness of the customer loyalty program delivered. The related study also
provided the recommendation for the managers of the related industry in the conducting of the
loyalty program. Furthermore, the customers could be benefited from the related study by the
enhanced fulfilment to their expectation. It was hoped that the current study could provide
guidance for the owners of the retail industry of beauty and healthcare products in facing the
complicity and challenge of the sector.
Therefore, for the sake of having an improved illustration to the related content, the
current chapter was divided into six sections, namely, Background, Justification of Proposed
Research, Aim & Objectives, Research Questions, Intended Research Methodology, and Outline
of , so as to highlight the intended approach in conducting the current study along with the aim
and objectives in performing the related research investigation.
11.1 Background
Beauty and health care products were special in locals because of the intensified
competition, while a wide range of parties was involved in the sales channels. Most of them
dedicated for the function of marketing and sales (Australian Trade Commission, 2014), while
the lack of local manufactures heated the competition due to the similarity of functions
(Australian Trade Commission, 2014). To stand out, all distributors encouraged the sales with a
wide range of customer retaining campaign (Oliaee, et al., 2016), while the dynamics of the
market was unpredictable due to the interference of the resultant effects. Consequently, because
of the complexity of the background related to the local beauty and health care products retailing
industry, the related illustration was divided into four aspects, while they were presented in the
following four subsections, namely, Hong Kong Special Administrative Region, Culture in Hong
Kong, Context of Beauty and Health Care Products and Distribution Channels in Hong Kong
respectively.
1.1.1 Hong Kong Special Administrative Region
Hong Kong was in Southern China and the New Territories of Hong Kong was
geographically linked to the Mainland of China (Floyd, 1998). Hong Kong was a part of the
Qing China before the mid-19th century (Floyd, 1998). Great Britain occupied Hong Kong Island
and Kowloon Peninsular of Hong Kong through the Treaty of Nanking in the First Opium War
and the Second Convention of Peking respectively (Floyd, 1998). Hong Kong was officially
British colony when Qing China agreed to lease New Territories of Hong Kong to Great Britain
in 1898 for 99 years (Floyd, 1998).
Great Britain failed to defend Hong Kong from Japanese invasion in the second world
war and she regained the sovereignty in 1945 (Floyd, 1998). In 1984, Great Britain agreed to
return Hong Kong to the People's Republic of China under the principle of “One Country, Two
Systems” in 1997 (Floyd, 1998). Hong Kong would be transformed as a Special Administrative
Region of the People’s Republic of China while Hong Kong remained to be a capitalist
economy, a common-law jurisdiction and highly independent from Mainland China for 50 years
(Floyd, 1998). To be specific, the citizens of Hong Kong could remain their living styles and the
judiciary, legislative and executive systems remained independent from the People’s Republic of
China (Floyd, 1998).
Hong Kong, with a deep natural harbor that flourished cargo shipments, became a leading
financial center. There were 7.24 million residents living in less than 1100 sq km (Hong Kong
Fact Sheet, 2015). Therefore, Hong Kong was ranked the 4th densely populated area on earth.
Chinese was the majority ethnic group in Hong Kong. For every 1165 female, there was 1000
male (Hong Kong Fact Sheet, 2015). Therefore, Hong Kong was an attractive location for
foreign branded beauty products as the population skewed to female (Australian Trade
Commission, 2014). Meanwhile, the median age of Hong Kong rose to 42.8 in 2014 which made
it an attractive location for foreign branded health care products as the demand for health care
products rose by an increase of age (Australian Trade Commission, 2014; Hong Kong Fact
Sheet, 2015). As a result, this study targeted to inform marketers with updated insight
information on beauty and health care products retailing in Hong Kong market.
⊘ This is a preview!⊘
Do you want full access?
Subscribe today to unlock all pages.
Trusted by 1+ million students worldwide
1.1.2 Culture in Hong Kong
In Kroeber and Parsons (1958, p.583), the word culture was described as “……
Transmitted and created content and patterns of values, ideas, and other symbolic-meaningful
systems as factors in the shaping of human behavior and the artifacts produced through
behaviour.” Frey (2005, p.1) described the effect of culture values as “Learned, relatively
enduring, emotionally charged, epistemologically grounded and represented moral
conceptualizations that assist us in making judgments and in preparing us to act. In other words,
the priorities we set and the choices we make are significantly based on the (cultural) values we
hold.”
Traditional Chinese culture/Confucianism dominated Hong Kong before mid-19th century
till the invasion of Great Britain (Siu, et al., 2003). Chinese values emphasised the importance of
family unity over individualism (Abelmann, 1997). Binding a tight family required all members
to be polite and to show respect (Abelmann, 1997). Therefore, Chinese values emphasised on
personal courtesy and “face-giving” (Siu, et al., 2003). Although, Hong Kong had fallen as a
colony of Great Britain and it was said that western believes of individualism impacted the living
style of the citizen in Hong Kong (De Mooij, 2005); apart from Low Uncertainty Avoidance,
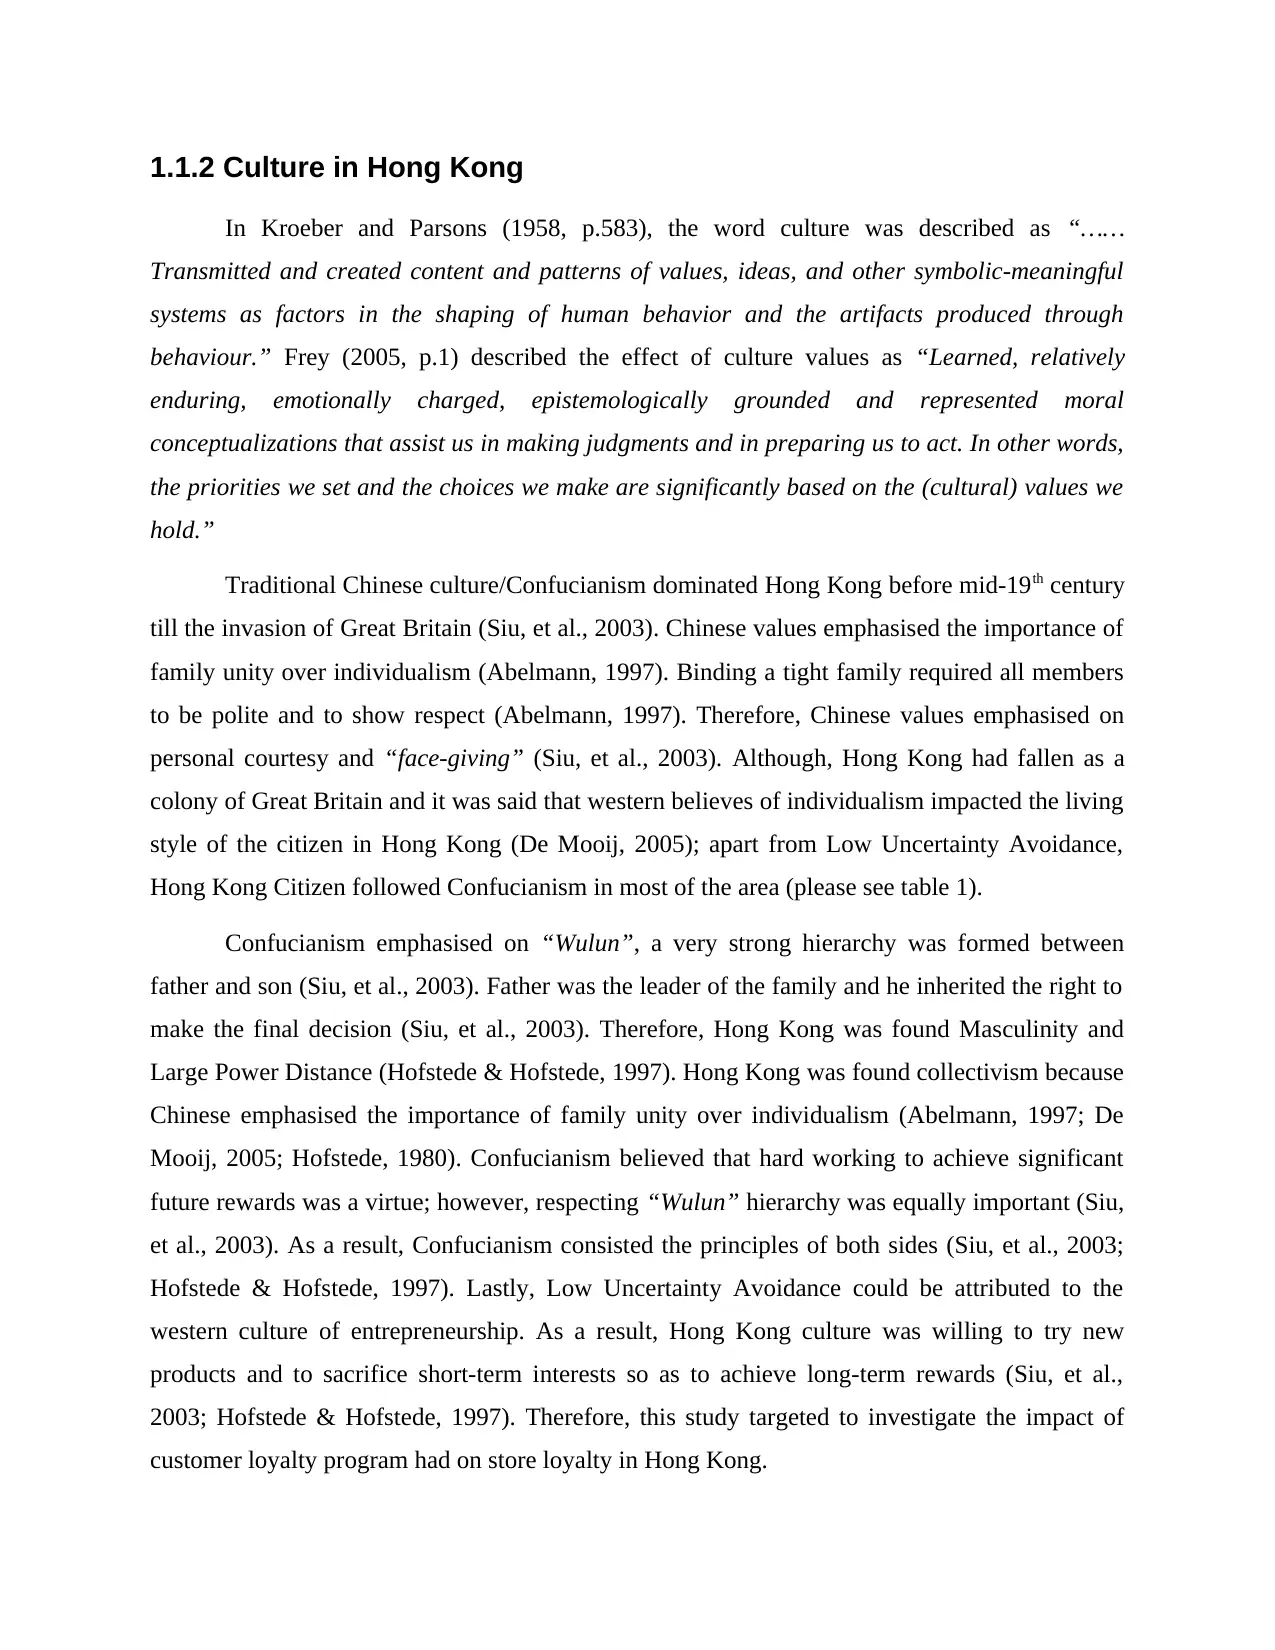
Hong Kong Citizen followed Confucianism in most of the area (please see table 1).
Confucianism emphasised on “Wulun”, a very strong hierarchy was formed between
father and son (Siu, et al., 2003). Father was the leader of the family and he inherited the right to
make the final decision (Siu, et al., 2003). Therefore, Hong Kong was found Masculinity and
Large Power Distance (Hofstede & Hofstede, 1997). Hong Kong was found collectivism because
Chinese emphasised the importance of family unity over individualism (Abelmann, 1997; De
Mooij, 2005; Hofstede, 1980). Confucianism believed that hard working to achieve significant
future rewards was a virtue; however, respecting “Wulun” hierarchy was equally important (Siu,
et al., 2003). As a result, Confucianism consisted the principles of both sides (Siu, et al., 2003;
Hofstede & Hofstede, 1997). Lastly, Low Uncertainty Avoidance could be attributed to the
western culture of entrepreneurship. As a result, Hong Kong culture was willing to try new
products and to sacrifice short-term interests so as to achieve long-term rewards (Siu, et al.,
2003; Hofstede & Hofstede, 1997). Therefore, this study targeted to investigate the impact of
customer loyalty program had on store loyalty in Hong Kong.
In Kroeber and Parsons (1958, p.583), the word culture was described as “……
Transmitted and created content and patterns of values, ideas, and other symbolic-meaningful
systems as factors in the shaping of human behavior and the artifacts produced through
behaviour.” Frey (2005, p.1) described the effect of culture values as “Learned, relatively
enduring, emotionally charged, epistemologically grounded and represented moral
conceptualizations that assist us in making judgments and in preparing us to act. In other words,
the priorities we set and the choices we make are significantly based on the (cultural) values we
hold.”
Traditional Chinese culture/Confucianism dominated Hong Kong before mid-19th century
till the invasion of Great Britain (Siu, et al., 2003). Chinese values emphasised the importance of
family unity over individualism (Abelmann, 1997). Binding a tight family required all members
to be polite and to show respect (Abelmann, 1997). Therefore, Chinese values emphasised on
personal courtesy and “face-giving” (Siu, et al., 2003). Although, Hong Kong had fallen as a
colony of Great Britain and it was said that western believes of individualism impacted the living
style of the citizen in Hong Kong (De Mooij, 2005); apart from Low Uncertainty Avoidance,
Hong Kong Citizen followed Confucianism in most of the area (please see table 1).
Confucianism emphasised on “Wulun”, a very strong hierarchy was formed between
father and son (Siu, et al., 2003). Father was the leader of the family and he inherited the right to
make the final decision (Siu, et al., 2003). Therefore, Hong Kong was found Masculinity and
Large Power Distance (Hofstede & Hofstede, 1997). Hong Kong was found collectivism because
Chinese emphasised the importance of family unity over individualism (Abelmann, 1997; De
Mooij, 2005; Hofstede, 1980). Confucianism believed that hard working to achieve significant
future rewards was a virtue; however, respecting “Wulun” hierarchy was equally important (Siu,
et al., 2003). As a result, Confucianism consisted the principles of both sides (Siu, et al., 2003;
Hofstede & Hofstede, 1997). Lastly, Low Uncertainty Avoidance could be attributed to the
western culture of entrepreneurship. As a result, Hong Kong culture was willing to try new
products and to sacrifice short-term interests so as to achieve long-term rewards (Siu, et al.,
2003; Hofstede & Hofstede, 1997). Therefore, this study targeted to investigate the impact of
customer loyalty program had on store loyalty in Hong Kong.
Paraphrase This Document
Need a fresh take? Get an instant paraphrase of this document with our AI Paraphraser
Table 1: Culture in Hong Kong (Hofstede, 198; Hofstede & Hofstede, 1997)
1.1.3 Context of Beauty & Health Care Products
After the reviewing of Hong Kong and Culture in Hong Kong, the subjects of study,
namely, beauty and health products were defined so as to give a common ground for the
discussion. Beauty products shared the similar meaning with cosmetics, skin-care and toiletry
products, while it was defined as the externally applied preparations for skin, nails, hair, lips, and
eyes, etc. so as to change or modify the appearance and personal hygiene in enhancing the
overall beauty (The Columbia Encyclopaedia, 2013; Barel, et al., 2001). Generally, beauty
related products were targeting the female segment majorly as using beauty products were
viewed as feminine (Parry, 2005; Wood, 2010). On the other hand, health care products were
defined as certain remedies with the objectives of treating or preventing the illness so as to
maintain a good condition of overall health instead of using the prescribed treatments or
intensive care (Answers Cloud, 2016). In general, minerals, vitamins, herbal remedies,
traditional medicine, probiotics, homoeopathic medicine, and amino acids, and so on, were
commonly considered as health products (Answers Cloud, 2016).
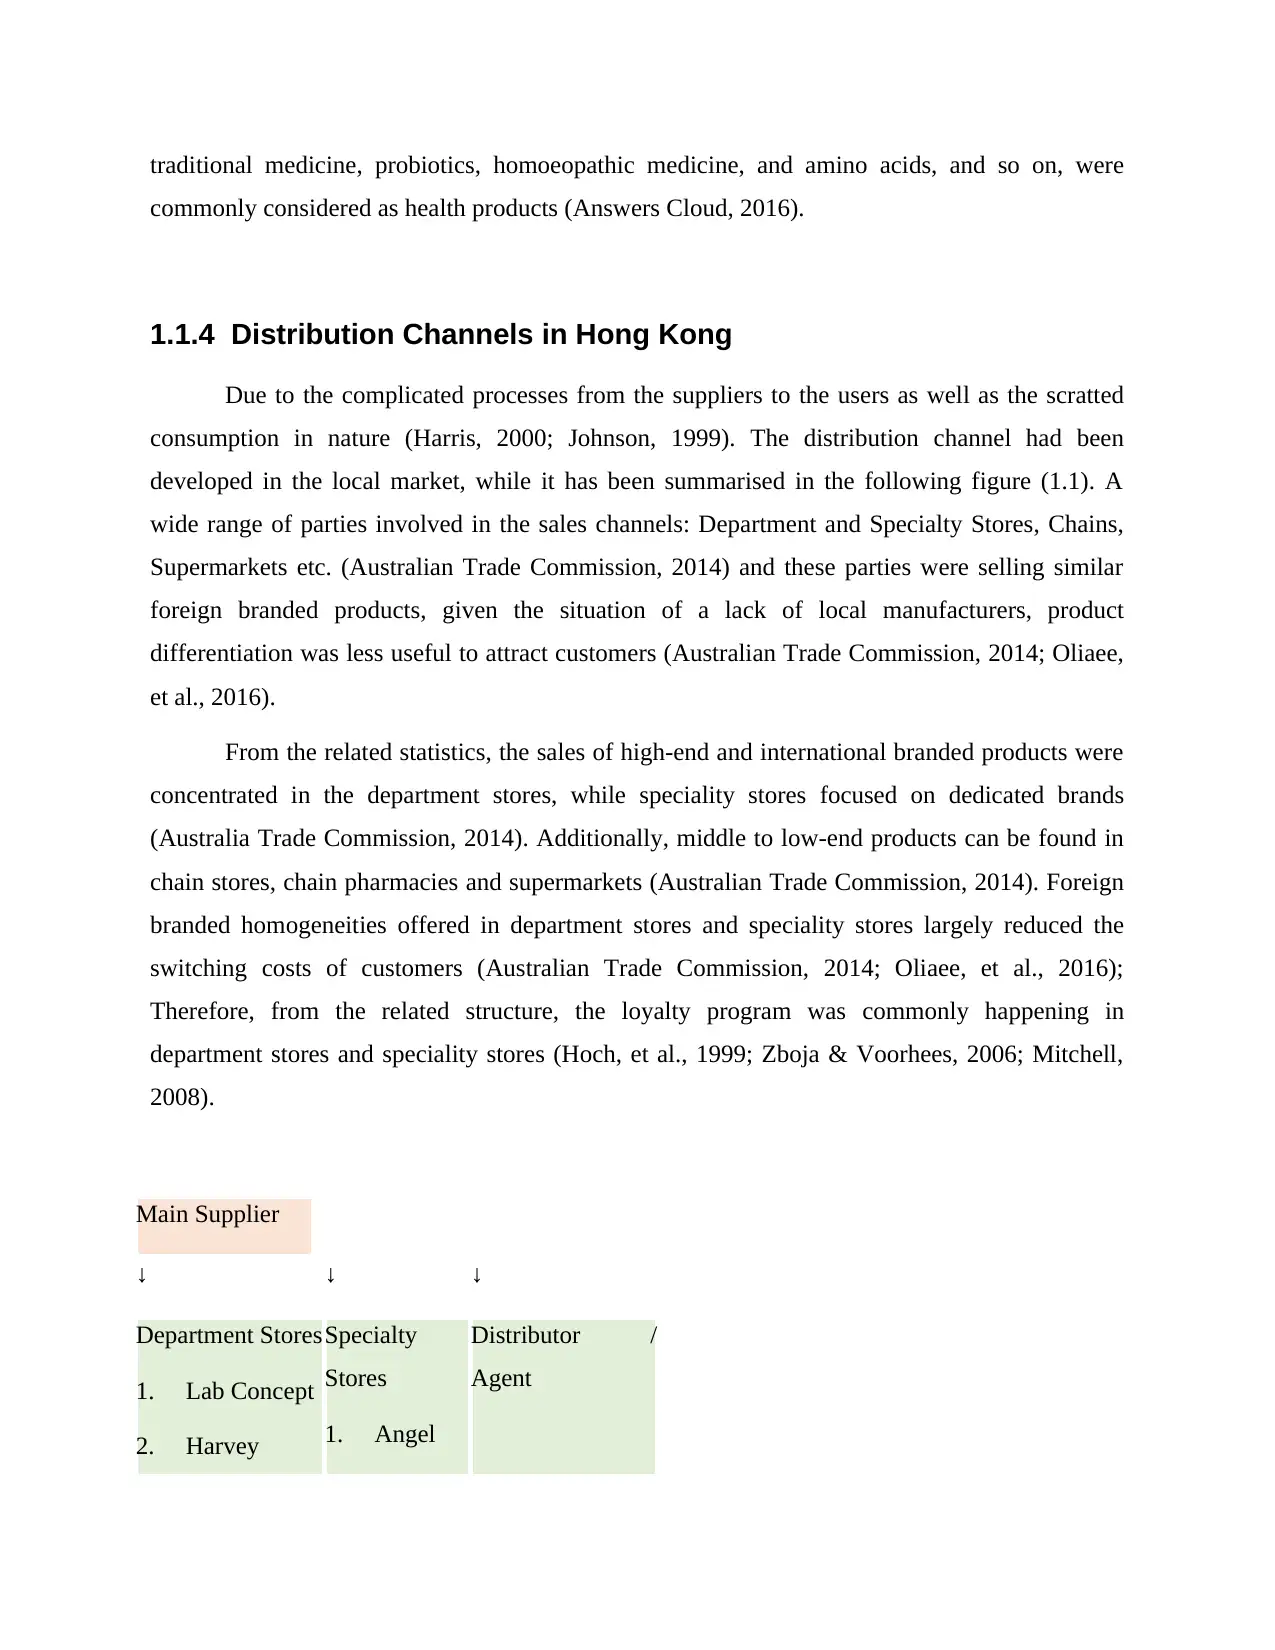
1.1.4 Distribution Channels in Hong Kong
Due to the complicated processes from the suppliers to the users as well as the scratted
consumption in nature (Harris, 2000; Johnson, 1999). The distribution channel had been
developed in the local market, while it has been summarised in the following figure (1.1). A
wide range of parties involved in the sales channels: Department and Specialty Stores, Chains,
Supermarkets etc. (Australian Trade Commission, 2014) and these parties were selling similar
foreign branded products, given the situation of a lack of local manufacturers, product
differentiation was less useful to attract customers (Australian Trade Commission, 2014; Oliaee,
et al., 2016).
From the related statistics, the sales of high-end and international branded products were
concentrated in the department stores, while speciality stores focused on dedicated brands
(Australia Trade Commission, 2014). Additionally, middle to low-end products can be found in
chain stores, chain pharmacies and supermarkets (Australian Trade Commission, 2014). Foreign
branded homogeneities offered in department stores and speciality stores largely reduced the
switching costs of customers (Australian Trade Commission, 2014; Oliaee, et al., 2016);
Therefore, from the related structure, the loyalty program was commonly happening in
department stores and speciality stores (Hoch, et al., 1999; Zboja & Voorhees, 2006; Mitchell,
2008).
Main Supplier
↓ ↓ ↓
Department Stores
1. Lab Concept
2. Harvey
Specialty
Stores
1. Angel
Distributor /
Agent
commonly considered as health products (Answers Cloud, 2016).
1.1.4 Distribution Channels in Hong Kong
Due to the complicated processes from the suppliers to the users as well as the scratted
consumption in nature (Harris, 2000; Johnson, 1999). The distribution channel had been
developed in the local market, while it has been summarised in the following figure (1.1). A
wide range of parties involved in the sales channels: Department and Specialty Stores, Chains,
Supermarkets etc. (Australian Trade Commission, 2014) and these parties were selling similar
foreign branded products, given the situation of a lack of local manufacturers, product
differentiation was less useful to attract customers (Australian Trade Commission, 2014; Oliaee,
et al., 2016).
From the related statistics, the sales of high-end and international branded products were
concentrated in the department stores, while speciality stores focused on dedicated brands
(Australia Trade Commission, 2014). Additionally, middle to low-end products can be found in
chain stores, chain pharmacies and supermarkets (Australian Trade Commission, 2014). Foreign
branded homogeneities offered in department stores and speciality stores largely reduced the
switching costs of customers (Australian Trade Commission, 2014; Oliaee, et al., 2016);
Therefore, from the related structure, the loyalty program was commonly happening in
department stores and speciality stores (Hoch, et al., 1999; Zboja & Voorhees, 2006; Mitchell,
2008).
Main Supplier
↓ ↓ ↓
Department Stores
1. Lab Concept
2. Harvey
Specialty
Stores
1. Angel
Distributor /
Agent
⊘ This is a preview!⊘
Do you want full access?
Subscribe today to unlock all pages.
Trusted by 1+ million students worldwide
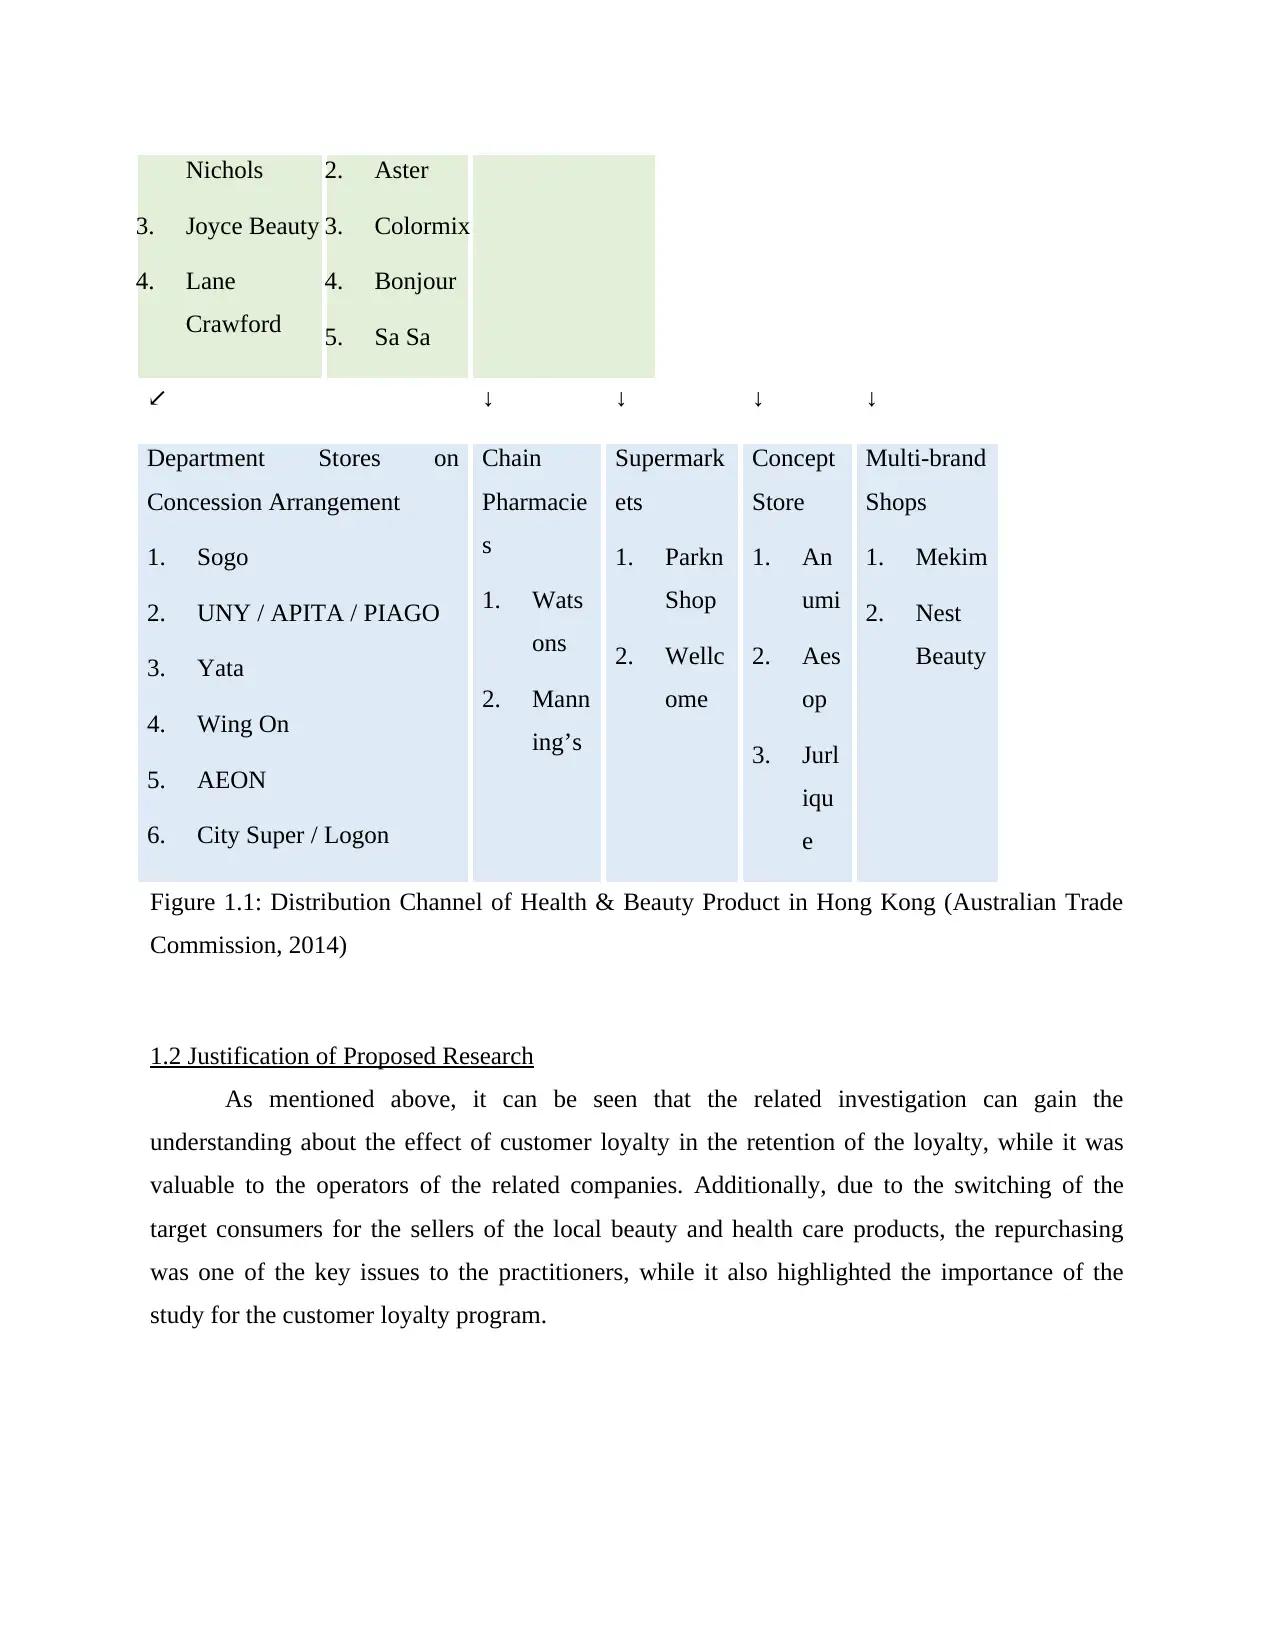
Nichols
3. Joyce Beauty
4. Lane
Crawford
2. Aster
3. Colormix
4. Bonjour
5. Sa Sa
↙ ↓ ↓ ↓ ↓
Department Stores on
Concession Arrangement
1. Sogo
2. UNY / APITA / PIAGO
3. Yata
4. Wing On
5. AEON
6. City Super / Logon
Chain
Pharmacie
s
1. Wats
ons
2. Mann
ing’s
Supermark
ets
1. Parkn
Shop
2. Wellc
ome
Concept
Store
1. An
umi
2. Aes
op
3. Jurl
iqu
e
Multi-brand
Shops
1. Mekim
2. Nest
Beauty
Figure 1.1: Distribution Channel of Health & Beauty Product in Hong Kong (Australian Trade
Commission, 2014)
1.2 Justification of Proposed Research
As mentioned above, it can be seen that the related investigation can gain the
understanding about the effect of customer loyalty in the retention of the loyalty, while it was
valuable to the operators of the related companies. Additionally, due to the switching of the
target consumers for the sellers of the local beauty and health care products, the repurchasing
was one of the key issues to the practitioners, while it also highlighted the importance of the
study for the customer loyalty program.
Paraphrase This Document
Need a fresh take? Get an instant paraphrase of this document with our AI Paraphraser
1.2.1 Importance of Customer Loyalty Programs in Beauty & Health
Care Products retailing context in Hong Kong
Customer loyalty could be interpreted as a consistent re-patronize behaviour from a
customer in the same store or to the same brand disregarding competitors marketing to effort to
attract customer to switch to other brand and location on the one hand and on the others that
customer was willing to recommend the brand and location among friends and colleagues
(Oliver, 1999; McIlroy & Barnett, 2000). Customer loyalty stimulated consistent re-patronize
behaviour because loyal customers were less vulnerable to negative word-of-mouth to their loyal
brand and store location and they were hard to be attracted by other alternatives (Ou, et al.,
2011).
Nonetheless, the blooming of the field was highly affected by the economic factors
(Viola, et al., 2013). Therefore, the improved customer loyalty was an essential way for the
companies in retaining the clients so as to keep their market share (Oliver, 1999; Bhattacharya &
Sen, 2003). Given the highly competitive distribution channels of retailing industry, beauty and
healthcare products were without exception, while they should maintain the local customers so as
to stay their market occupancy. Product differentiation was less useful to attract customers when
foreign branded homogeneities offered by distributors largely reduced the switching costs of
customers (Australian Trade Commission, 2014; Oliaee, et al., 2016); therefore, distributors
encouraged sales with a wide range of customer retaining campaigns and marketing techniques
such as: customer loyalty program, visual merchandising and selection of suitable location
(Australian Trade Commission, 2014; Oliaee, et al., 2016) to improve customer loyalty to store
(Bhattacharya & Sen, 2003; Oliver, 1999).
Take an example, the reward or discount was provided to the returned customers
(Barlow, 1996; Capizzi & Furguson, 2005), while the special treatment for the repurchasing
consumers could be observed as well (Barlow, 1996; Harris, 2000). All of them are with the
objectives of staying the customers in keeping their consumption to the products. Although
quality and price may be two of the keys, the two factors are hard to be alternated due to the high
competition. As a result, the customer retention programs and marketing techniques seem the last
resort for the owners in beauty and health products retailing industry to compete with the store
loyalty among the customer base.
1.2.2 Price Sensitivity in Chinese Society
Price was a cue/indicator to measure quality of products and services in different
societies (Dawar & Parker, 1994; Probert & Lasserre, 1997; McGowan & Sternquist, 1998), but
the degree to which buyers depend on price to measure quality was different (Le Claire, 1992;
Tan & McCullough’s, 1985) as well as the value for quality (Kim, et al., 2002). In the study of
examining the relationship between product quality and patronise decision in apparel retailing,
Chinese preferred products with more functions compare to South Korean (Kim, et al., 2002).
Kim et al (2002) attributed the result to the difference in culture. Chinese were less
individualistic compare to South Korean; therefore, the extrinsic value was more important to
attract customer in Chinese society.
Given that collective culture relied heavily on word-of-mouth feedbacks from
interpersonal networks to valuate a product, higher extrinsic values (products of a lower price
with the same function or more functions) rasied the chances of positive word-of-mouth in
Chinese society that gradually translated to higher degree of acceptance to buy the product
(Schutte & Ciarlante, 1998).
Moreover, in the study of Le Claire (1992) and Tan & McCullough’s (1985), a society
like Hong Kong which shared deeper Chinese beliefs was found more price oriented in making
patronise decision. As a result, price sensitivity can be viewed as a part of the mechanism of
customer loyalty programs that affect store loyalty of a brand.
1.2 Justification of Proposed Research
As mentioned above, it can be seen that the related investigation could gain the
understanding about the effect of customer loyalty in the retention of the loyalty, while it is
valuable to the operators of the related companies. Additionally, due to the switching of the
target consumers for the sellers of the local beauty products, the repurchasing is one of the key
issues to the practitioners, while it also highlights the importance of the study for the customer
loyalty program.
⊘ This is a preview!⊘
Do you want full access?
Subscribe today to unlock all pages.
Trusted by 1+ million students worldwide
1 out of 136


Your All-in-One AI-Powered Toolkit for Academic Success.
+13062052269
info@desklib.com
Available 24*7 on WhatsApp / Email
![[object Object]](/_next/static/media/star-bottom.7253800d.svg)
Unlock your academic potential
Copyright © 2020–2026 A2Z Services. All Rights Reserved. Developed and managed by ZUCOL.