Customer Perceptions of Airlines: Full Service vs Low Cost Carriers
VerifiedAdded on 2023/06/15
|17
|2663
|107
Report
AI Summary
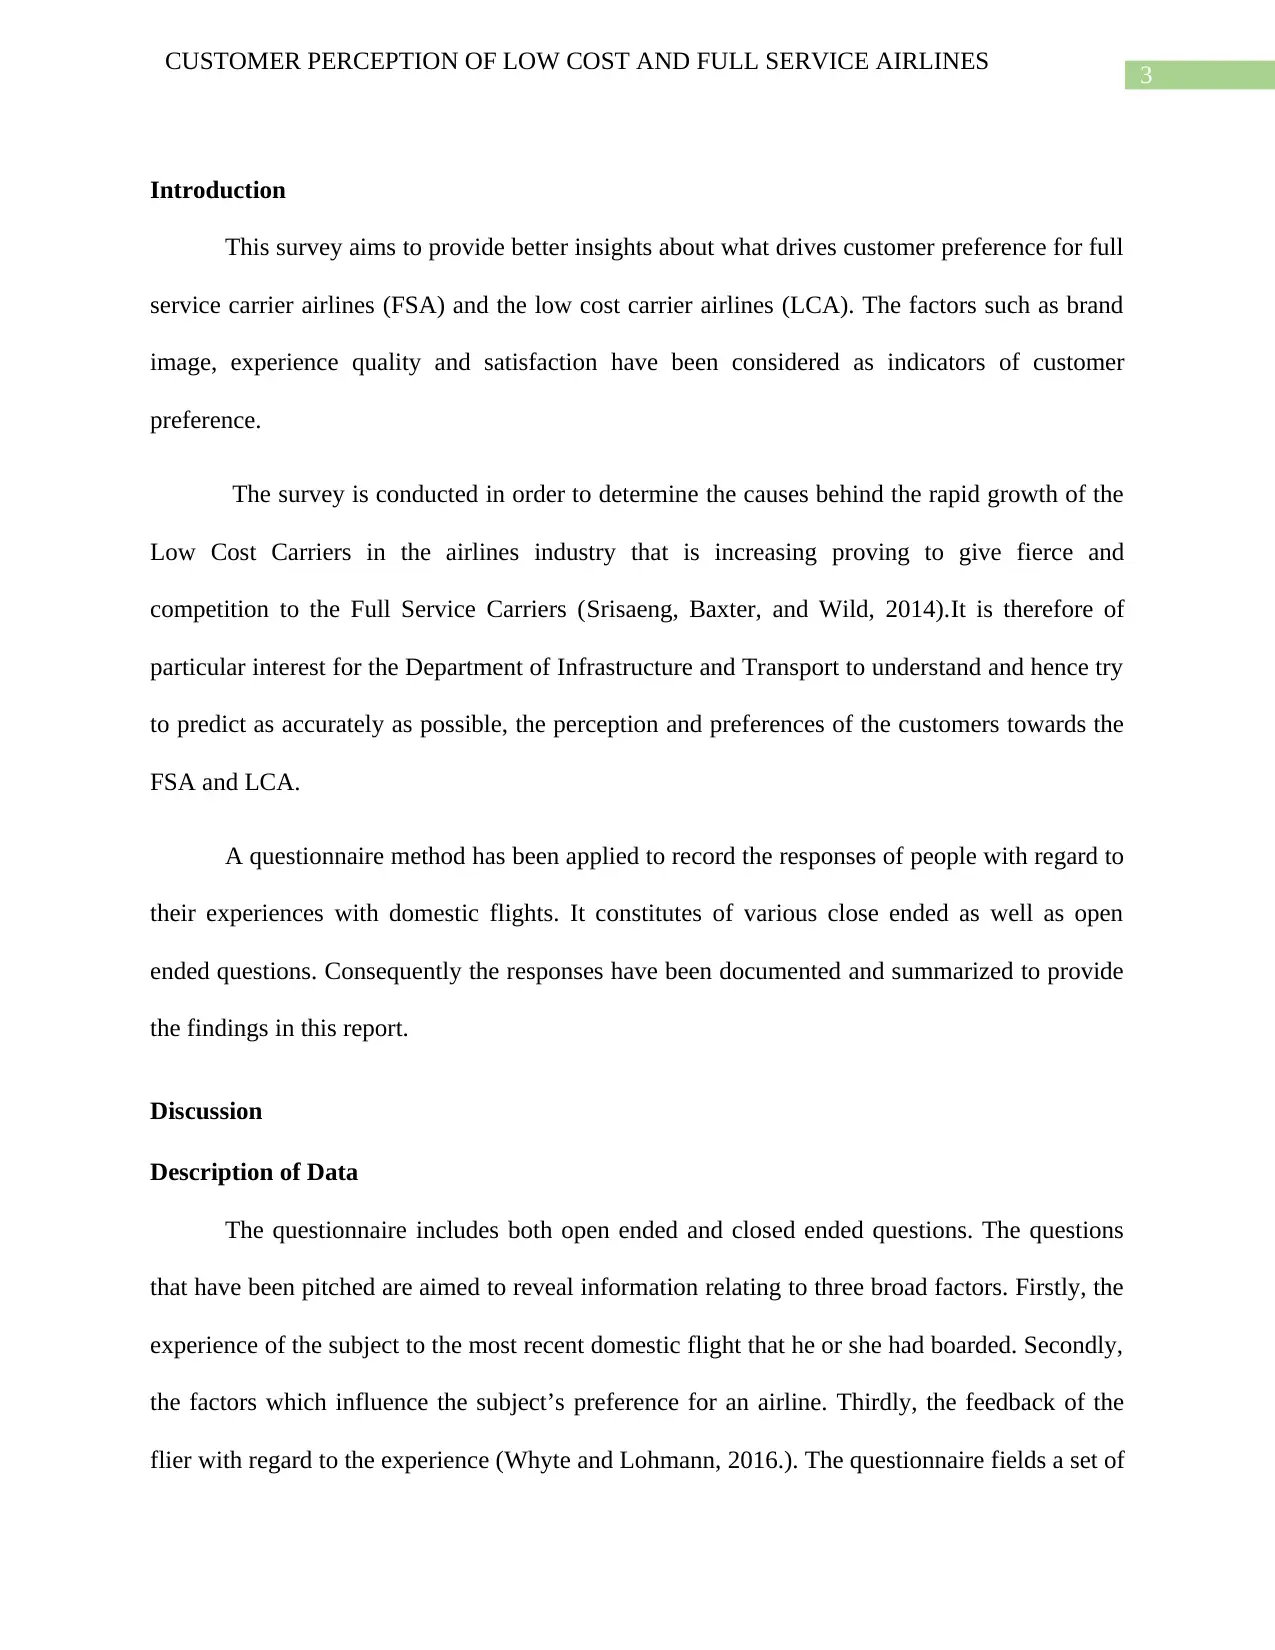
This report investigates customer perceptions of low-cost (LCA) and full-service airlines (FSA), aiming to understand the factors driving customer preference. A questionnaire-based survey was conducted, gathering data on fliers' experiences with domestic flights. The study examines factors like brand image, experience quality, and satisfaction as indicators of customer preference. Findings reveal that affordability is a primary reason for choosing LCAs, while FSAs generally score higher in service-related aspects. Statistical analysis, including a two-sample t-test, was performed to identify significant differences between the two airline types. The report also explores the relationship between travel frequency, purpose of travel, and airline choice. While fliers recognize the trade-offs between cost and service, the study suggests that understanding customer expectations and addressing specific needs can improve overall satisfaction and loyalty. Desklib provides access to this report and other solved assignments to aid students in their studies.

Running head: CUSTOMER PERCEPTION OF LOW COST AND FULL SERVICE
AIRLINES
Customer perception of low cost and full service airlines
Name of Student
Name of University
Author Note
AIRLINES
Customer perception of low cost and full service airlines
Name of Student
Name of University
Author Note
Paraphrase This Document
Need a fresh take? Get an instant paraphrase of this document with our AI Paraphraser

1
CUSTOMER PERCEPTION OF LOW COST AND FULL SERVICE AIRLINES
Executive Summary
The study aims to understand the preference of fliers with regard to low cost airlines and
full service airlines. The study seeks to collect responses of fliers using a questionnaire method
to record their experience and reflection of the last domestic flight that they had boarded. Based
on the collected data, using statistical tools, an attempt is made to understand how a particular
kind of flier may choose the mode of air travel and the ensuing satisfaction that is experienced.s

2
CUSTOMER PERCEPTION OF LOW COST AND FULL SERVICE AIRLINES
Table of Contents
Introduction......................................................................................................................................3
Discussion........................................................................................................................................3
Description of Data......................................................................................................................3
Methodology................................................................................................................................4
Findings.......................................................................................................................................5
Conclusions....................................................................................................................................12
References......................................................................................................................................13
⊘ This is a preview!⊘
Do you want full access?
Subscribe today to unlock all pages.

Trusted by 1+ million students worldwide

3
CUSTOMER PERCEPTION OF LOW COST AND FULL SERVICE AIRLINES
Introduction
This survey aims to provide better insights about what drives customer preference for full
service carrier airlines (FSA) and the low cost carrier airlines (LCA). The factors such as brand
image, experience quality and satisfaction have been considered as indicators of customer
preference.
The survey is conducted in order to determine the causes behind the rapid growth of the
Low Cost Carriers in the airlines industry that is increasing proving to give fierce and
competition to the Full Service Carriers (Srisaeng, Baxter, and Wild, 2014).It is therefore of
particular interest for the Department of Infrastructure and Transport to understand and hence try
to predict as accurately as possible, the perception and preferences of the customers towards the
FSA and LCA.
A questionnaire method has been applied to record the responses of people with regard to
their experiences with domestic flights. It constitutes of various close ended as well as open
ended questions. Consequently the responses have been documented and summarized to provide
the findings in this report.
Discussion
Description of Data
The questionnaire includes both open ended and closed ended questions. The questions
that have been pitched are aimed to reveal information relating to three broad factors. Firstly, the
experience of the subject to the most recent domestic flight that he or she had boarded. Secondly,
the factors which influence the subject’s preference for an airline. Thirdly, the feedback of the
flier with regard to the experience (Whyte and Lohmann, 2016.). The questionnaire fields a set of
Paraphrase This Document
Need a fresh take? Get an instant paraphrase of this document with our AI Paraphraser

4
CUSTOMER PERCEPTION OF LOW COST AND FULL SERVICE AIRLINES
questions asking to rate the airline the subject had most recently boarded on various factors
spanning from customer service, facilities, boarding time among others as well as indicate the
compliance of the subject on various statements with respect to the airline’s performance and
attributes.
Methodology
Victoria University has conducted a survey on full service airlines and low cost airlines.
This study has been conducted to evaluate the perception of customer about their chosen airlines.
Ten customers have been chosen randomly. It is essential to know which domestic flight they
took recently between full service airline and low cost airline. It is also necessary to know the
reasons behind their choice (Arblaster, 2014).Occupations of the customers have been noted to
evaluate who travels most by flight. They are requested to rate their level of experience with
some attributes such as unique experience, different experience from the previous flight
experience and something new experience of in-flight entertainment facilities( Prideaux and
Whyte, 2014.). It would help to calculate which airline provides better experience with respect
to these attributes. It is also necessary to know whether the ticket prices of these airlines were
reasonable. It would be great to compare among the service process of airlines (Homsombat, Lei,
and Fu, 2014). It is also important to know whether they recommend these airlines .This study
will also try to find if there is an association between professions of the customers and their
chosen airlines. An approximate idea will be found why people travels in airlines (Lim and
Tkaczynski, 2017). The aim of the study is to find the factors that attract the customers to choice
these airlines. It is also important to find between Qantas and Virgin Australia full service
airlines, which one is better (Arjomandi and Seufert, 2014). It is necessary to find which low cost
airline is preferable.

5
CUSTOMER PERCEPTION OF LOW COST AND FULL SERVICE AIRLINES
The scale of the ratings on the various aspects of the experience for the flights are taken
to be between one to five where one is minimum and five maximum. The scores on the factors
have been summed to get an overall score for the flight experience. The maximum score possible
is then 50 as there are 10 components to the score based off the questionnaire (Bryman, 2015).
Factors which they found to be significant in influencing their choice of airlines have also been
considered and the scale of those ratings are taken to be one to five as well. Sum of these scores
gives an overall measure of expected experience. The maximum score possible is then 100 as
there are 20 components to the score based off the questionnaire. The perception of the flier in
terms of facilities provided by the airlines is then considered as scores rated between one and
five. The overall score for perception towards facilities is then calculated from the sum which
can have the maximum value of 75 as there are 15 components to the score based off the
questionnaire. Additionally there are scores of compliance which rate the willingness of the
subjects to use the airline again, recommend it to another, provide positive feedback and consider
it as first choice. These four responses are then compared with the scores to see any tentative
association (Healey, 2014).
Findings
Based on Question 3 of the questionnaire it has been seen that affordability is the leading
reason for the subjects to choose LCAs over FSAs. The figure 1 shows the findings.
⊘ This is a preview!⊘
Do you want full access?
Subscribe today to unlock all pages.

Trusted by 1+ million students worldwide

6
CUSTOMER PERCEPTION OF LOW COST AND FULL SERVICE AIRLINES
Qantas Virgin Australia Jet Star Tiger
FSA LCA
0
0.5
1
1.5
2
2.5
3
3.5
4
4.5
Comparison of airlines on basis of why a customer
would choose to board them
good service
good timings
good facilities
cost being less
Airlines
Votes
Figure 1
Again, it has also been observed that Low cost airlines (low cost airlines) have received
higher scores from the subjects in terms of their willingness to fly by the same mode again in
comparison to Full service airlines.
Airline type Average of “Will use again”
FULL SERVICE
AIRLINES 60
LOW COST AIRLINES 90
Grand Total 72
Table 1
Paraphrase This Document
Need a fresh take? Get an instant paraphrase of this document with our AI Paraphraser

7
CUSTOMER PERCEPTION OF LOW COST AND FULL SERVICE AIRLINES
FSA LCA
0
10
20
30
40
50
60
70
80
90
100
AVERAGE SCORE OF AGREEMENT TO THE
QUESTION,"WILL YOU USE THE AIRLINE AGAIN?"
Figure 3
However, it has been observed that full service airlines scored better than low cost
airlines in all other cases as seen in table 2, figure 2, table 3, figure 3, table 4 and figure 4.
Airline type Score of “Consider as first choice”
FULL SERVICE
AIRLINES 60
LOW COST
AIRLINES 55
Grand Total 58
Table 2

8
CUSTOMER PERCEPTION OF LOW COST AND FULL SERVICE AIRLINES
FSA LCA
52
53
54
55
56
57
58
59
60
61
AVERAGE SCORE OF AGREEMENT TO THE
QUESTION,"WILL BE FIRST CHOICE?"
Figure 4
Airline type Score of “will strongly recommend”
FULL SERVICE AIRLINES 83.33333333
LOW COST AIRLINES 60
Grand Total 74
Table 3
CUSTOMER PERCEPTION OF LOW COST AND FULL SERVICE AIRLINES
FSA LCA
52
53
54
55
56
57
58
59
60
61
AVERAGE SCORE OF AGREEMENT TO THE
QUESTION,"WILL BE FIRST CHOICE?"
Figure 4
Airline type Score of “will strongly recommend”
FULL SERVICE AIRLINES 83.33333333
LOW COST AIRLINES 60
Grand Total 74
Table 3
⊘ This is a preview!⊘
Do you want full access?
Subscribe today to unlock all pages.

Trusted by 1+ million students worldwide

9
CUSTOMER PERCEPTION OF LOW COST AND FULL SERVICE AIRLINES
FSA LCA
0
10
20
30
40
50
60
70
80
90
WILL RECOMMEND TO OTHERS?
Figure 5
Airline type Score of “will say positive things about the airlines”
FULL SERVICE
AIRLINES 76.66666667
LOW COST
AIRLINES 75
Grand Total 76
Table 4
FSA LCA
74
74.5
75
75.5
76
76.5
77
POSITIVE FEEDBACK?
Paraphrase This Document
Need a fresh take? Get an instant paraphrase of this document with our AI Paraphraser

10
CUSTOMER PERCEPTION OF LOW COST AND FULL SERVICE AIRLINES
Figure 6
Considering the net experience of the subjects in their last domestic flight, the scores for
each airline considered are as follows:
Airlines Score of Overall flight experience
Jet Star Airlines 54.33333333
Qantas Airlines 63.83333333
Tiger Airlines 66.66666667
Virgin Airlines 71.83333333
Table 5
Jet Star qantas tiger Virgin
0
10
20
30
40
50
60
70
80
Scores of Over all flight experience
Figure 7
It is to be determined degree to which the observed scores and the scores expected by the
fliers are being met. The positive deviation from the expected scores are to be considered and it
is to be seen whether the deviation is more or less same for full service airlines and low cost
airlines or not. A two sample t-test has been carried out for the differences in scores for the two
groups of observations, namely full service airlines and low cost airlines (Weiss and Weiss,
2012). No significant difference could be identified.

11
CUSTOMER PERCEPTION OF LOW COST AND FULL SERVICE AIRLINES
t-Test: Two-Sample Assuming Unequal Variances
Variable 1 Variable 2
Mean 4.833333 2.833333
Variance 14.33333 37.72222
Number of Observations 4 6
Hypothesized Mean Difference 0
Degrees of freedom(DF) 8
t Stat 0.636595
P(T<=t) one-tail 0.271085
t Critical one-tail 1.859548
P(T<=t) two-tail 0.54217
t Critical two-tail 2.306004
Table 6
Table 6 shows the results of the two sample t-test. The hypothesis to be tested against the
tentative null, states that there is significant difference between low cost carrier airlines and full
service carrier airlines in terms of the deviation of expected performance score of the airline by
the flier from the overall observed performance of the airline (Weiss and Weiss, 2012). The
alternate however fails to reject the tentative null which states that there is no difference between
the two groups.
It is to be noted that even though low cost airlines are seen to be less preferred in terms of
their service, fliers show an affinity towards low cost airlines. Additionally, it seems that fliers
are well aware of what to expect from their choice of airlines as apparent from Table 6.
Therefore, there must exist some other factors which are driving fliers to choose low cost
airlines.
Figure 6 shows the expected flight experience of fliers choosing low cost airlines and full
service airlines in comparison to the actual experience.
⊘ This is a preview!⊘
Do you want full access?
Subscribe today to unlock all pages.

Trusted by 1+ million students worldwide
1 out of 17
Related Documents
Your All-in-One AI-Powered Toolkit for Academic Success.
+13062052269
info@desklib.com
Available 24*7 on WhatsApp / Email
Unlock your academic potential
Copyright © 2020–2025 A2Z Services. All Rights Reserved. Developed and managed by ZUCOL.


