Customer Preference Analysis & Business Decision Making in Restaurants

Verified

Added on  2023/04/21

|14
|751
|379
Report
AI Summary
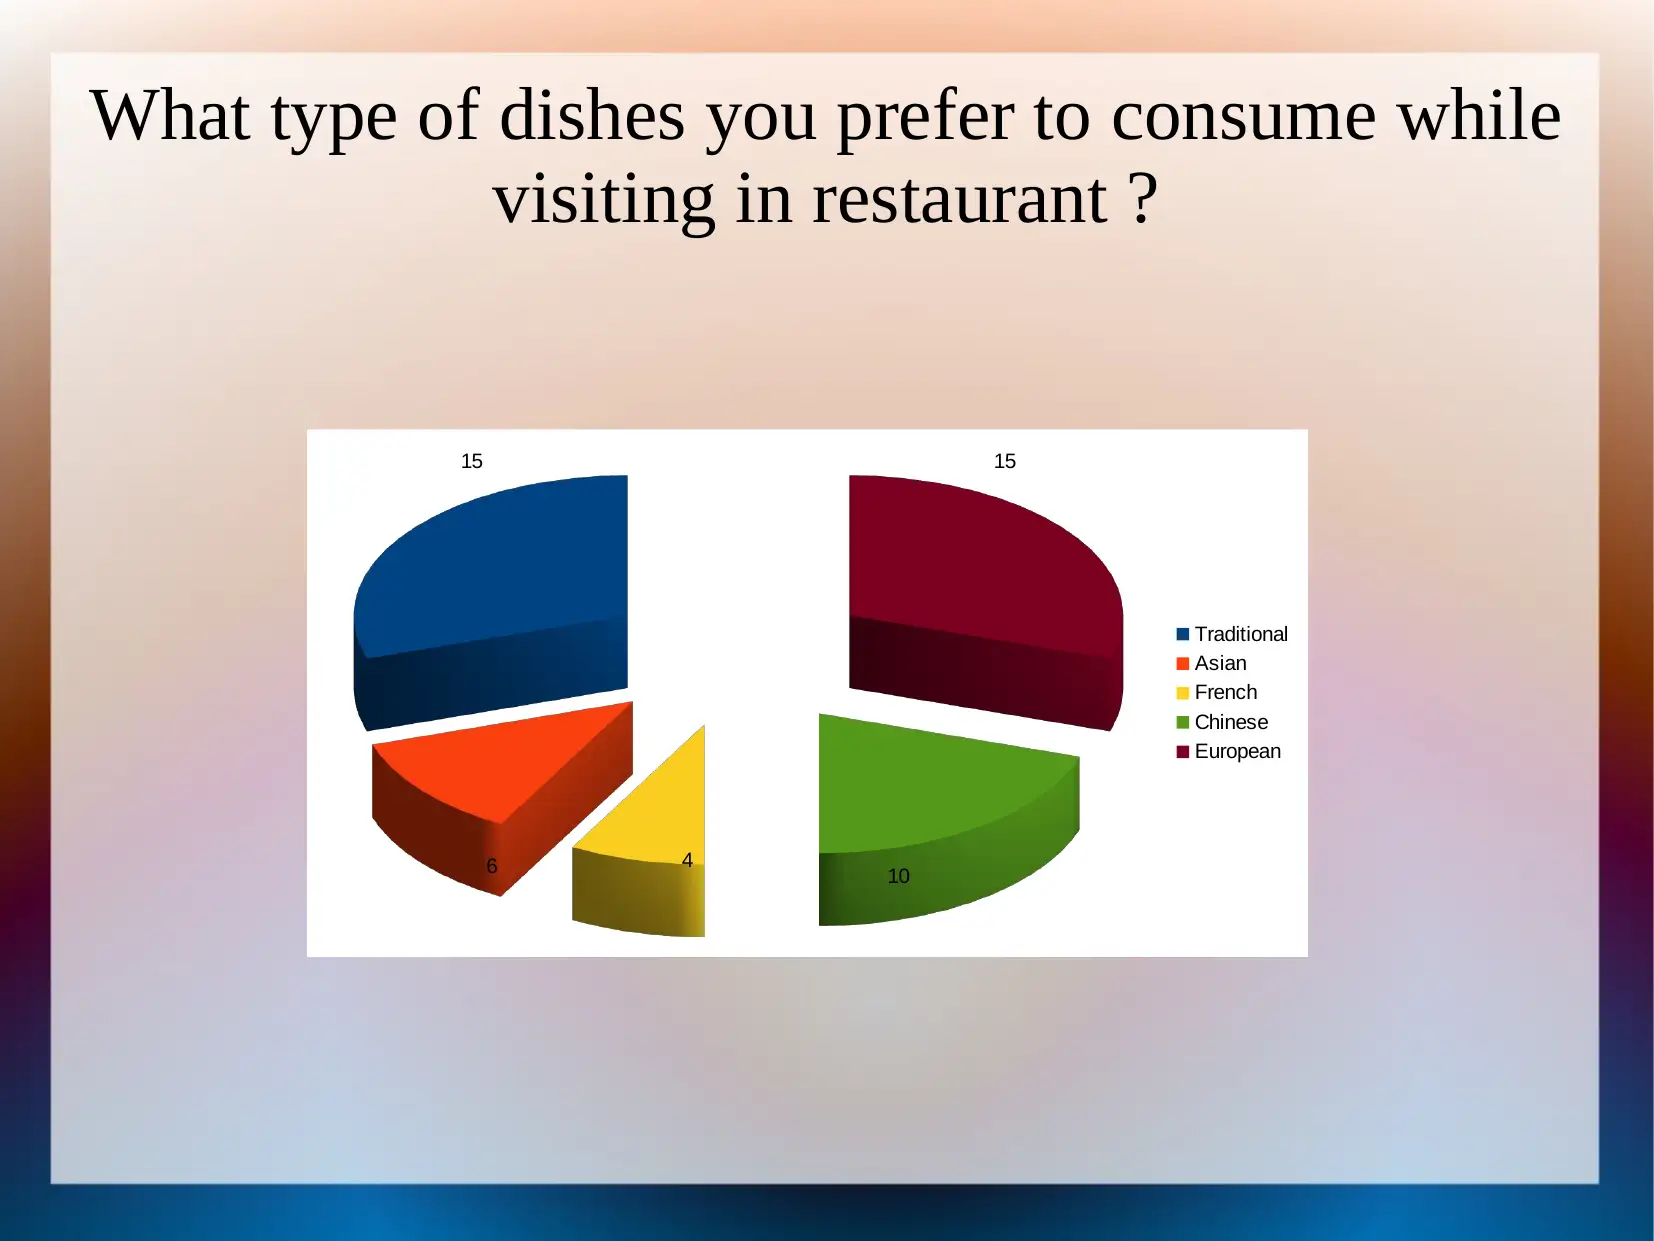
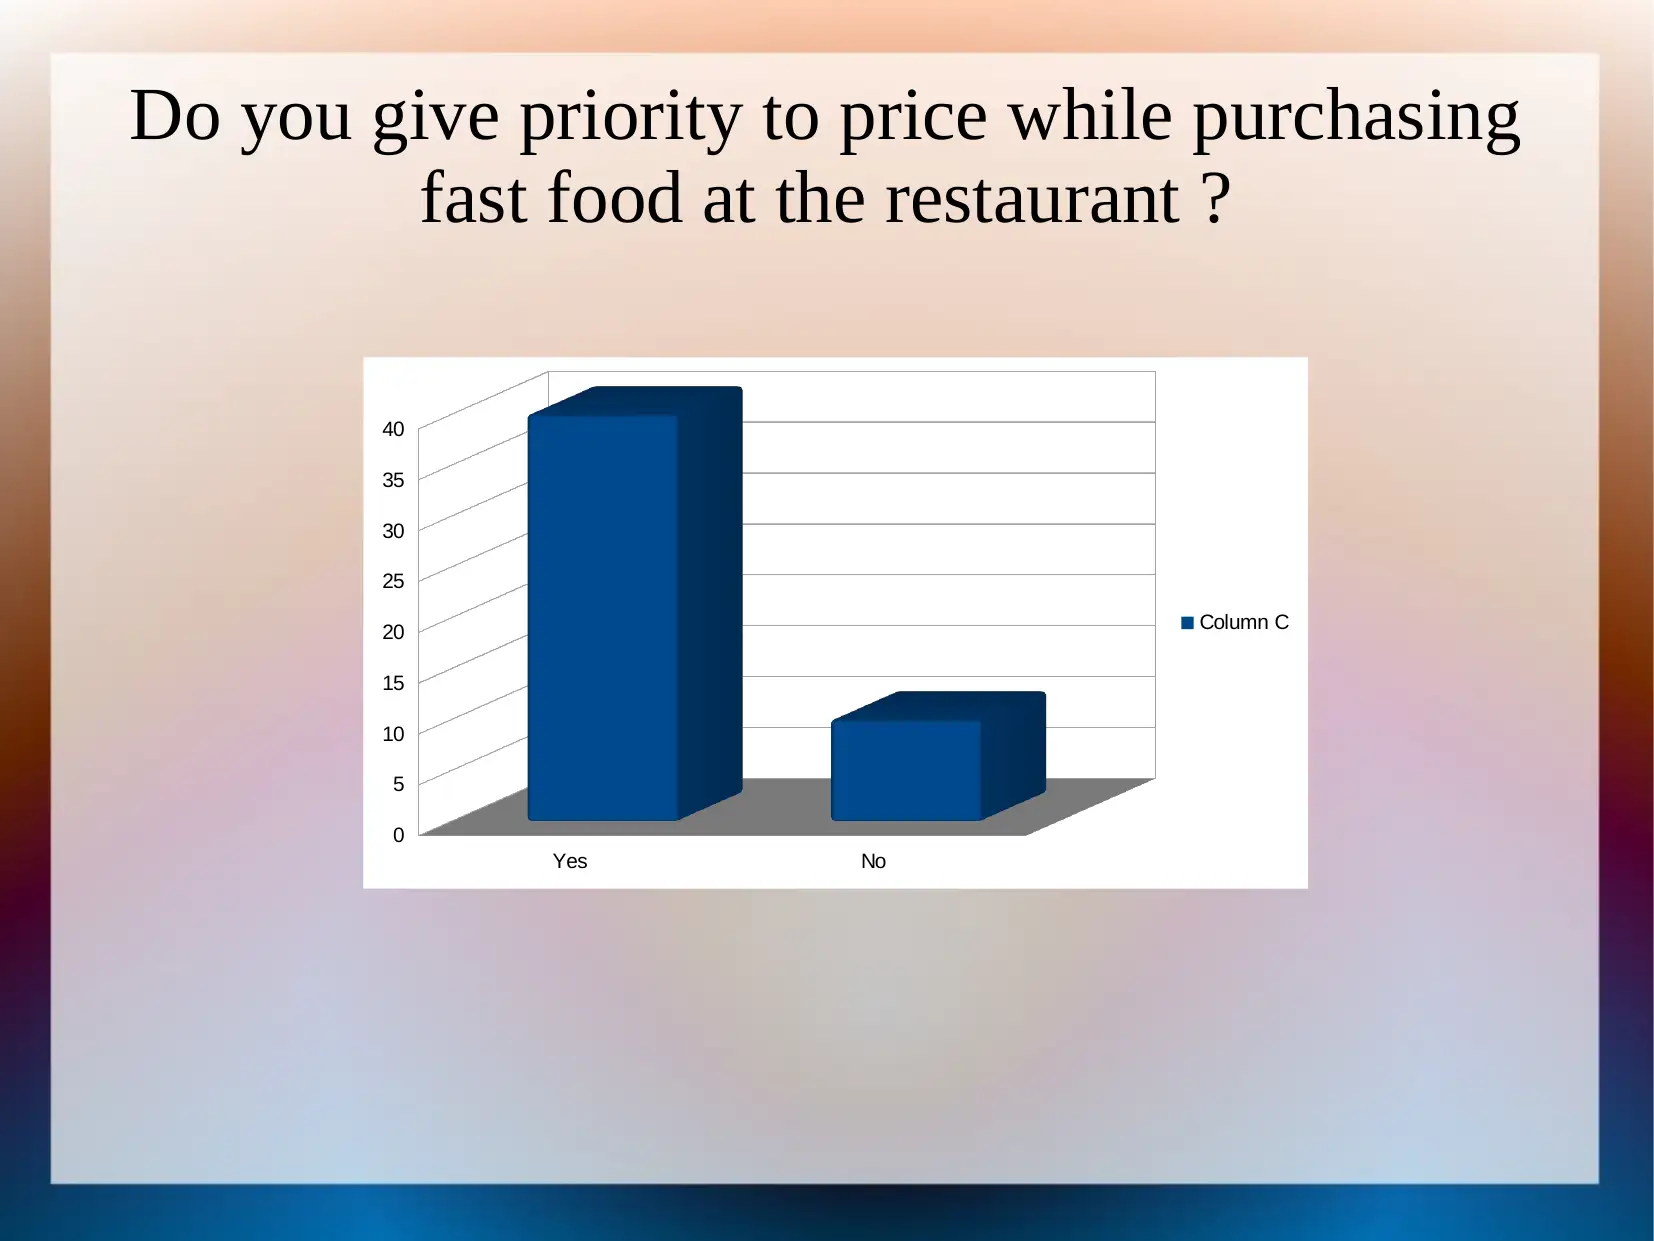
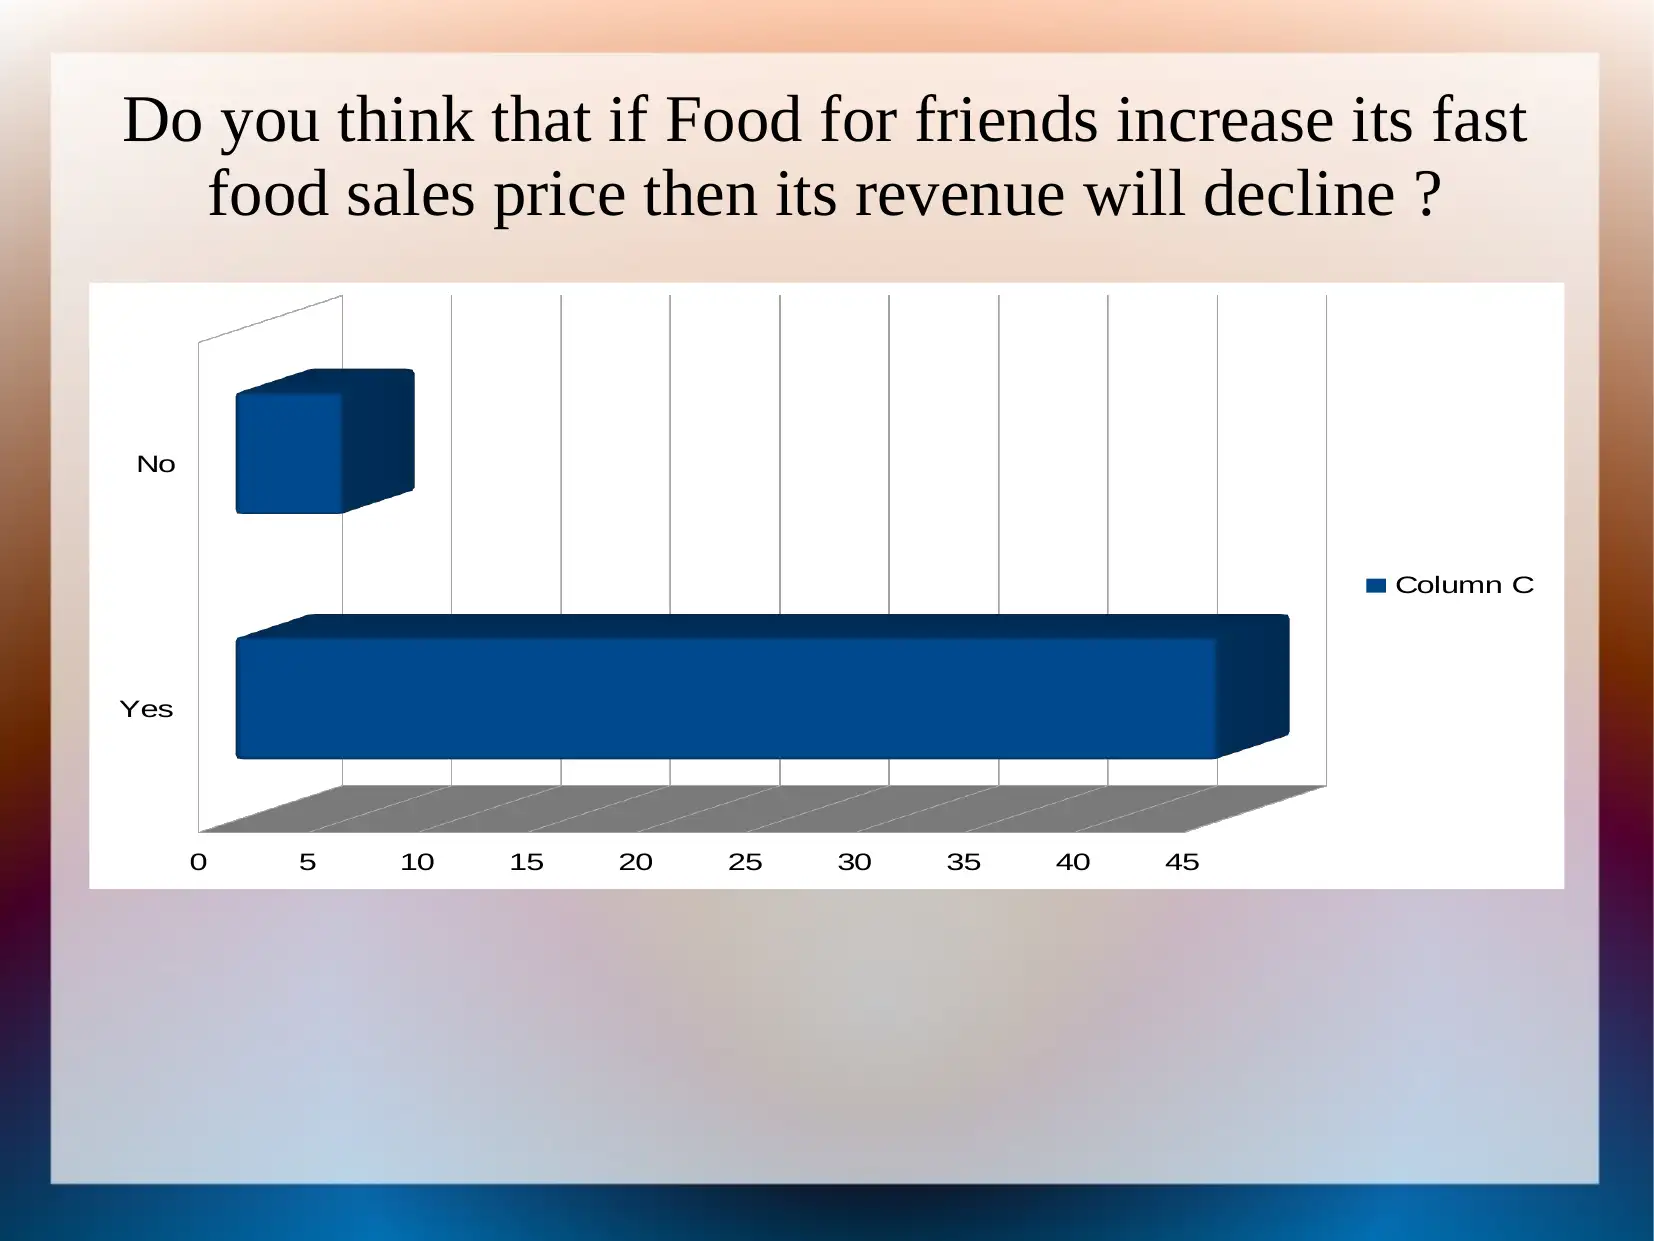
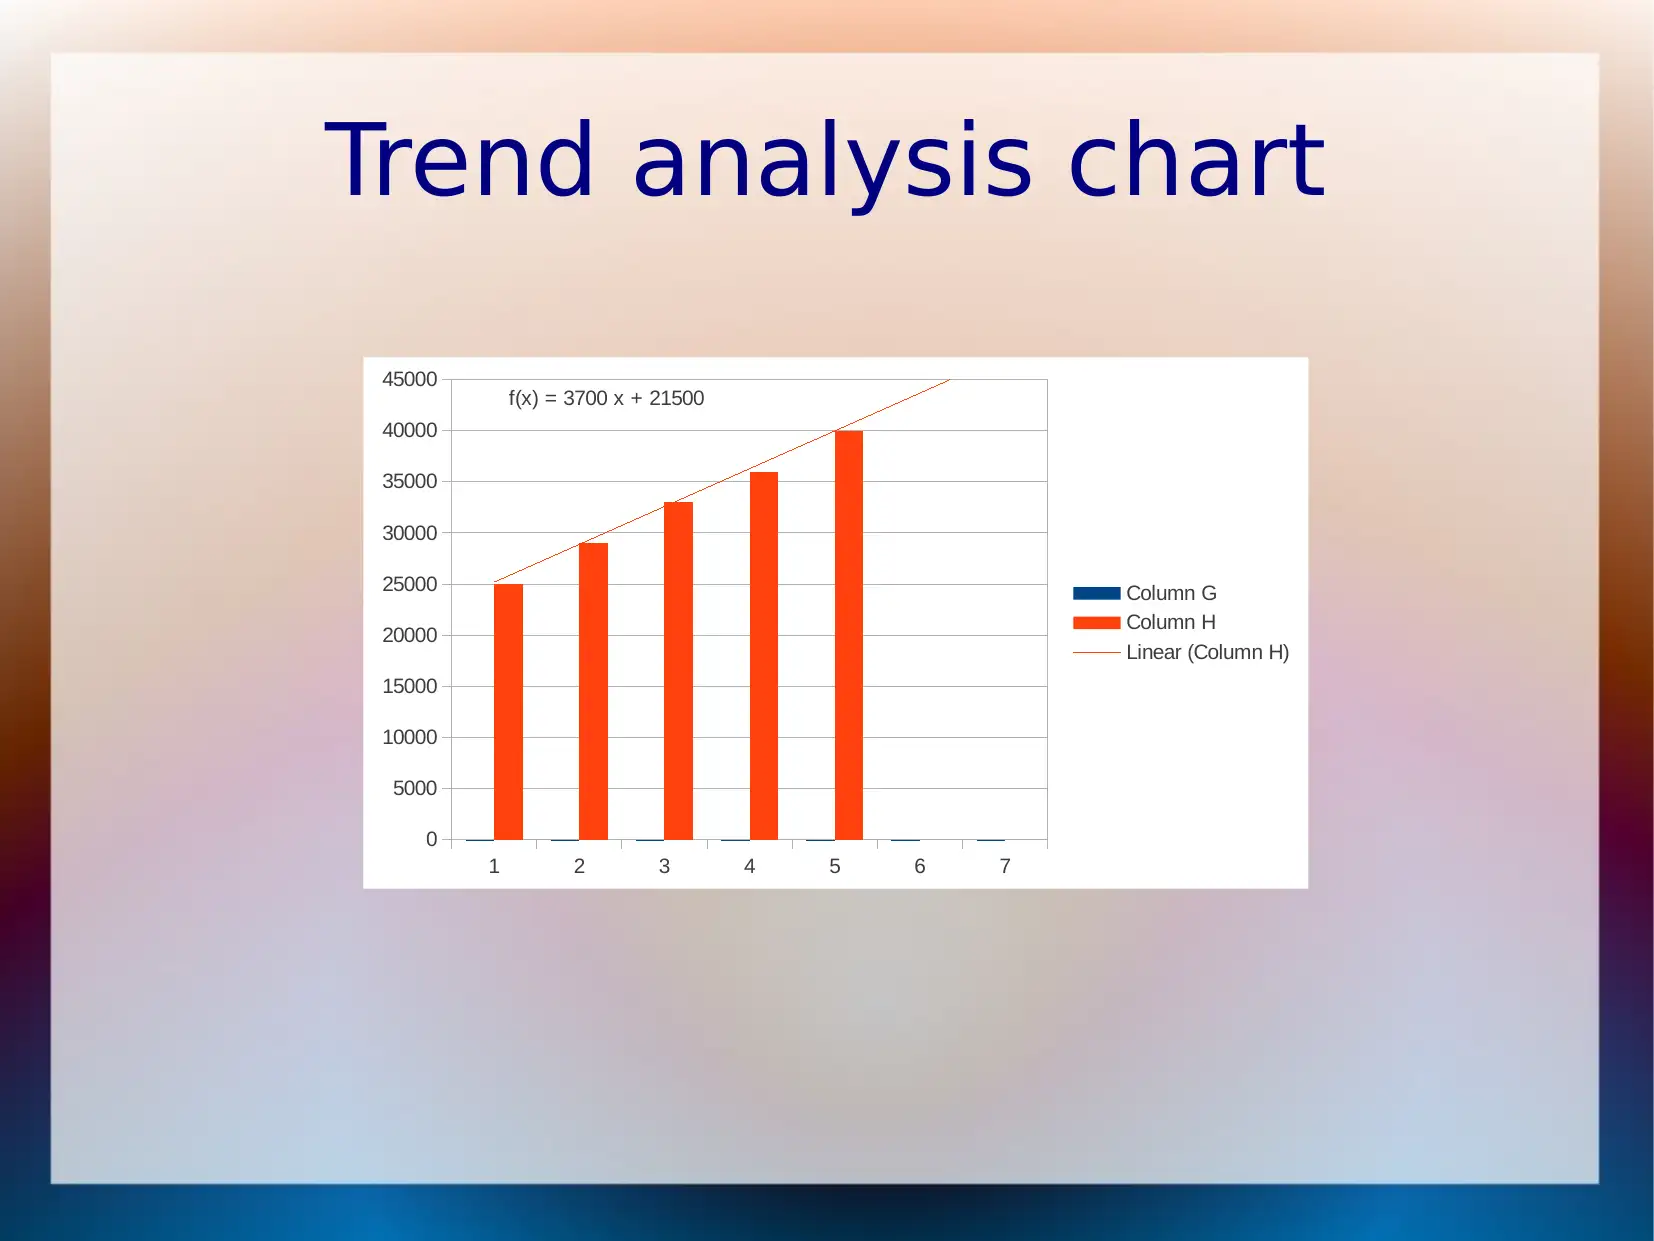
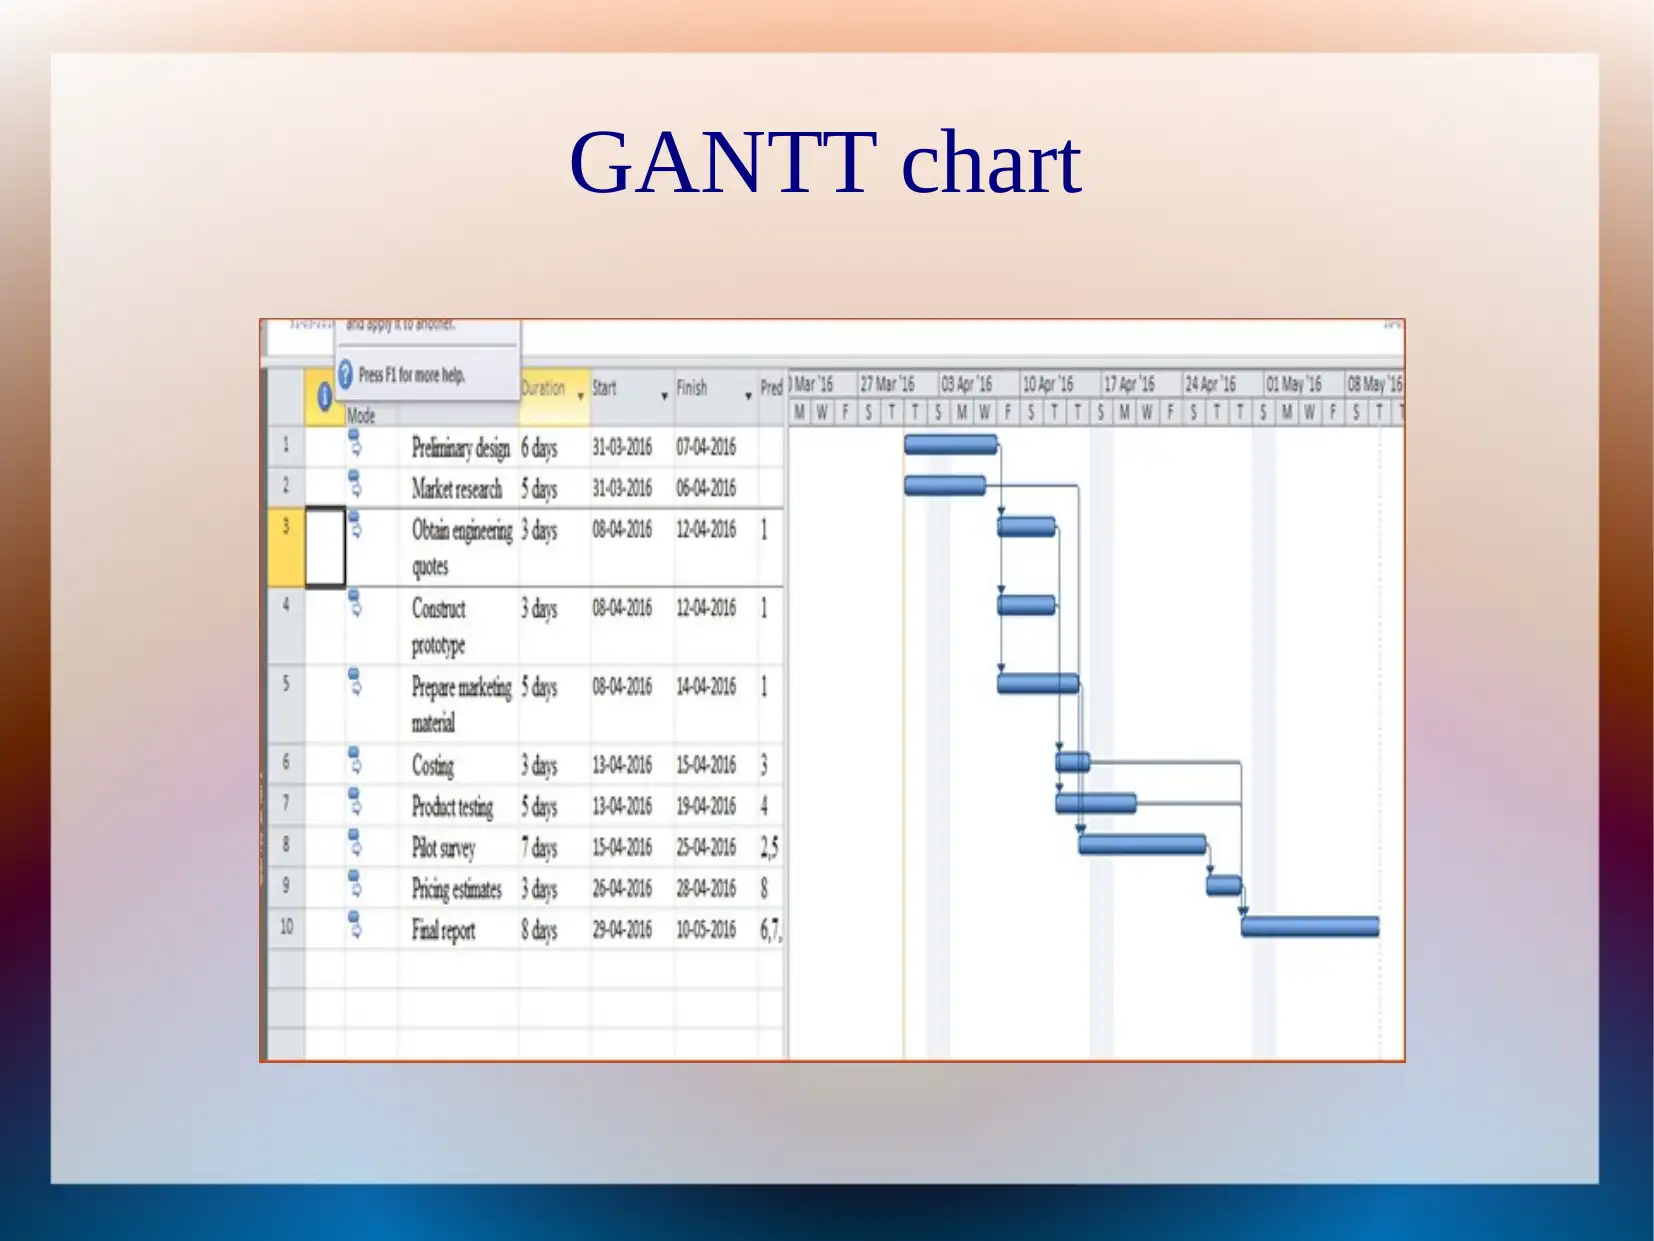
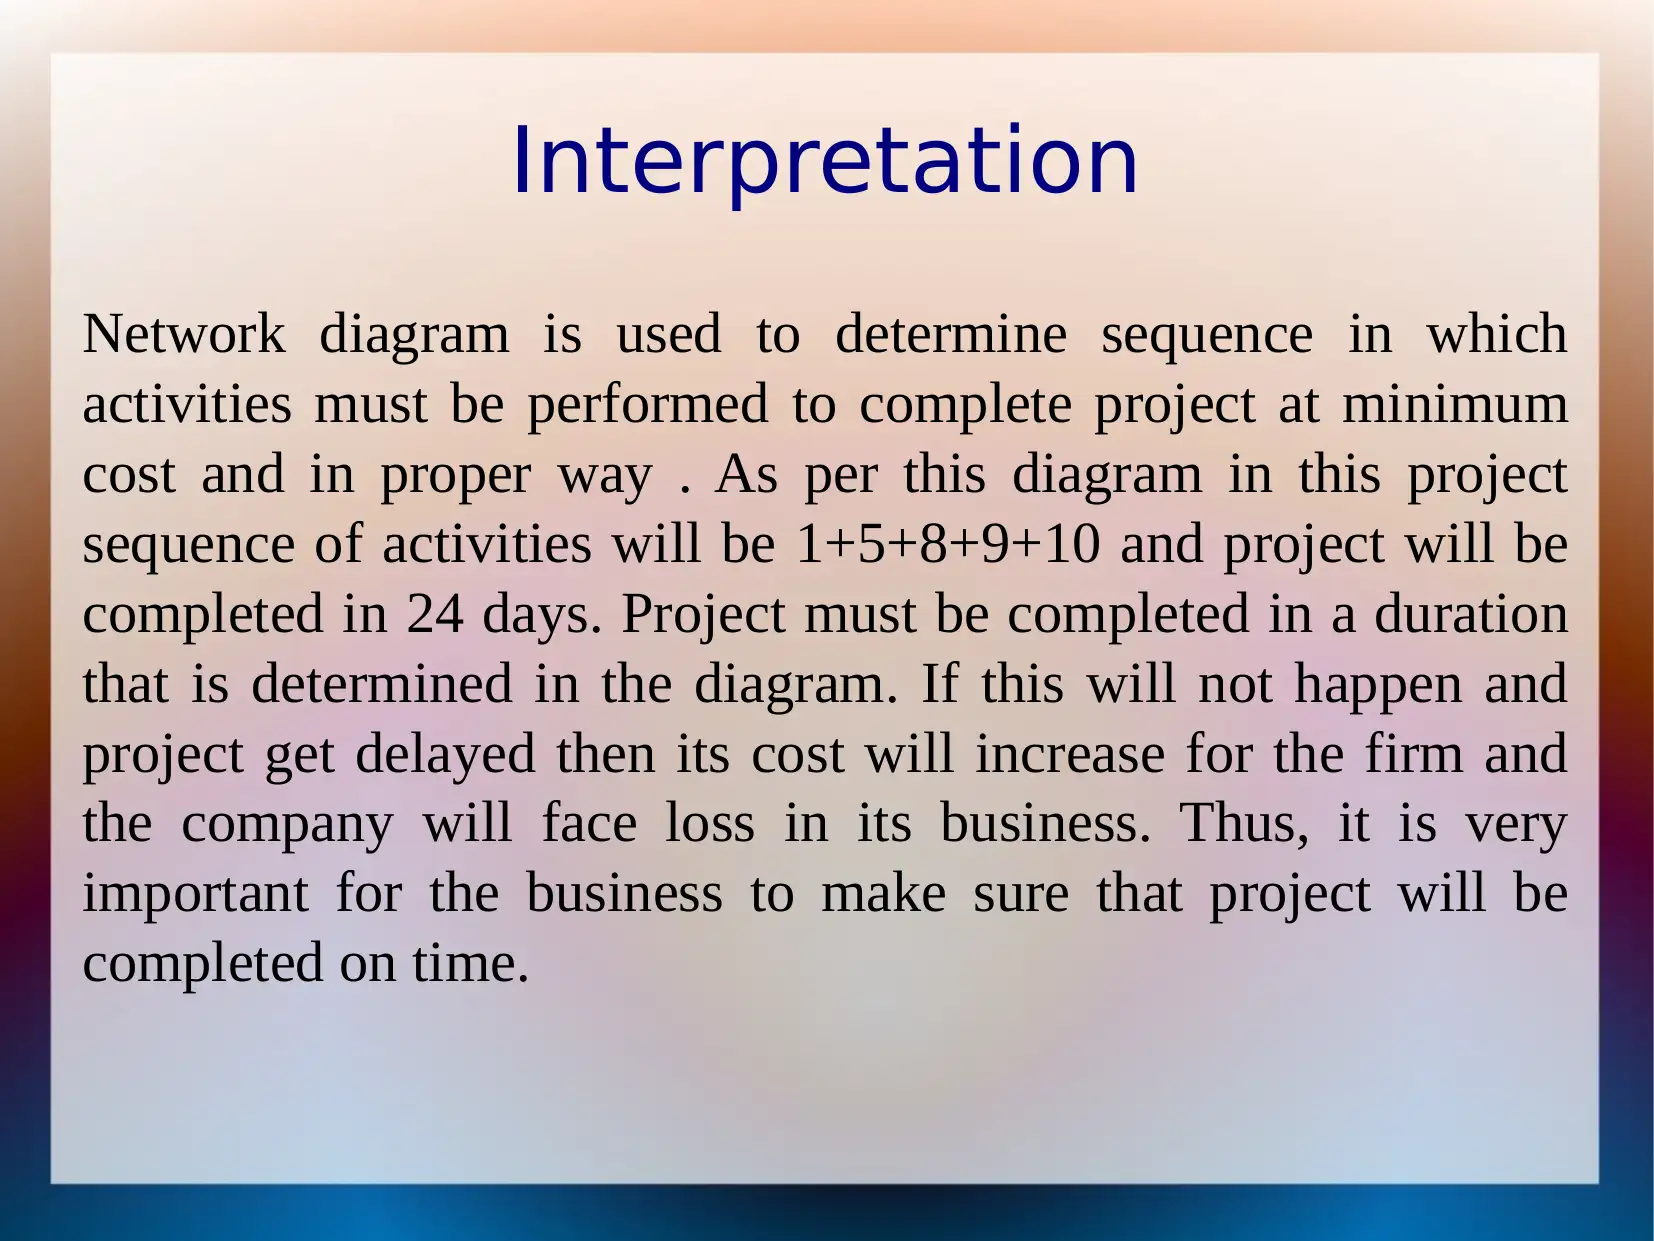
This report analyzes customer preferences in a restaurant setting to inform business decisions. It examines preferred dish types, price sensitivity when purchasing fast food, and the potential impact of price increases on revenue. Trend analysis forecasts increasing cash flows, supported by the growing tourism sector in the UK, suggesting opportunities for restaurant growth. A Gantt chart and network diagram are used to optimize project timelines and minimize costs. The report emphasizes the importance of considering customer price sensitivity and completing projects on time to avoid financial losses. This document is available on Desklib, a platform offering a wealth of study resources and solved assignments for students.
Document Page
BUSINESS DECISION
MAKING
tabler-icon-diamond-filled.svg

Paraphrase This Document

Need a fresh take? Get an instant paraphrase of this document with our AI Paraphraser
Document Page
What type of dishes you prefer to consume while
visiting in restaurant ?
15
6 4 10
15
Traditional
Asian
French
Chinese
European
Document Page
Interpretation
It can be seen from the table that large number of
people like to consume Chinese, European and
traditional dishes in the restaurant. They do not prefer
Asian and French dishes and thus, it can be said that
restaurant chain must focus on European, Chinese and
traditional dishes to grow its business at a rapid pace.
Document Page
Do you give priority to price while purchasing
fast food at the restaurant ?
Yes No
0
5
10
15
20
25
30
35
40
Column C
tabler-icon-diamond-filled.svg

Paraphrase This Document

Need a fresh take? Get an instant paraphrase of this document with our AI Paraphraser
Document Page
Interpretation
Research results clearly show that most of people give
priority to price while purchasing fast food items. Out
of 50, 40 respondents accept that they give priority to
price while making purchase of fast food items. Only
10 respondents state that they give less importance to
price of the product while making purchase decisions.
Thus, Food for friends must keep its product’s price
low to boost sale of the product.
Document Page
Do you think that if Food for friends increase its fast
food sales price then its revenue will decline ?
Yes
No
0 5 10 15 20 25 30 35 40 45
Column C
Document Page
Interpretation
Research results are clearly showing that most of the
respondents think that if restaurant chain will increase
price of its products then it will put negative impact on
its business. 45 respondents agree with this fact and
only 5 were disagree with this statement. Hence, it can
be said that customer’s are price sensitive and firm
needs to keep its product price low relative to rival
restaurant chains.
tabler-icon-diamond-filled.svg

Paraphrase This Document

Need a fresh take? Get an instant paraphrase of this document with our AI Paraphraser
Document Page
Trend analysis chart
1 2 3 4 5 6 7
0
5000
10000
15000
20000
25000
30000
35000
40000
45000 f(x) = 3700 x + 21500
Column G
Column H
Linear (Column H)
Document Page
Interpretation
Trend analysis is a method that is used to forecast about the firm cash flows.
This technique on the basis of past years figures makes a prediction about the
future. From above chart it can be seen that firm cash flows increased in
forecasted year. Business condition are also in favour of restaurant because
government of UK is focusing on bossing travel and tourism sector in the
country and it has increased at a rapid rate in the mentioned nation. If this
industry will grow then more and more tourist will arrive in the UK and their
contribution to growth of restaurant business in UK will also increase. Thus, it
can be said that there is lot of scope for the Food for friend restaurant chain in
the UK. However, it cannot entirely rely on the results produced by this method
because it forecast trend on the basis of past scenario and does not consider
probable changes that can takes place in the business environment in future time
period. Hence, firm can not entirely rely on the results produced by the trend
analysis chart.
Document Page
GANTT chart
tabler-icon-diamond-filled.svg

Paraphrase This Document

Need a fresh take? Get an instant paraphrase of this document with our AI Paraphraser
Document Page
Network diagram
Document Page
Interpretation
Network diagram is used to determine sequence in which
activities must be performed to complete project at minimum
cost and in proper way . As per this diagram in this project
sequence of activities will be 1+5+8+9+10 and project will be
completed in 24 days. Project must be completed in a duration
that is determined in the diagram. If this will not happen and
project get delayed then its cost will increase for the firm and
the company will face loss in its business. Thus, it is very
important for the business to make sure that project will be
completed on time.
chevron_up_icon
1 out of 14
circle_padding
hide_on_mobile
zoom_out_icon
[object Object]