Financial Analysis Report: Sales Team Training Workbook
VerifiedAdded on 2019/10/01
|17
|3087
|314
Report
AI Summary
This report presents a comprehensive financial analysis, starting with a training workbook for a sales team, explaining concepts like target profitability, lifetime value cash flow, variable and fixed costs. It provides calculations using sales volume data, assesses variable costs impacting profitability, and describes management accounting procedures for costs like fixed overheads and administrative support, evaluating the methods used. A step-by-step analysis of customer account profitability is provided. The report further includes a financial analysis report, considering customer value, recommendations for growth, business and financial risk evaluation, identification of trends, and data sources. The report incorporates tables, formulas, and examples to support the analysis, offering insights into customer profitability, risk management, and sales strategies.
Hewlett-Packard
Financial analysis
Financial and sales analysis
Name of the author-
Univerisity Name-
[Type the abstract of the document here. The abstract is typically a short summary of the contents
of the document. Type the abstract of the document here. The abstract is typically a short
summary of the contents of the document.]
Paraphrase This Document
Need a fresh take? Get an instant paraphrase of this document with our AI Paraphraser
Table of Contents
Task 1: Prepare a training workbook for members of the sales team........................................2
An explanation of the following concepts......................................................................2
Using 2 made up sales volume numbers (simple) and 2 existing customers’ sales
volumenumbers calculate;..........................................................................................................2
An assessment of the potential variable costs that could impact on the profitability of
accounts......................................................................................................................................3
A description of your organisation’s management accounting procedures for dealing
with the following costs;............................................................................................................4
An evaluation of these costs and why these methods are used.......................................4
Provide a step by step analysis of a customer account for profitability and how you can
use it for on-going measurement of customer performance.......................................................4
Task 2: Prepare a financial analysis report................................................................................6
A consideration of the value of each customer to the organisation................................6
Recommendations on what action to take in terms of growing these customers............6
An evaluation of the business and financial risks associated with each account............6
An identification of any key trends or variances............................................................7
Where you would expect to look for financial data on these accounts (inside and
outside your organisation)..........................................................................................................7
An identification of who else in your organisation would have a stake in the financial
viability and performance of these accounts and how you would ensure appropriate access to
the data.......................................................................................................................................8
A provision of any proformas for capturing performance and financial data about these
accounts and the development of contingency plans for possible problems that may arise with

the financial performance of the accounts.................................................................................8
REFERENCES...........................................................................................................................8
REFERENCES...........................................................................................................................8
⊘ This is a preview!⊘
Do you want full access?
Subscribe today to unlock all pages.
Trusted by 1+ million students worldwide
Task 1: Prepare a training workbook for members of the sales team
An explanation of the following concepts
o TARGET PROFITABILITY: target profitability refers to the level of earnings in form of
profit that the managers have budgeted to achieve for a given time frame. The target
profitability is computed as a part of budget and this figure is used to make a comparison
with the actual result that the company achieves at the end of the set time frame (Wildavsky,
2017). With the comparison, the managers can identify the variances and take decisions in
that line to improve profitability (Bogsnes, 2016).
o LIFE TIME VALUE CASH FLOW: lifetime value of cash flow helps in computing an
amount that is attributed by computing the present value from the specific cash flows. These
cash flows relate to the amounts generated from the relationship that has been maintained
with a customer over the entire life of the business with that customer (Nenonen, &Storbacka,
2016). The life time value cash flow helps in making significant decisions that relate to
marketing, customer support system, product development and sales.
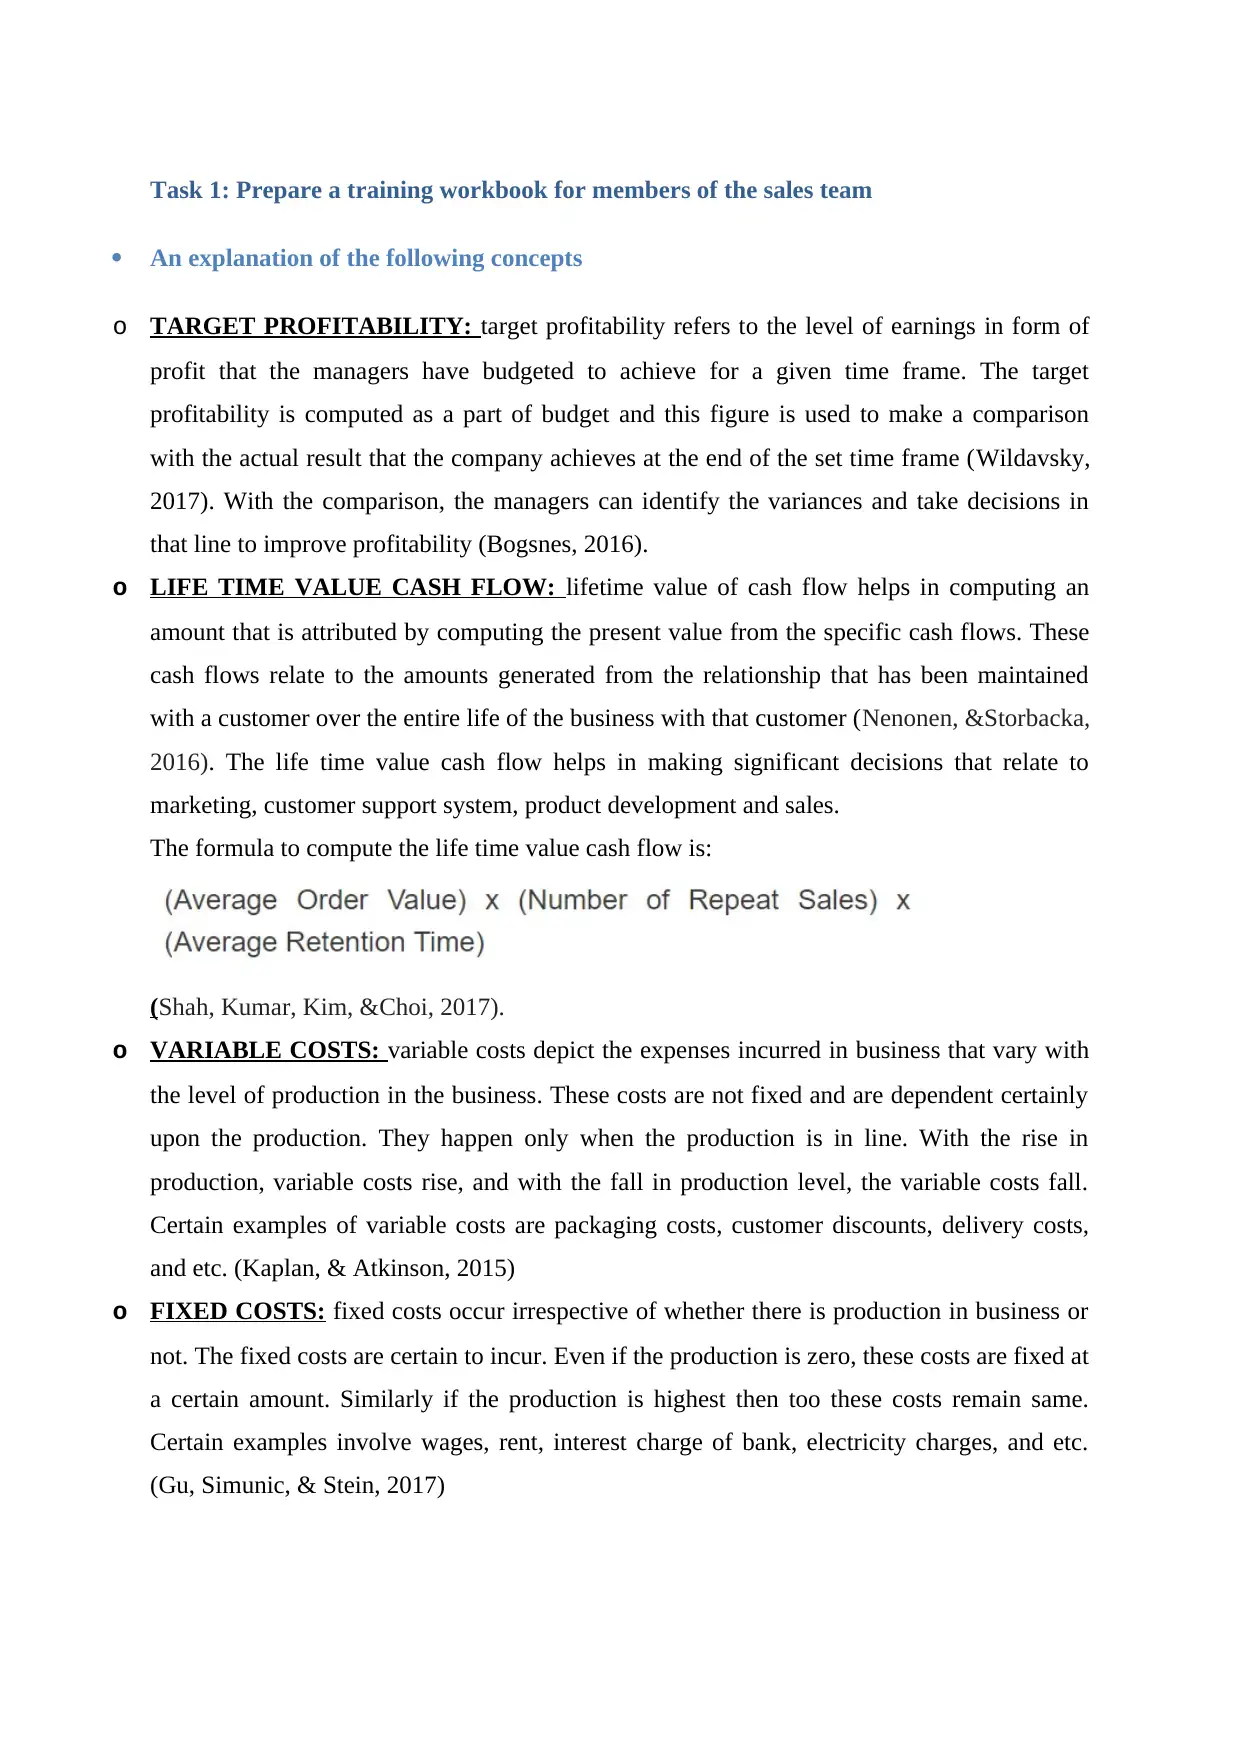
The formula to compute the life time value cash flow is:
(Shah, Kumar, Kim, &Choi, 2017).
o VARIABLE COSTS: variable costs depict the expenses incurred in business that vary with
the level of production in the business. These costs are not fixed and are dependent certainly
upon the production. They happen only when the production is in line. With the rise in
production, variable costs rise, and with the fall in production level, the variable costs fall.
Certain examples of variable costs are packaging costs, customer discounts, delivery costs,
and etc. (Kaplan, & Atkinson, 2015)
o FIXED COSTS: fixed costs occur irrespective of whether there is production in business or
not. The fixed costs are certain to incur. Even if the production is zero, these costs are fixed at
a certain amount. Similarly if the production is highest then too these costs remain same.
Certain examples involve wages, rent, interest charge of bank, electricity charges, and etc.
(Gu, Simunic, & Stein, 2017)
An explanation of the following concepts
o TARGET PROFITABILITY: target profitability refers to the level of earnings in form of
profit that the managers have budgeted to achieve for a given time frame. The target
profitability is computed as a part of budget and this figure is used to make a comparison
with the actual result that the company achieves at the end of the set time frame (Wildavsky,
2017). With the comparison, the managers can identify the variances and take decisions in
that line to improve profitability (Bogsnes, 2016).
o LIFE TIME VALUE CASH FLOW: lifetime value of cash flow helps in computing an
amount that is attributed by computing the present value from the specific cash flows. These
cash flows relate to the amounts generated from the relationship that has been maintained
with a customer over the entire life of the business with that customer (Nenonen, &Storbacka,
2016). The life time value cash flow helps in making significant decisions that relate to
marketing, customer support system, product development and sales.
The formula to compute the life time value cash flow is:
(Shah, Kumar, Kim, &Choi, 2017).
o VARIABLE COSTS: variable costs depict the expenses incurred in business that vary with
the level of production in the business. These costs are not fixed and are dependent certainly
upon the production. They happen only when the production is in line. With the rise in
production, variable costs rise, and with the fall in production level, the variable costs fall.
Certain examples of variable costs are packaging costs, customer discounts, delivery costs,
and etc. (Kaplan, & Atkinson, 2015)
o FIXED COSTS: fixed costs occur irrespective of whether there is production in business or
not. The fixed costs are certain to incur. Even if the production is zero, these costs are fixed at
a certain amount. Similarly if the production is highest then too these costs remain same.
Certain examples involve wages, rent, interest charge of bank, electricity charges, and etc.
(Gu, Simunic, & Stein, 2017)
Paraphrase This Document
Need a fresh take? Get an instant paraphrase of this document with our AI Paraphraser
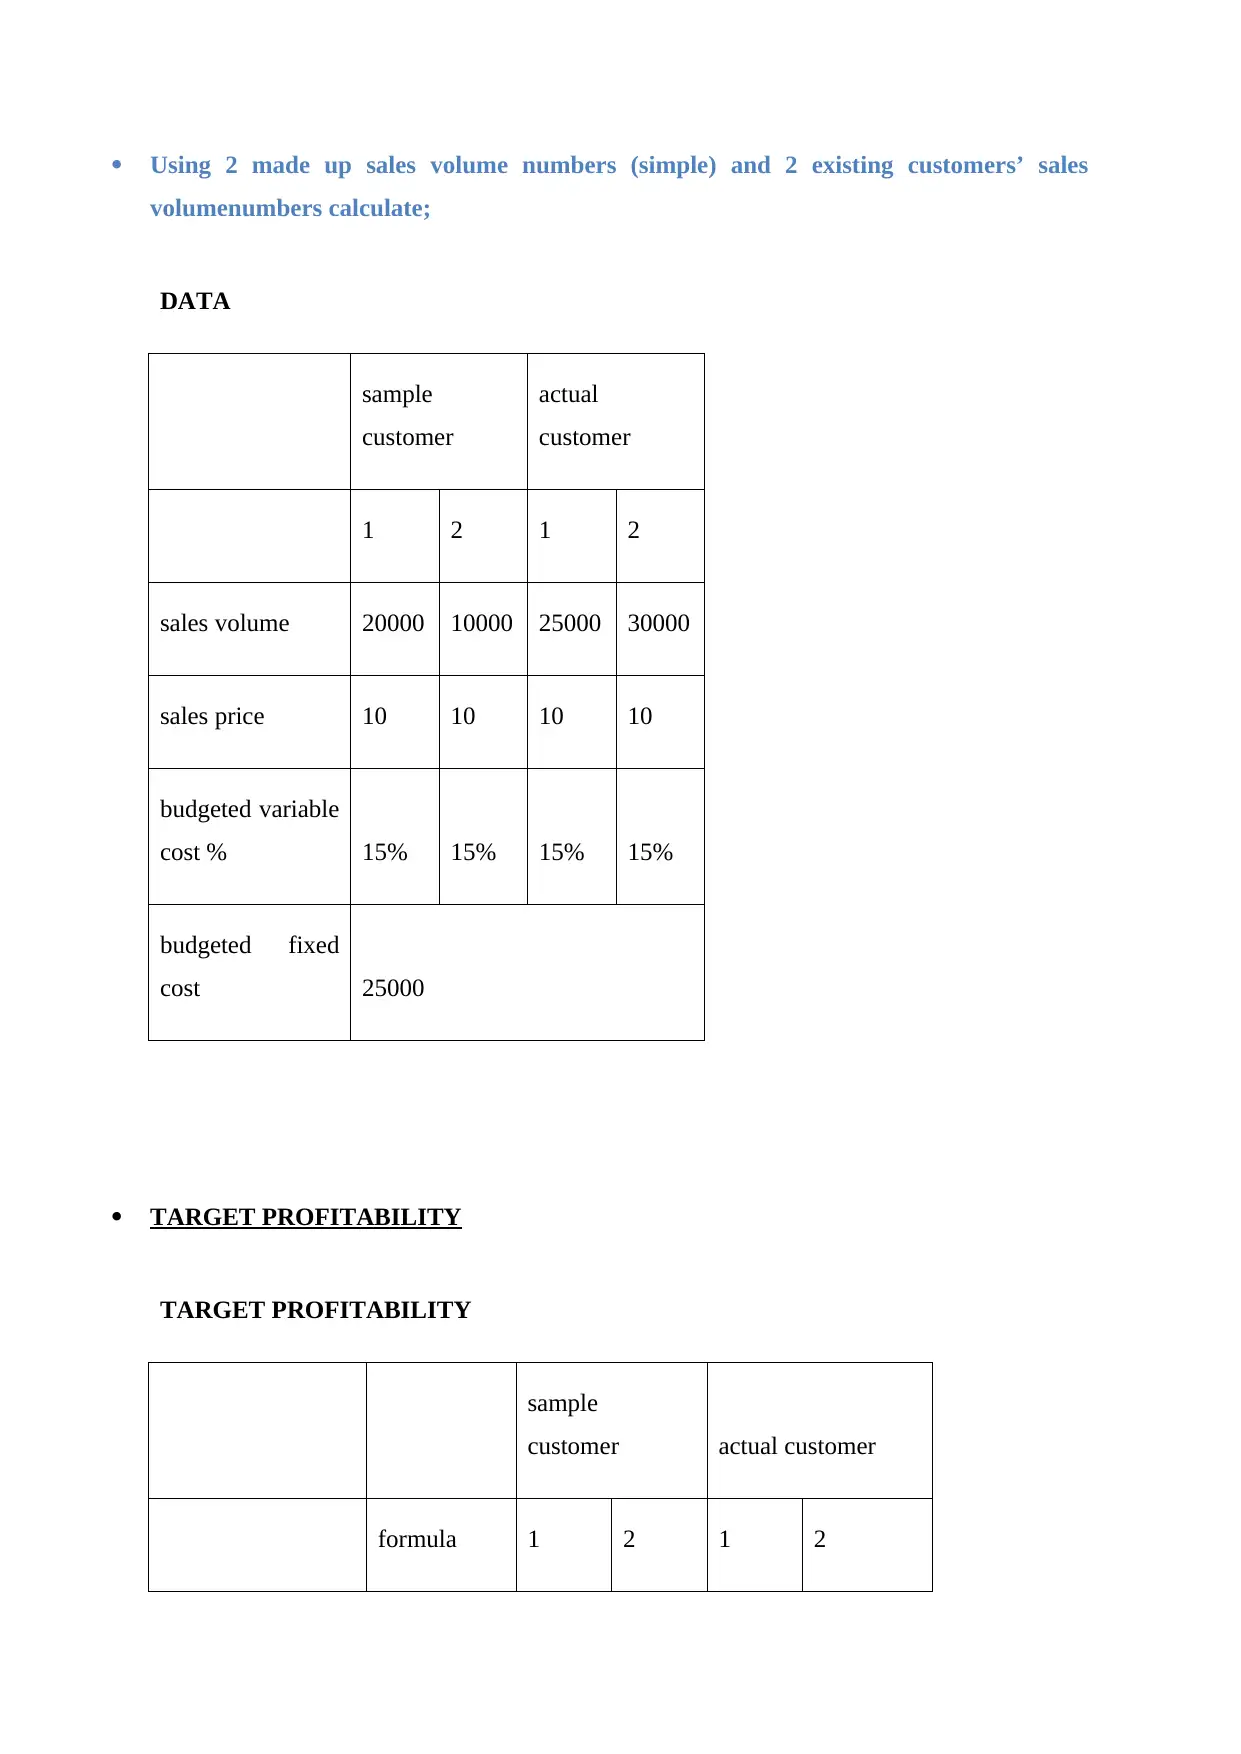
Using 2 made up sales volume numbers (simple) and 2 existing customers’ sales
volumenumbers calculate;
DATA
sample
customer
actual
customer
1 2 1 2
sales volume 20000 10000 25000 30000
sales price 10 10 10 10
budgeted variable
cost % 15% 15% 15% 15%
budgeted fixed
cost 25000
TARGET PROFITABILITY
TARGET PROFITABILITY
sample
customer actual customer
formula 1 2 1 2
volumenumbers calculate;
DATA
sample
customer
actual
customer
1 2 1 2
sales volume 20000 10000 25000 30000
sales price 10 10 10 10
budgeted variable
cost % 15% 15% 15% 15%
budgeted fixed
cost 25000
TARGET PROFITABILITY
TARGET PROFITABILITY
sample
customer actual customer
formula 1 2 1 2
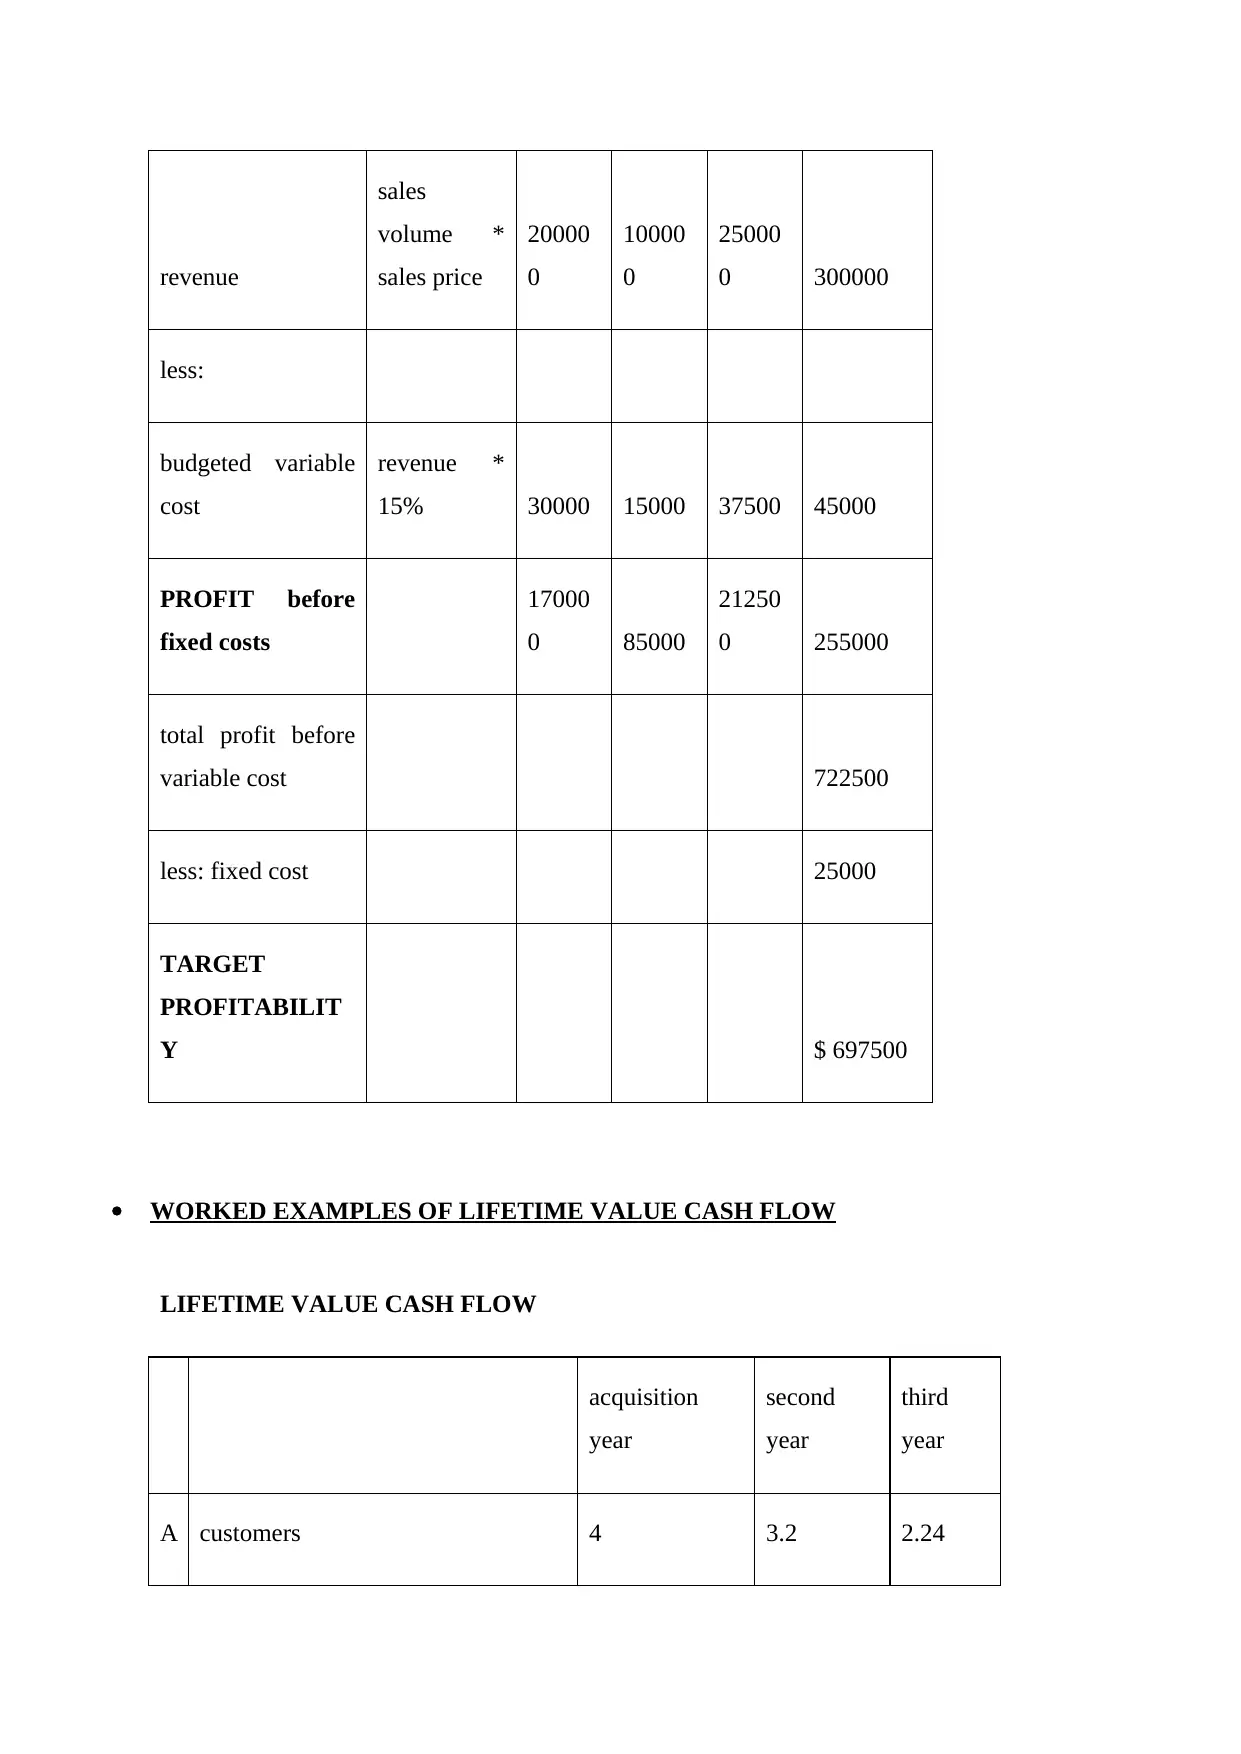
revenue
sales
volume *
sales price
20000
0
10000
0
25000
0 300000
less:
budgeted variable
cost
revenue *
15% 30000 15000 37500 45000
PROFIT before
fixed costs
17000
0 85000
21250
0 255000
total profit before
variable cost 722500
less: fixed cost 25000
TARGET
PROFITABILIT
Y $ 697500
WORKED EXAMPLES OF LIFETIME VALUE CASH FLOW
LIFETIME VALUE CASH FLOW
acquisition
year
second
year
third
year
A customers 4 3.2 2.24
⊘ This is a preview!⊘
Do you want full access?
Subscribe today to unlock all pages.
Trusted by 1+ million students worldwide
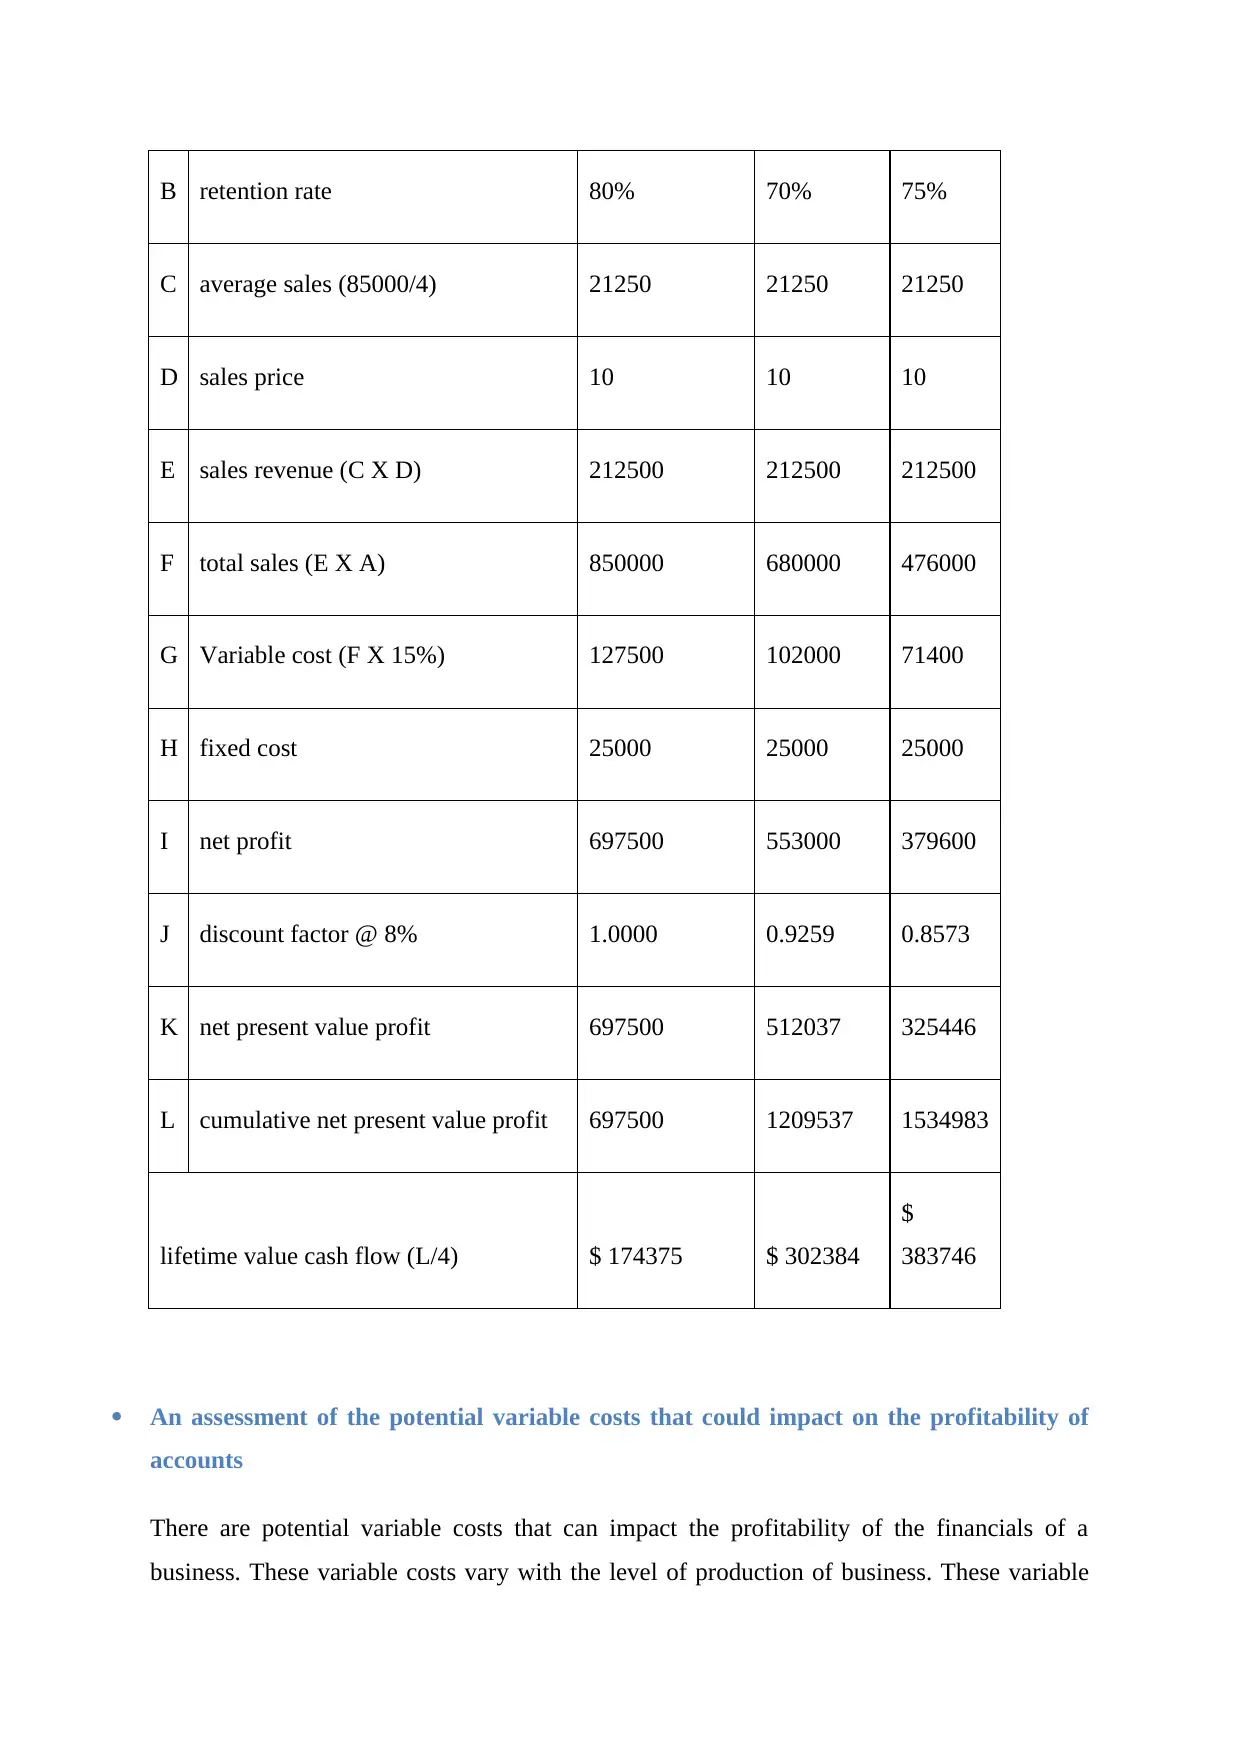
B retention rate 80% 70% 75%
C average sales (85000/4) 21250 21250 21250
D sales price 10 10 10
E sales revenue (C X D) 212500 212500 212500
F total sales (E X A) 850000 680000 476000
G Variable cost (F X 15%) 127500 102000 71400
H fixed cost 25000 25000 25000
I net profit 697500 553000 379600
J discount factor @ 8% 1.0000 0.9259 0.8573
K net present value profit 697500 512037 325446
L cumulative net present value profit 697500 1209537 1534983
lifetime value cash flow (L/4) $ 174375 $ 302384
$
383746
An assessment of the potential variable costs that could impact on the profitability of
accounts
There are potential variable costs that can impact the profitability of the financials of a
business. These variable costs vary with the level of production of business. These variable
Paraphrase This Document
Need a fresh take? Get an instant paraphrase of this document with our AI Paraphraser
costs can be expressed as a percentage of the sales of the business. The variable costs can be
used to better analyse the business performance. This could be done by framing a budget and
then comparing the actual business performance with the budgeted results (Libby, 2017).
Some of the popular examples of the variable costs are special costs of customer delivery,
management costs, packaging costs, the specialised marketing costs, the discount costs
related to the customers and the specialised marketing costs (Christopher, 2016).
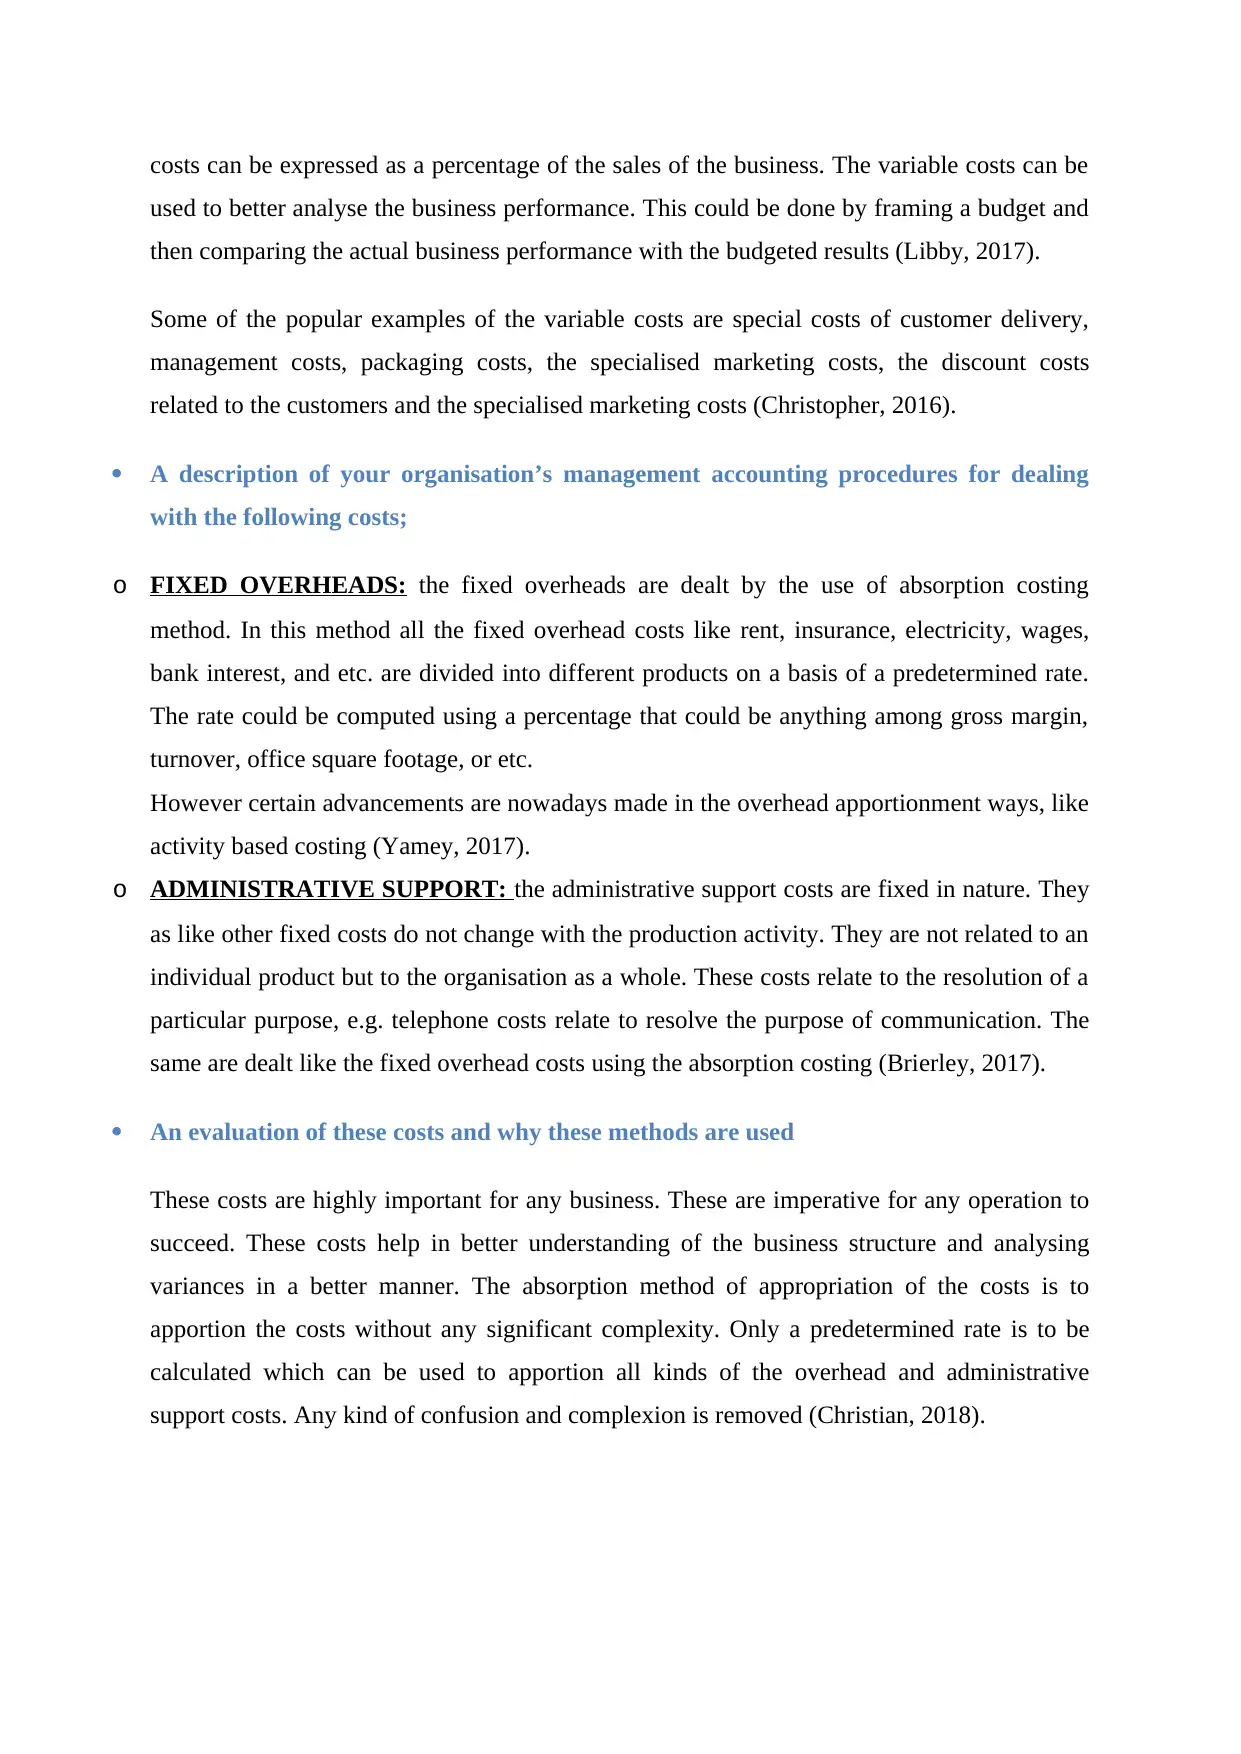
A description of your organisation’s management accounting procedures for dealing
with the following costs;
o FIXED OVERHEADS: the fixed overheads are dealt by the use of absorption costing
method. In this method all the fixed overhead costs like rent, insurance, electricity, wages,
bank interest, and etc. are divided into different products on a basis of a predetermined rate.
The rate could be computed using a percentage that could be anything among gross margin,
turnover, office square footage, or etc.
However certain advancements are nowadays made in the overhead apportionment ways, like
activity based costing (Yamey, 2017).
o ADMINISTRATIVE SUPPORT: the administrative support costs are fixed in nature. They
as like other fixed costs do not change with the production activity. They are not related to an
individual product but to the organisation as a whole. These costs relate to the resolution of a
particular purpose, e.g. telephone costs relate to resolve the purpose of communication. The
same are dealt like the fixed overhead costs using the absorption costing (Brierley, 2017).
An evaluation of these costs and why these methods are used
These costs are highly important for any business. These are imperative for any operation to
succeed. These costs help in better understanding of the business structure and analysing
variances in a better manner. The absorption method of appropriation of the costs is to
apportion the costs without any significant complexity. Only a predetermined rate is to be
calculated which can be used to apportion all kinds of the overhead and administrative
support costs. Any kind of confusion and complexion is removed (Christian, 2018).
used to better analyse the business performance. This could be done by framing a budget and
then comparing the actual business performance with the budgeted results (Libby, 2017).
Some of the popular examples of the variable costs are special costs of customer delivery,
management costs, packaging costs, the specialised marketing costs, the discount costs
related to the customers and the specialised marketing costs (Christopher, 2016).
A description of your organisation’s management accounting procedures for dealing
with the following costs;
o FIXED OVERHEADS: the fixed overheads are dealt by the use of absorption costing
method. In this method all the fixed overhead costs like rent, insurance, electricity, wages,
bank interest, and etc. are divided into different products on a basis of a predetermined rate.
The rate could be computed using a percentage that could be anything among gross margin,
turnover, office square footage, or etc.
However certain advancements are nowadays made in the overhead apportionment ways, like
activity based costing (Yamey, 2017).
o ADMINISTRATIVE SUPPORT: the administrative support costs are fixed in nature. They
as like other fixed costs do not change with the production activity. They are not related to an
individual product but to the organisation as a whole. These costs relate to the resolution of a
particular purpose, e.g. telephone costs relate to resolve the purpose of communication. The
same are dealt like the fixed overhead costs using the absorption costing (Brierley, 2017).
An evaluation of these costs and why these methods are used
These costs are highly important for any business. These are imperative for any operation to
succeed. These costs help in better understanding of the business structure and analysing
variances in a better manner. The absorption method of appropriation of the costs is to
apportion the costs without any significant complexity. Only a predetermined rate is to be
calculated which can be used to apportion all kinds of the overhead and administrative
support costs. Any kind of confusion and complexion is removed (Christian, 2018).
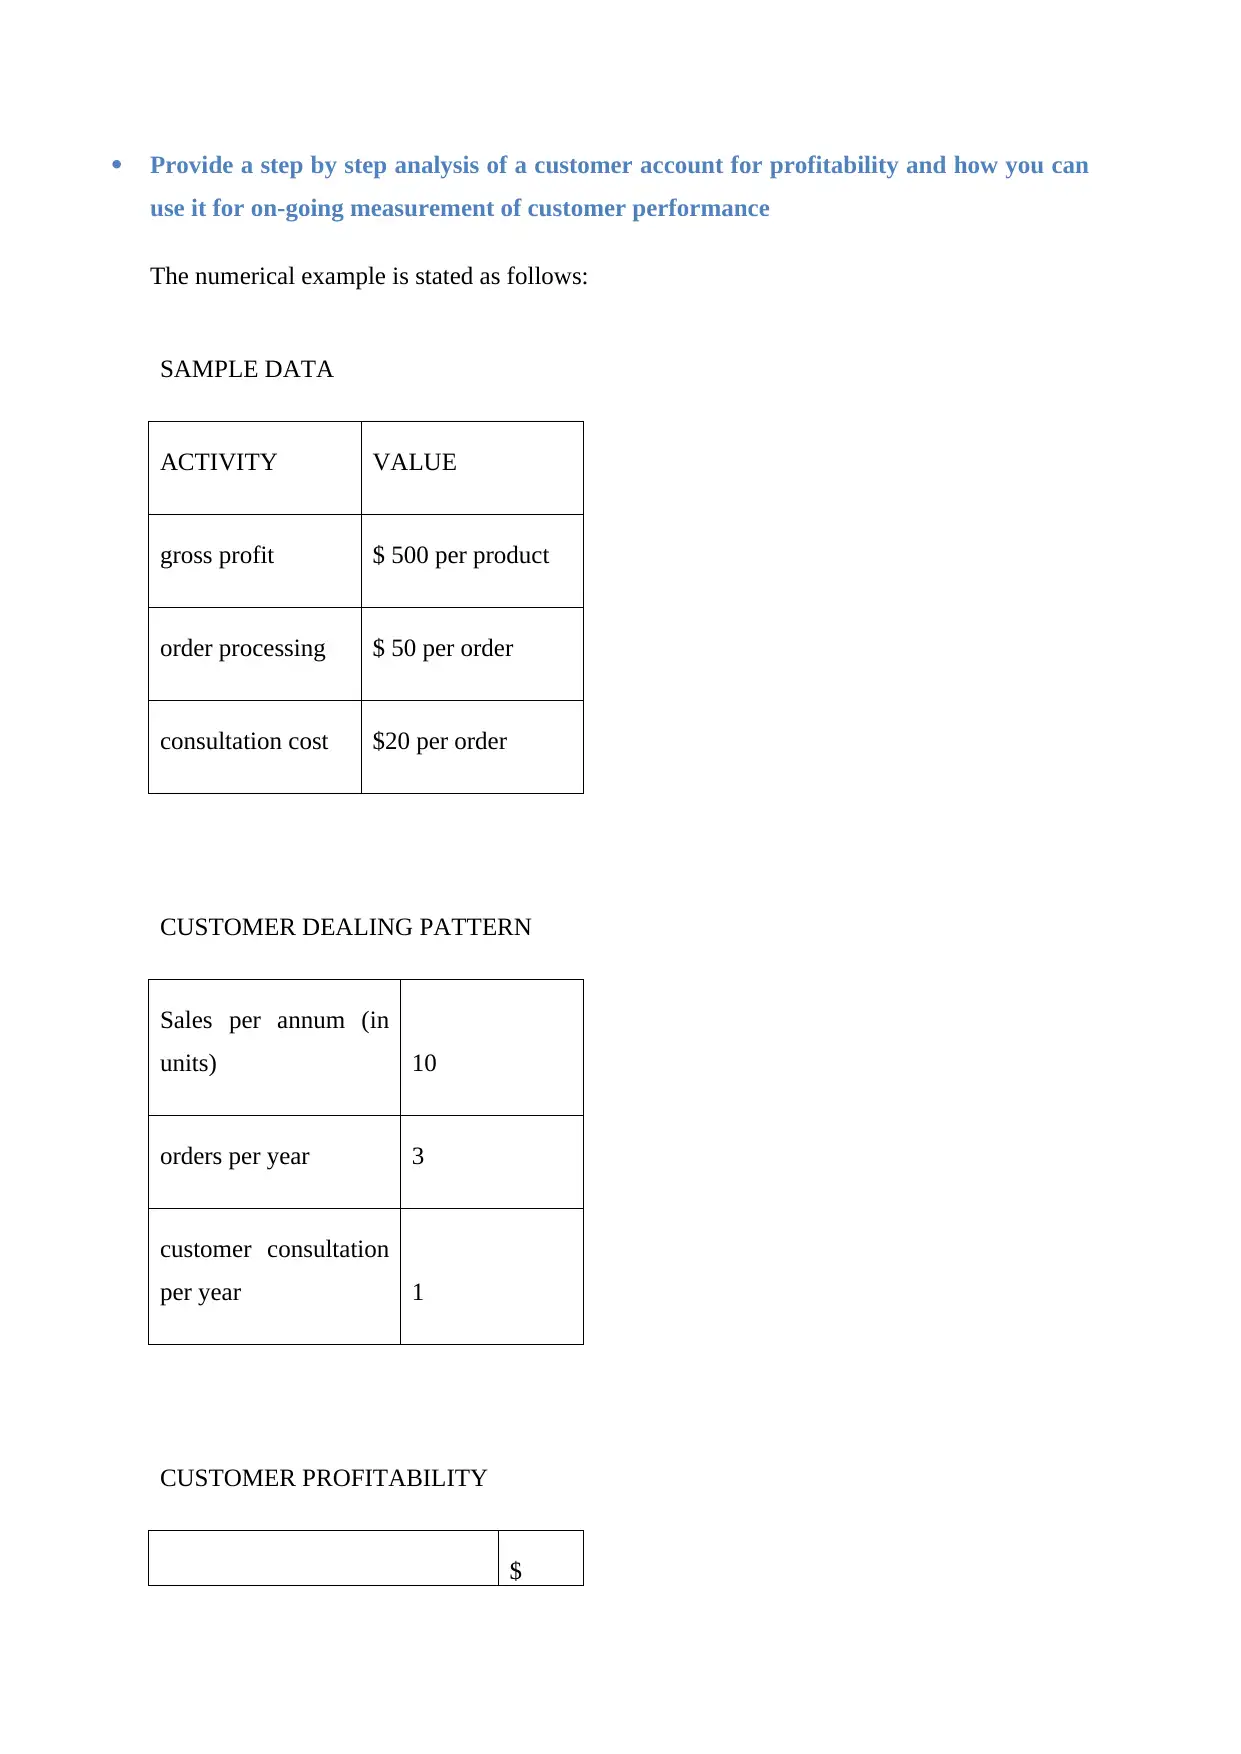
Provide a step by step analysis of a customer account for profitability and how you can
use it for on-going measurement of customer performance
The numerical example is stated as follows:
SAMPLE DATA
ACTIVITY VALUE
gross profit $ 500 per product
order processing $ 50 per order
consultation cost $20 per order
CUSTOMER DEALING PATTERN
Sales per annum (in
units) 10
orders per year 3
customer consultation
per year 1
CUSTOMER PROFITABILITY
$
⊘ This is a preview!⊘
Do you want full access?
Subscribe today to unlock all pages.
Trusted by 1+ million students worldwide
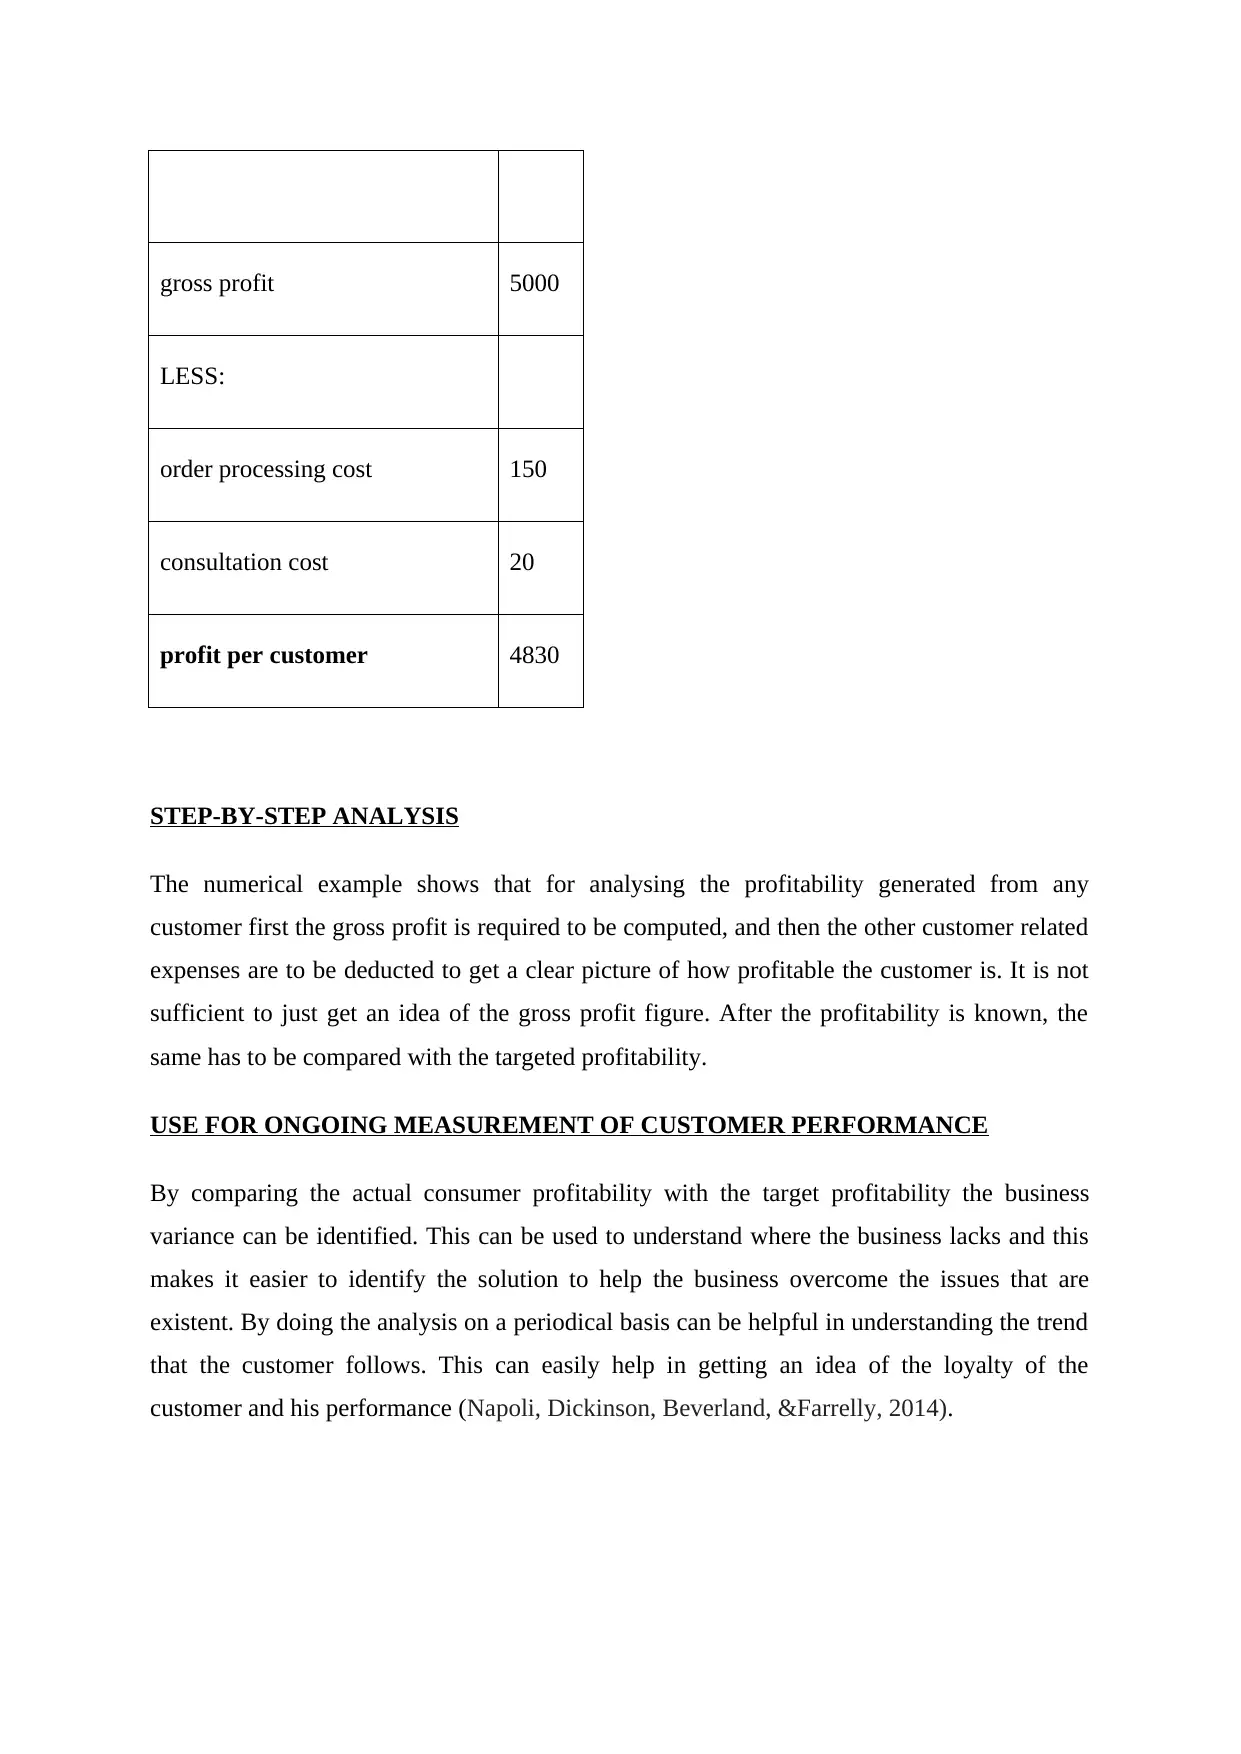
gross profit 5000
LESS:
order processing cost 150
consultation cost 20
profit per customer 4830
STEP-BY-STEP ANALYSIS
The numerical example shows that for analysing the profitability generated from any
customer first the gross profit is required to be computed, and then the other customer related
expenses are to be deducted to get a clear picture of how profitable the customer is. It is not
sufficient to just get an idea of the gross profit figure. After the profitability is known, the
same has to be compared with the targeted profitability.
USE FOR ONGOING MEASUREMENT OF CUSTOMER PERFORMANCE
By comparing the actual consumer profitability with the target profitability the business
variance can be identified. This can be used to understand where the business lacks and this
makes it easier to identify the solution to help the business overcome the issues that are
existent. By doing the analysis on a periodical basis can be helpful in understanding the trend
that the customer follows. This can easily help in getting an idea of the loyalty of the
customer and his performance (Napoli, Dickinson, Beverland, &Farrelly, 2014).
Paraphrase This Document
Need a fresh take? Get an instant paraphrase of this document with our AI Paraphraser
Task 2: Prepare a financial analysis report
The financial analysis report for the organisation is presented below and marked with
separate headings.
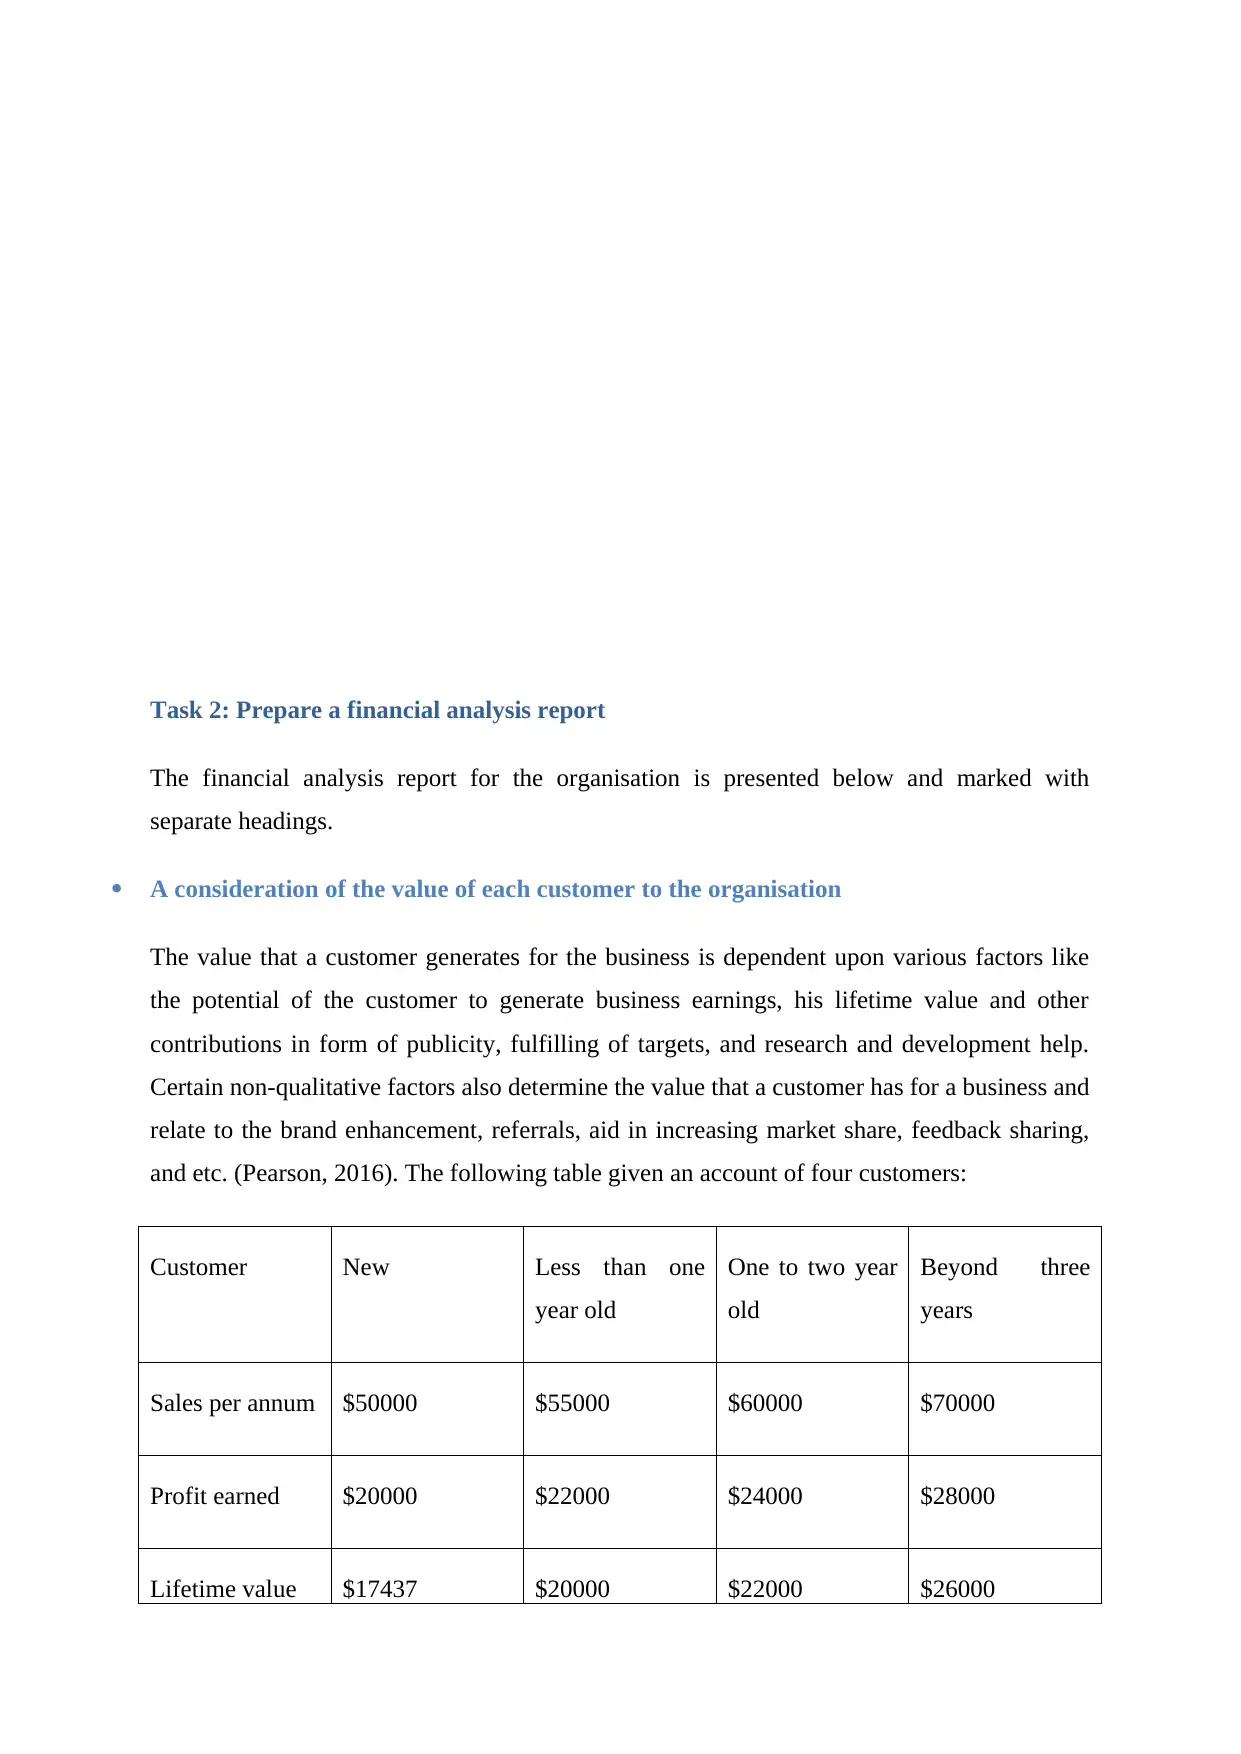
A consideration of the value of each customer to the organisation
The value that a customer generates for the business is dependent upon various factors like
the potential of the customer to generate business earnings, his lifetime value and other
contributions in form of publicity, fulfilling of targets, and research and development help.
Certain non-qualitative factors also determine the value that a customer has for a business and
relate to the brand enhancement, referrals, aid in increasing market share, feedback sharing,
and etc. (Pearson, 2016). The following table given an account of four customers:
Customer New Less than one
year old
One to two year
old
Beyond three
years
Sales per annum $50000 $55000 $60000 $70000
Profit earned $20000 $22000 $24000 $28000
Lifetime value $17437 $20000 $22000 $26000
The financial analysis report for the organisation is presented below and marked with
separate headings.
A consideration of the value of each customer to the organisation
The value that a customer generates for the business is dependent upon various factors like
the potential of the customer to generate business earnings, his lifetime value and other
contributions in form of publicity, fulfilling of targets, and research and development help.
Certain non-qualitative factors also determine the value that a customer has for a business and
relate to the brand enhancement, referrals, aid in increasing market share, feedback sharing,
and etc. (Pearson, 2016). The following table given an account of four customers:
Customer New Less than one
year old
One to two year
old
Beyond three
years
Sales per annum $50000 $55000 $60000 $70000
Profit earned $20000 $22000 $24000 $28000
Lifetime value $17437 $20000 $22000 $26000
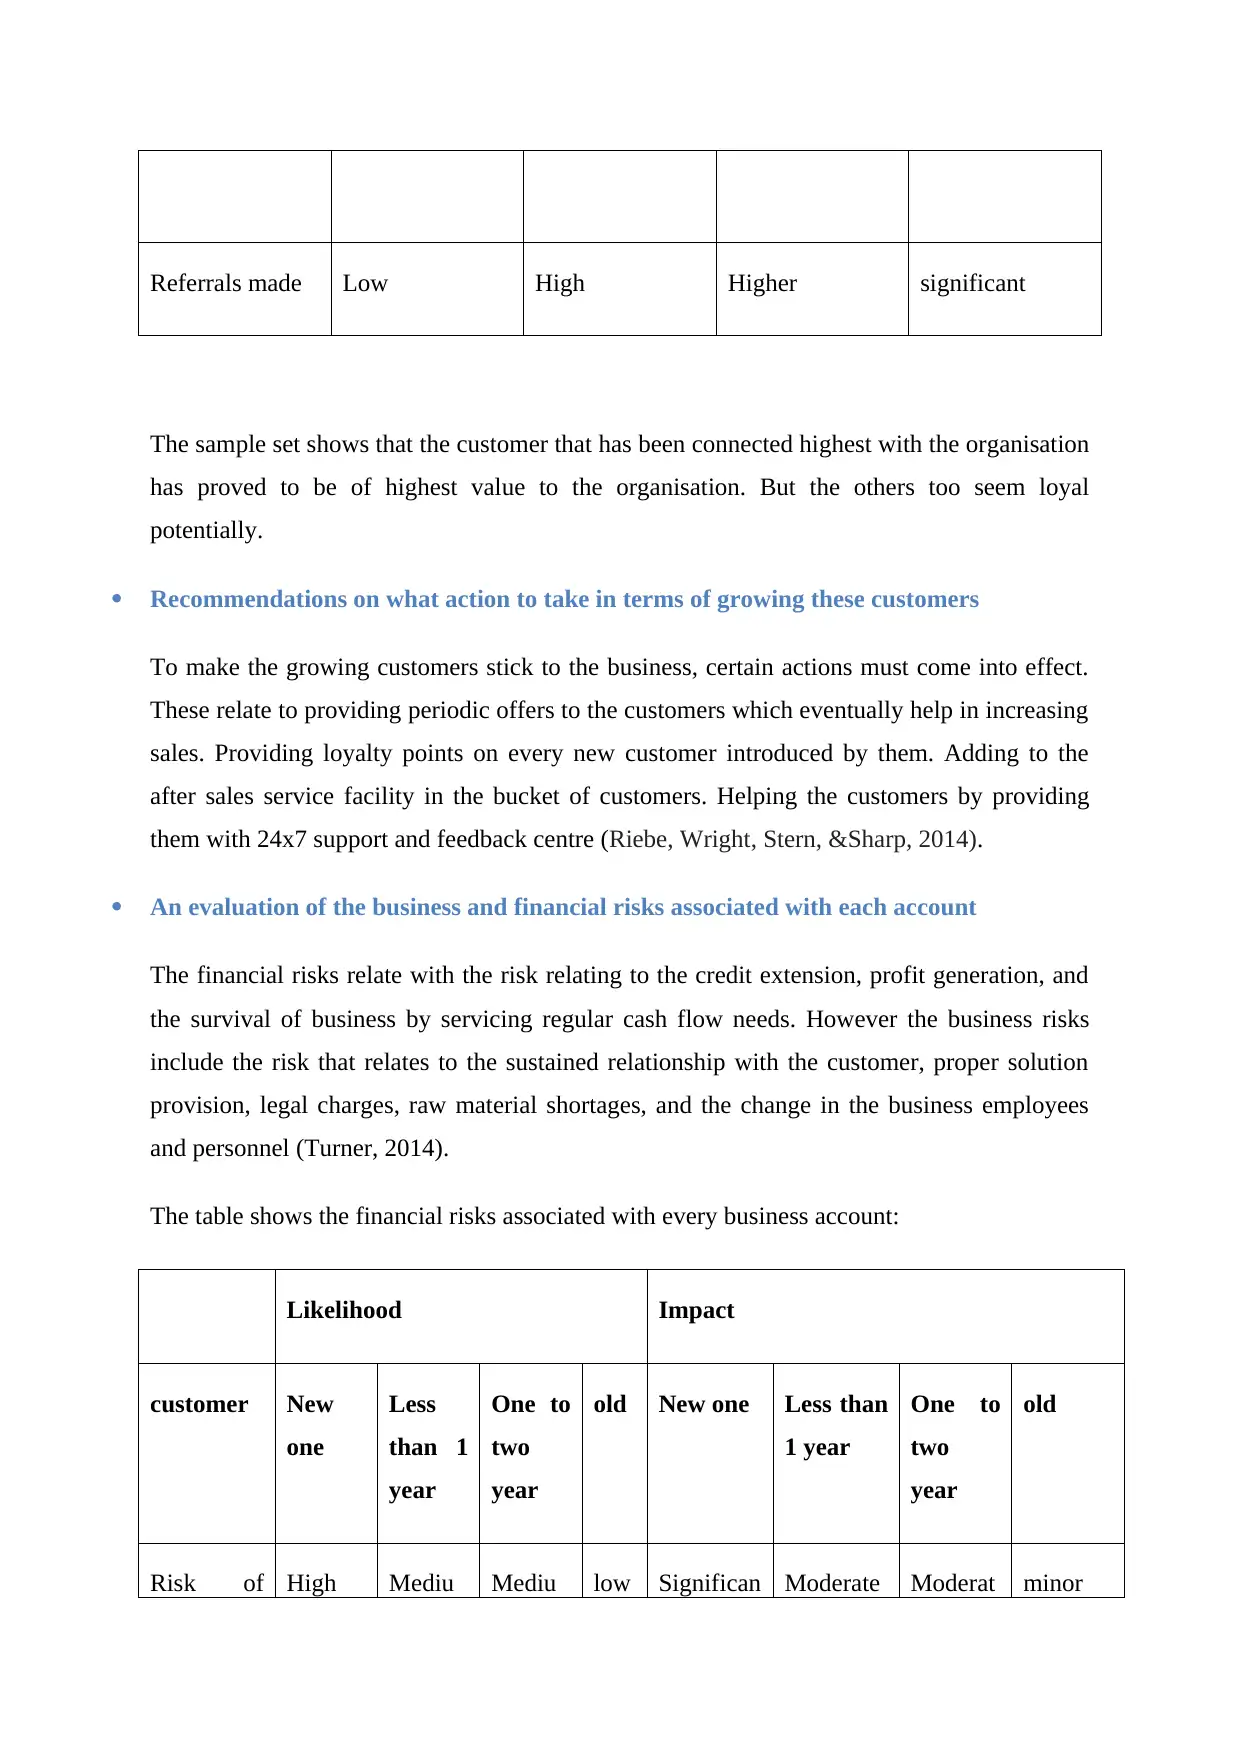
Referrals made Low High Higher significant
The sample set shows that the customer that has been connected highest with the organisation
has proved to be of highest value to the organisation. But the others too seem loyal
potentially.
Recommendations on what action to take in terms of growing these customers
To make the growing customers stick to the business, certain actions must come into effect.
These relate to providing periodic offers to the customers which eventually help in increasing
sales. Providing loyalty points on every new customer introduced by them. Adding to the
after sales service facility in the bucket of customers. Helping the customers by providing
them with 24x7 support and feedback centre (Riebe, Wright, Stern, &Sharp, 2014).
An evaluation of the business and financial risks associated with each account
The financial risks relate with the risk relating to the credit extension, profit generation, and
the survival of business by servicing regular cash flow needs. However the business risks
include the risk that relates to the sustained relationship with the customer, proper solution
provision, legal charges, raw material shortages, and the change in the business employees
and personnel (Turner, 2014).
The table shows the financial risks associated with every business account:
Likelihood Impact
customer New
one
Less
than 1
year
One to
two
year
old New one Less than
1 year
One to
two
year
old
Risk of High Mediu Mediu low Significan Moderate Moderat minor
⊘ This is a preview!⊘
Do you want full access?
Subscribe today to unlock all pages.
Trusted by 1+ million students worldwide
1 out of 17
Related Documents


Your All-in-One AI-Powered Toolkit for Academic Success.
+13062052269
info@desklib.com
Available 24*7 on WhatsApp / Email
![[object Object]](/_next/static/media/star-bottom.7253800d.svg)
Unlock your academic potential
Copyright © 2020–2026 A2Z Services. All Rights Reserved. Developed and managed by ZUCOL.