In-Depth Case Study: Customer Profitability and Transfer Pricing

Verified

Added on  2023/06/07

|9
|2263
|350
Case Study
AI Summary
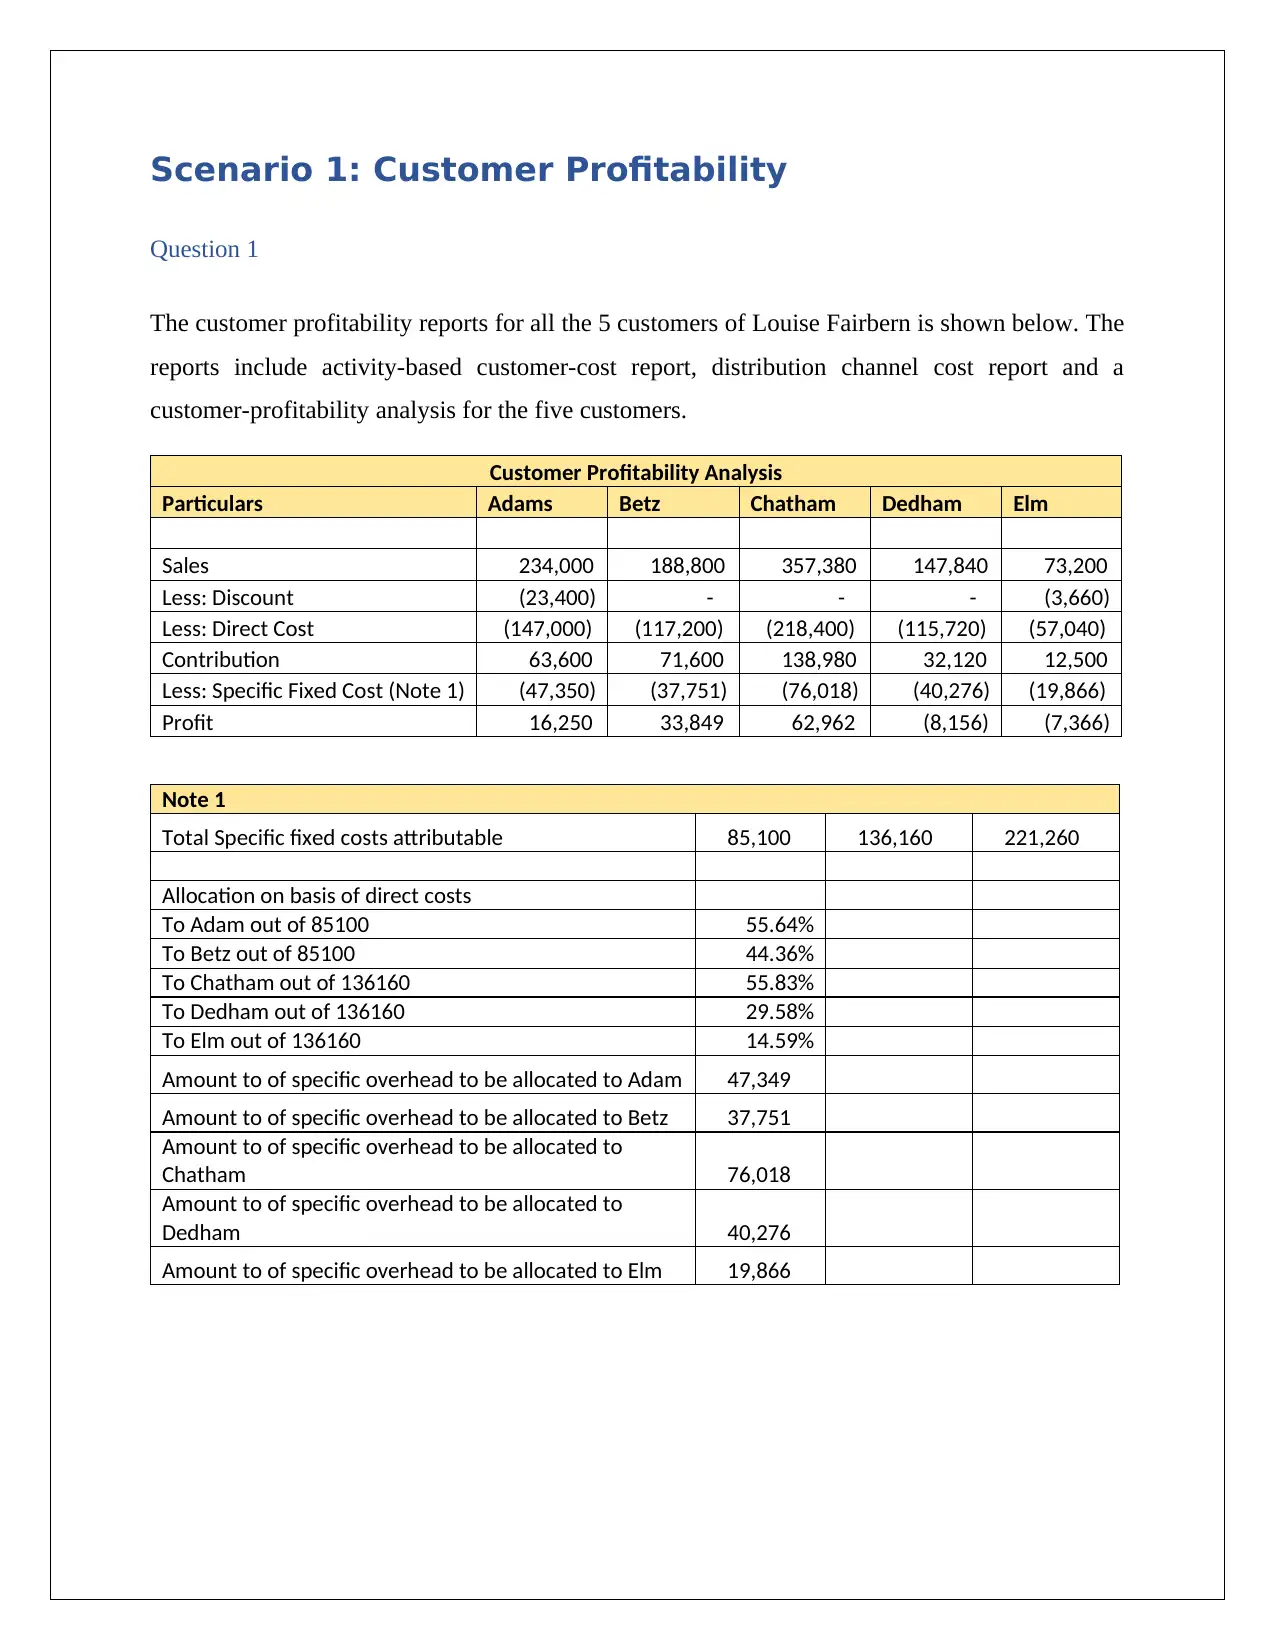
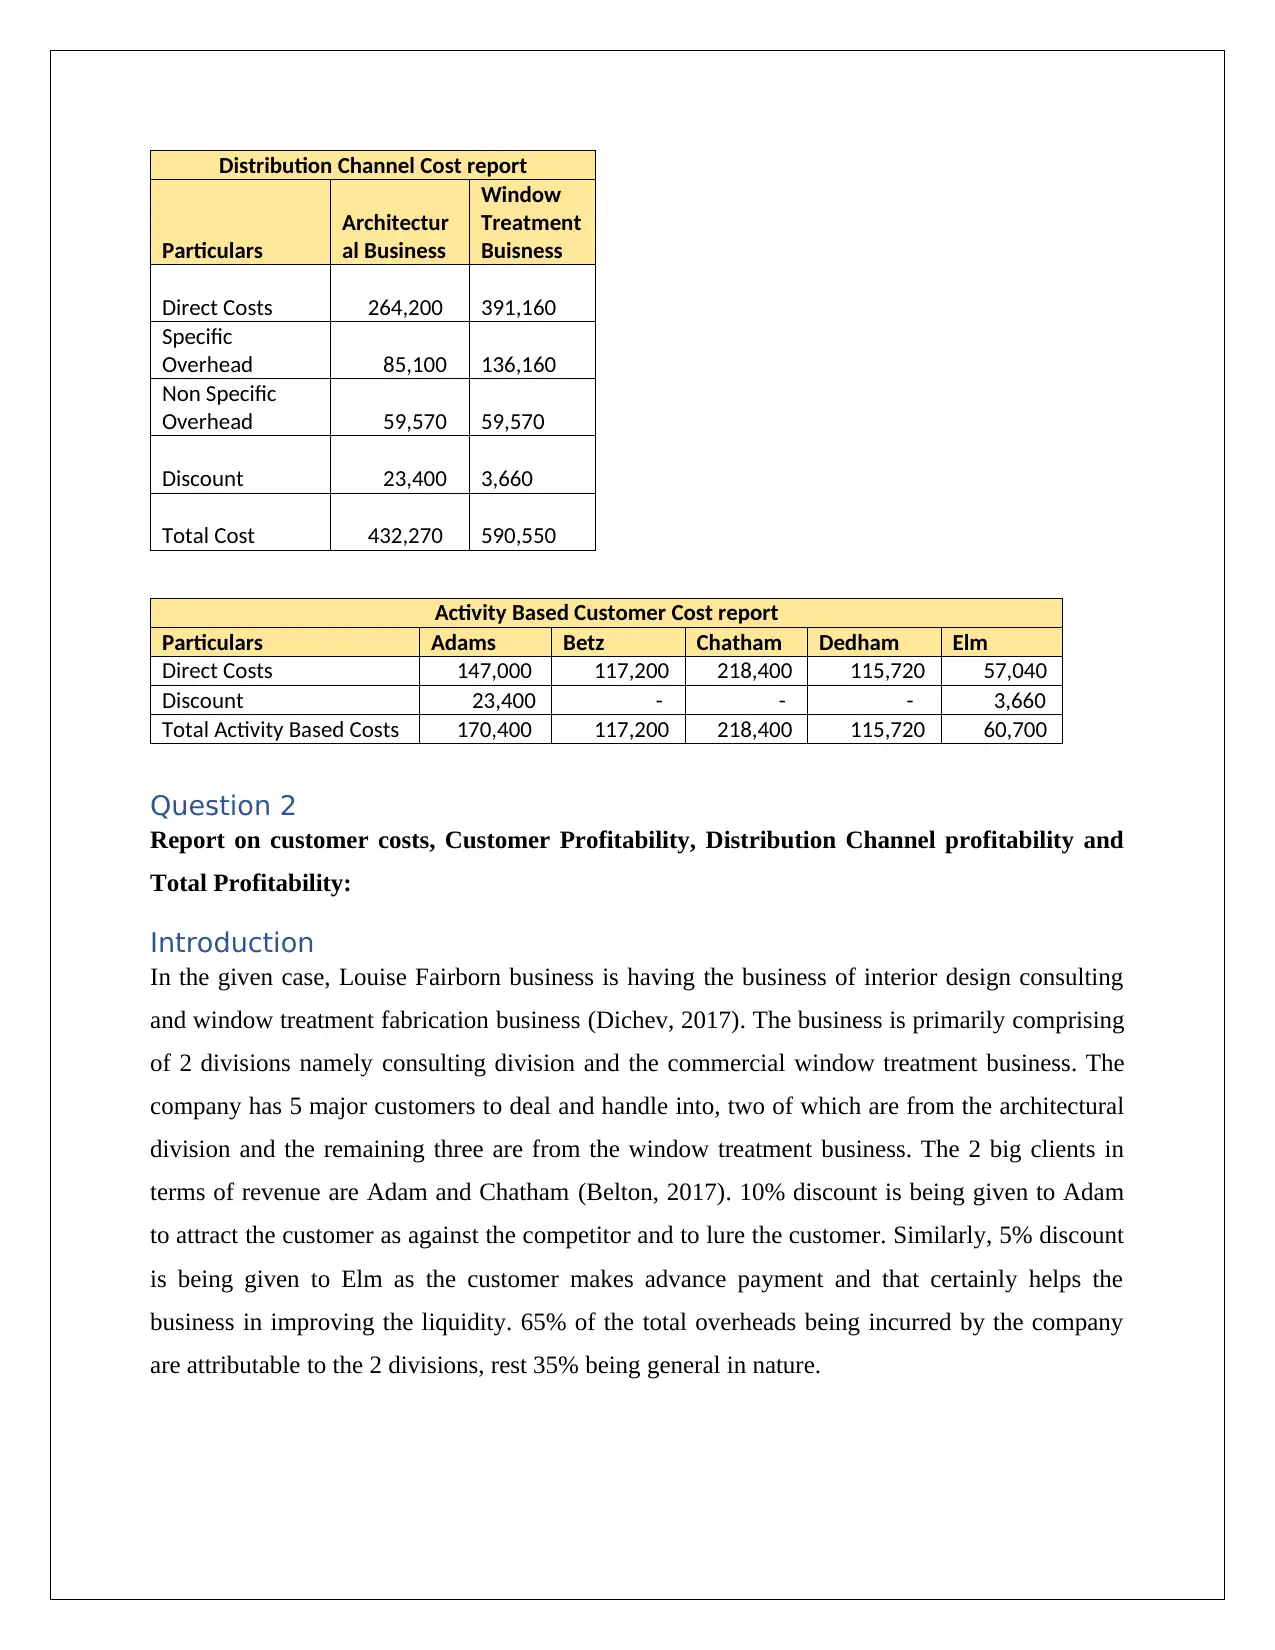
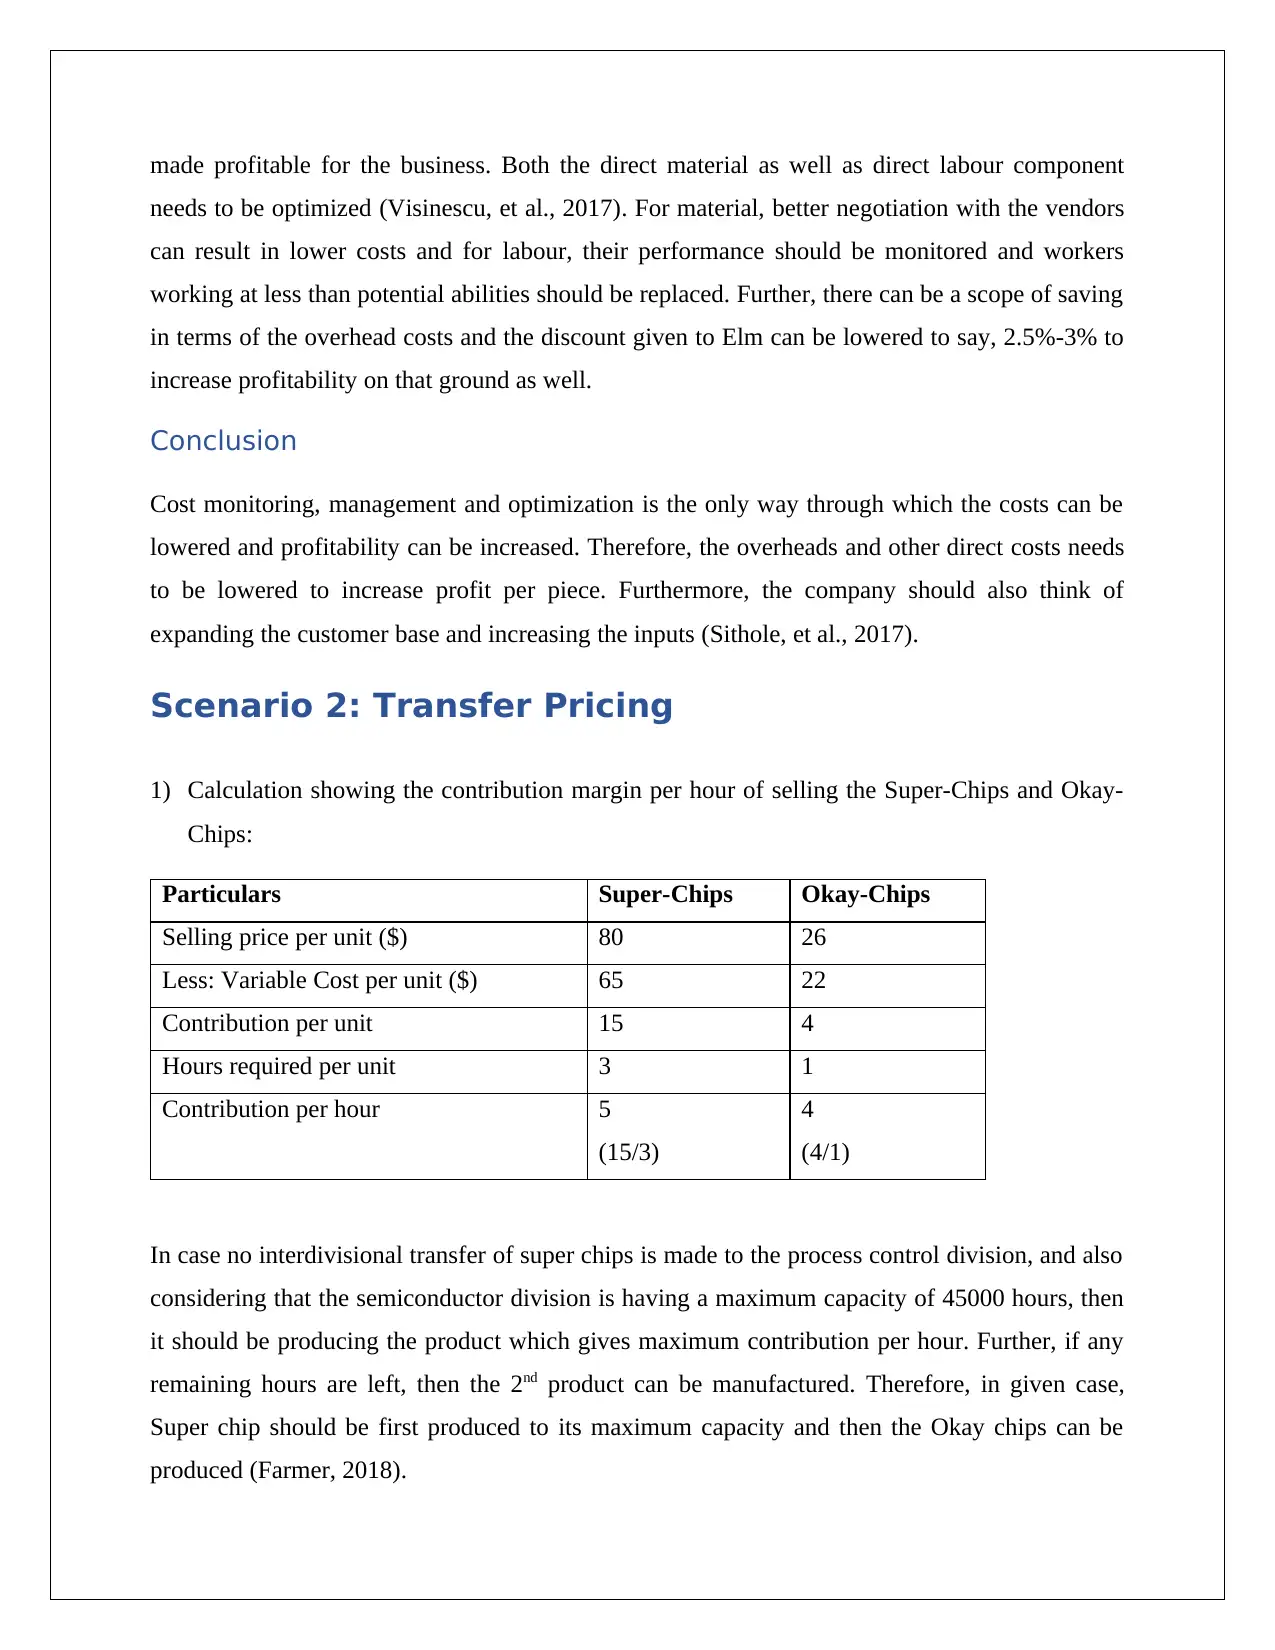
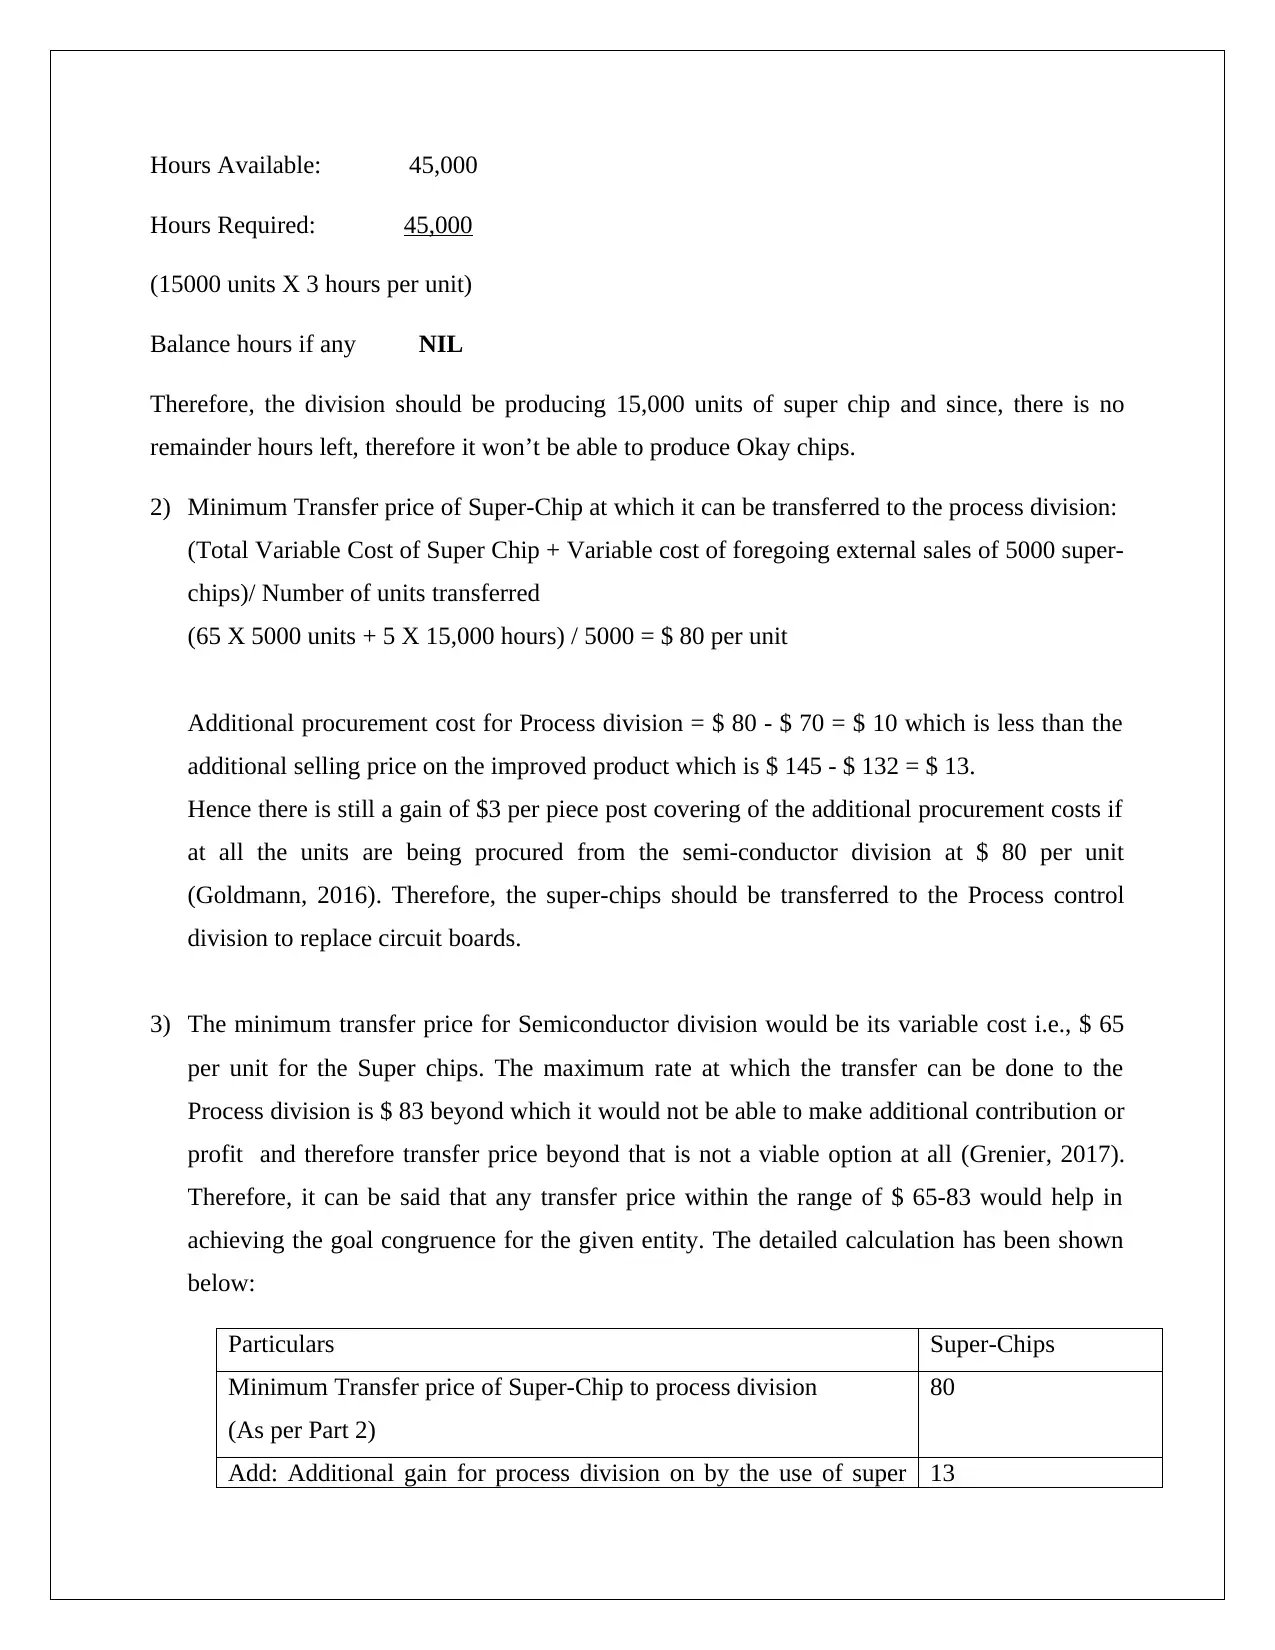
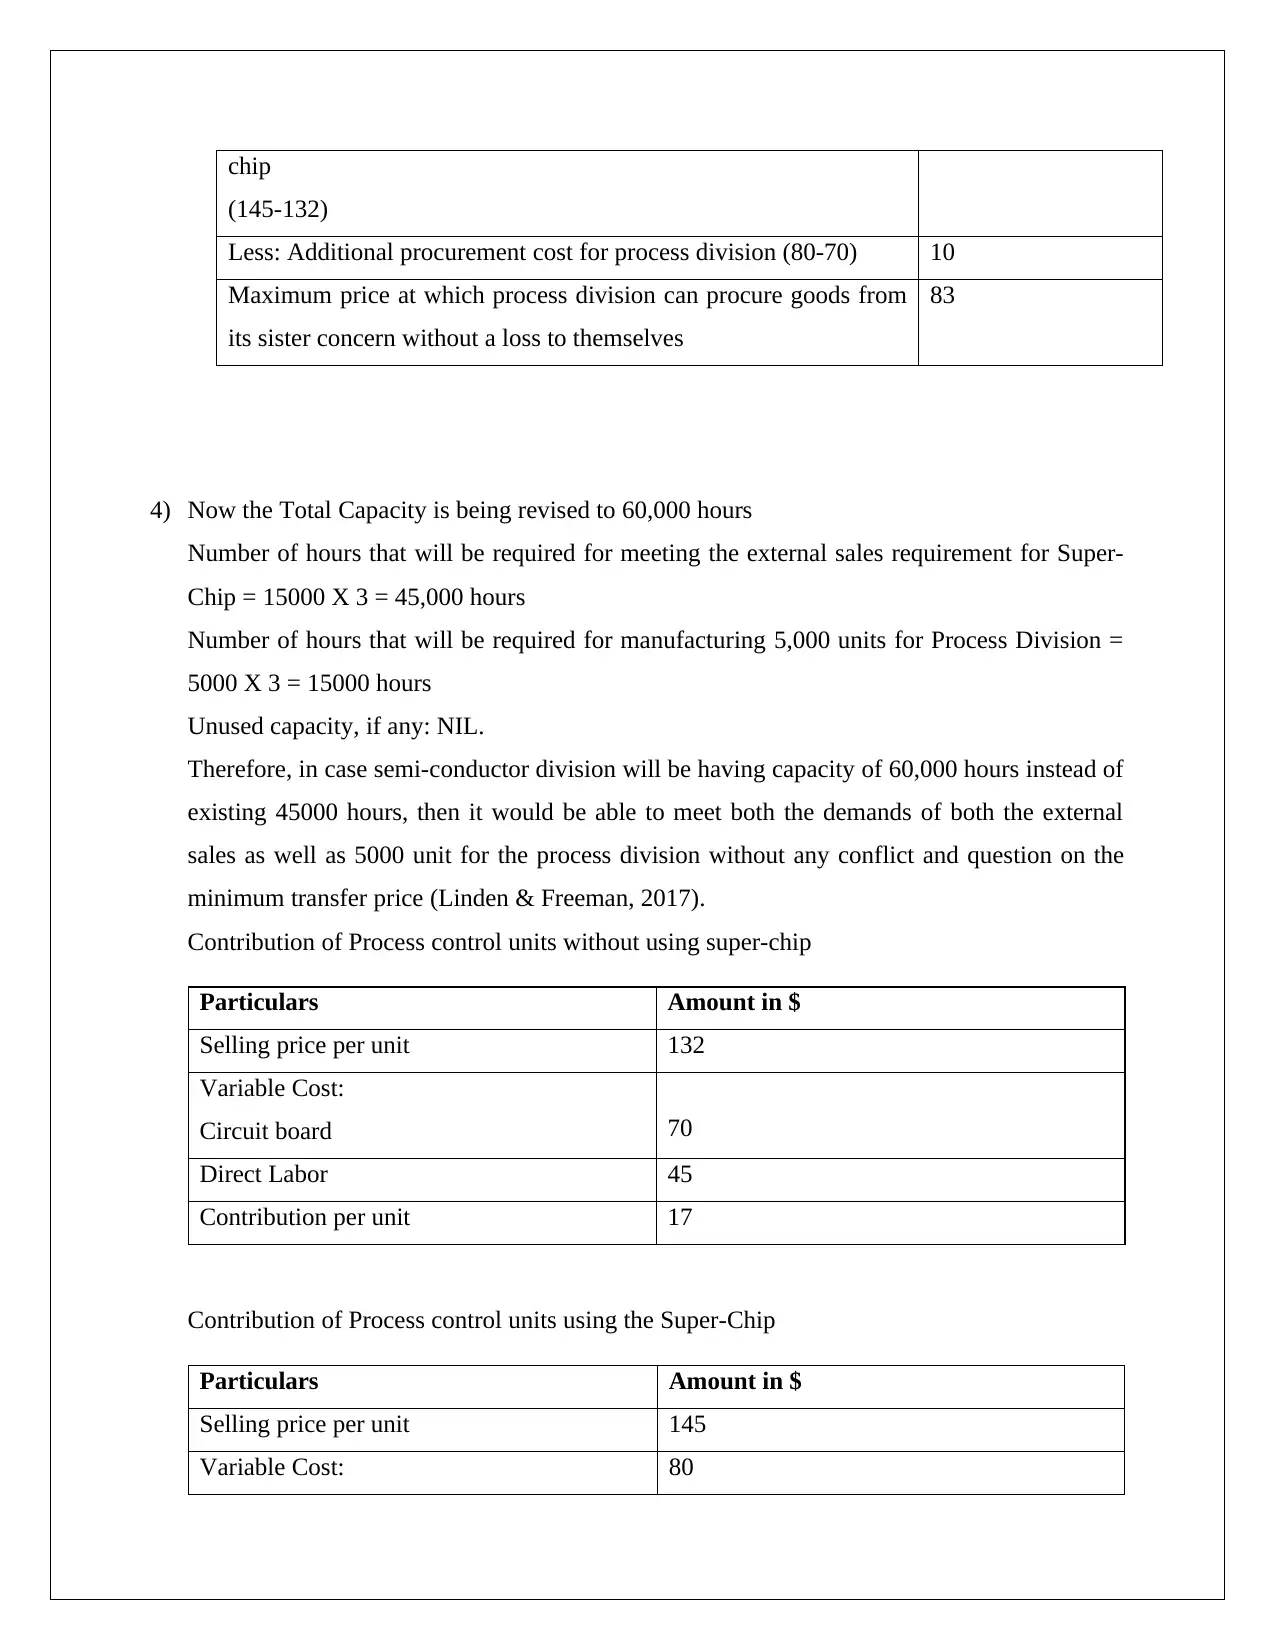
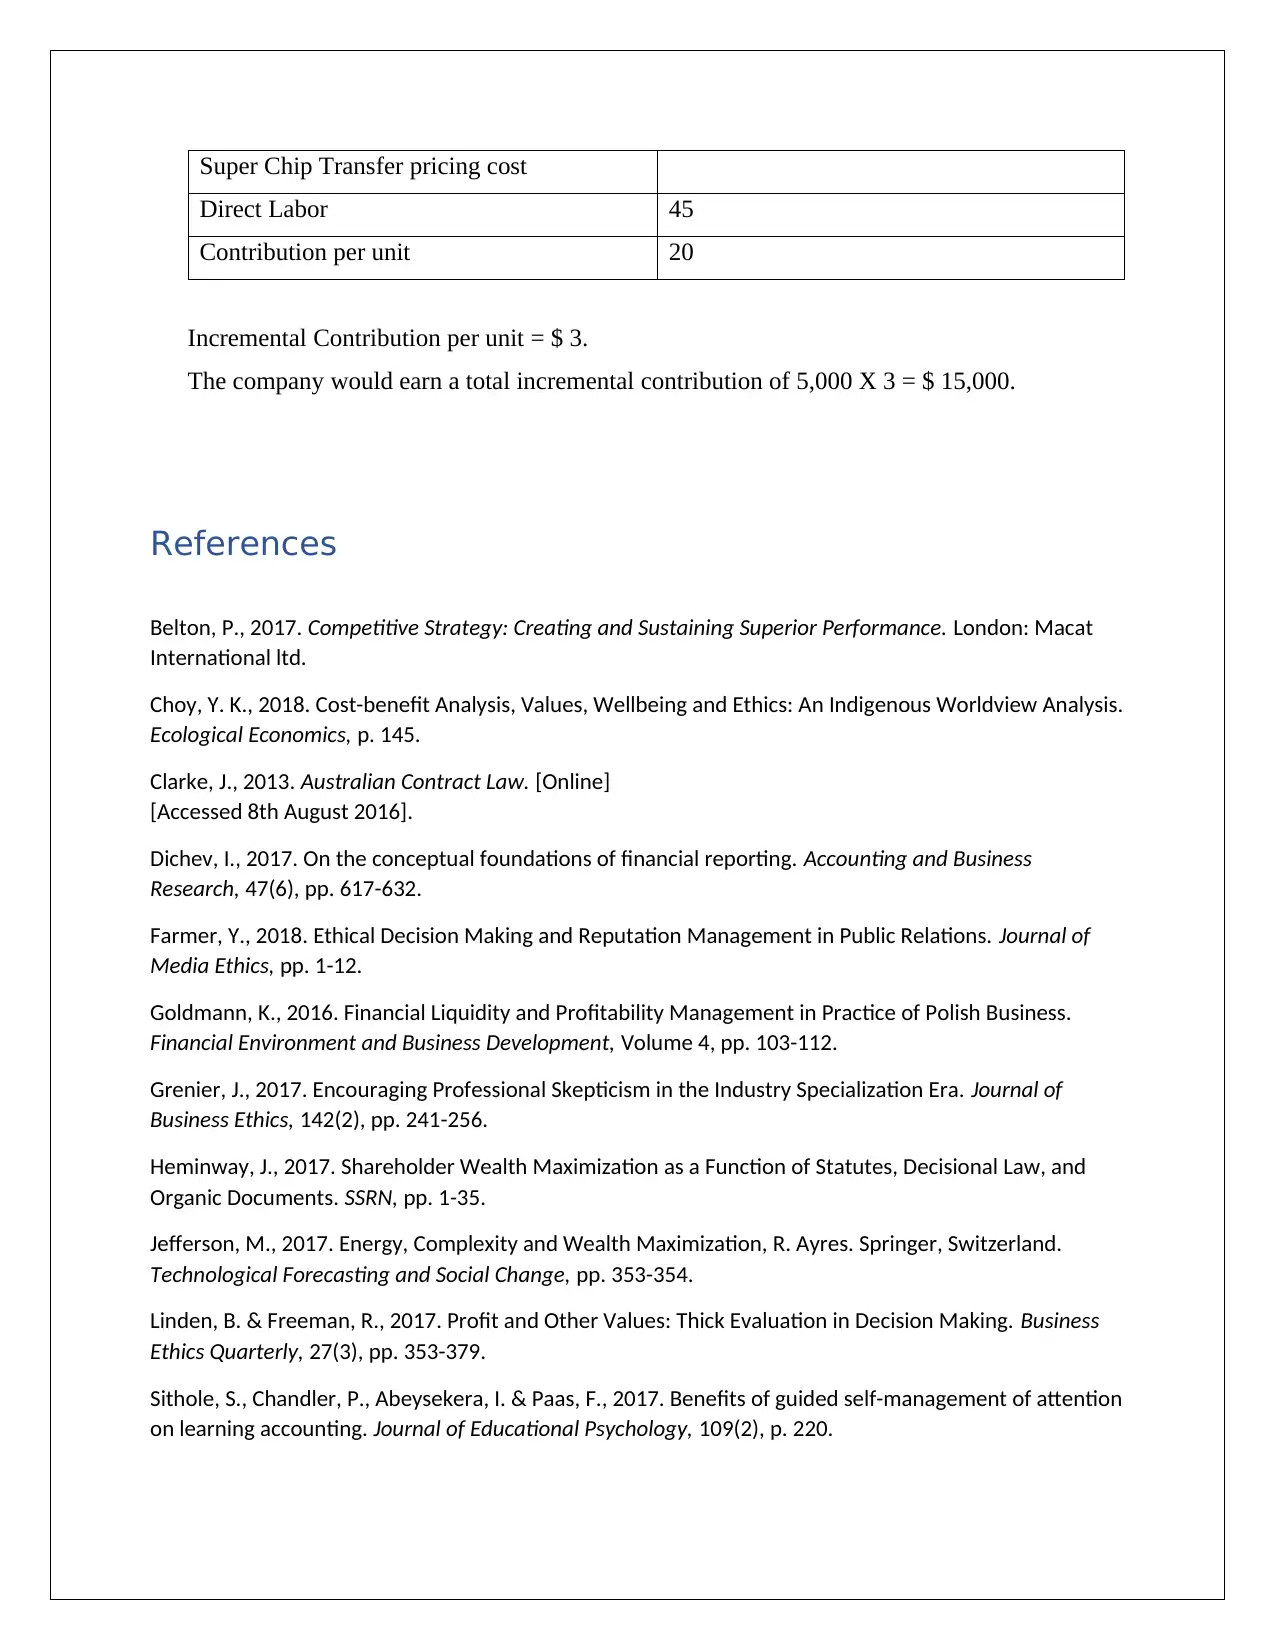
This case study provides a detailed analysis of customer profitability and transfer pricing within a business context. The first scenario focuses on evaluating the profitability of five different customers, considering factors like discounts, direct costs, and specific fixed costs. It highlights the importance of contribution margins and cost allocation in determining customer profitability, recommending cost optimization strategies to improve overall financial performance. The second scenario explores transfer pricing strategies between two divisions of a company, examining the impact of different transfer prices on divisional profitability and goal congruence. It includes calculations for minimum and maximum transfer prices, considering factors such as variable costs, external sales, and capacity constraints. Ultimately, the case study emphasizes the significance of effective cost management, strategic pricing decisions, and interdivisional coordination in achieving sustainable profitability and maximizing shareholder value. Desklib offers similar solved assignments and study tools for students.
Document Page
Table of Contents
Scenario 1: Customer Profitability..............................................................................................................2
Question 1...............................................................................................................................................2
Question 2...............................................................................................................................................3
Introduction.............................................................................................................................................3
Analysis:...................................................................................................................................................4
Recommendation....................................................................................................................................4
Conclusion...............................................................................................................................................5
Scenario 2: Transfer Pricing........................................................................................................................5
References...................................................................................................................................................8
tabler-icon-diamond-filled.svg

Paraphrase This Document

Need a fresh take? Get an instant paraphrase of this document with our AI Paraphraser
Document Page
Scenario 1: Customer Profitability
Question 1
The customer profitability reports for all the 5 customers of Louise Fairbern is shown below. The
reports include activity-based customer-cost report, distribution channel cost report and a
customer-profitability analysis for the five customers.
Customer Profitability Analysis
Particulars Adams Betz Chatham Dedham Elm
Sales 234,000 188,800 357,380 147,840 73,200
Less: Discount (23,400) - - - (3,660)
Less: Direct Cost (147,000) (117,200) (218,400) (115,720) (57,040)
Contribution 63,600 71,600 138,980 32,120 12,500
Less: Specific Fixed Cost (Note 1) (47,350) (37,751) (76,018) (40,276) (19,866)
Profit 16,250 33,849 62,962 (8,156) (7,366)
Note 1
Total Specific fixed costs attributable 85,100 136,160 221,260
Allocation on basis of direct costs
To Adam out of 85100 55.64%
To Betz out of 85100 44.36%
To Chatham out of 136160 55.83%
To Dedham out of 136160 29.58%
To Elm out of 136160 14.59%
Amount to of specific overhead to be allocated to Adam 47,349
Amount to of specific overhead to be allocated to Betz 37,751
Amount to of specific overhead to be allocated to
Chatham 76,018
Amount to of specific overhead to be allocated to
Dedham 40,276
Amount to of specific overhead to be allocated to Elm 19,866
Document Page
Distribution Channel Cost report
Particulars
Architectur
al Business
Window
Treatment
Buisness
Direct Costs 264,200 391,160
Specific
Overhead 85,100 136,160
Non Specific
Overhead 59,570 59,570
Discount 23,400 3,660
Total Cost 432,270 590,550
Activity Based Customer Cost report
Particulars Adams Betz Chatham Dedham Elm
Direct Costs 147,000 117,200 218,400 115,720 57,040
Discount 23,400 - - - 3,660
Total Activity Based Costs 170,400 117,200 218,400 115,720 60,700
Question 2
Report on customer costs, Customer Profitability, Distribution Channel profitability and
Total Profitability:
Introduction
In the given case, Louise Fairborn business is having the business of interior design consulting
and window treatment fabrication business (Dichev, 2017). The business is primarily comprising
of 2 divisions namely consulting division and the commercial window treatment business. The
company has 5 major customers to deal and handle into, two of which are from the architectural
division and the remaining three are from the window treatment business. The 2 big clients in
terms of revenue are Adam and Chatham (Belton, 2017). 10% discount is being given to Adam
to attract the customer as against the competitor and to lure the customer. Similarly, 5% discount
is being given to Elm as the customer makes advance payment and that certainly helps the
business in improving the liquidity. 65% of the total overheads being incurred by the company
are attributable to the 2 divisions, rest 35% being general in nature.
Document Page
Analysis:
Consulting Business Division: Here, the contribution margin for Betz is higher at 37.92% as
against Adam at 27.35%, inspite of the fact that Adam contributes more to revenue than Betz.
There can be various reasons for the same like offering of the special 10% discount on price to
Adam or there might be use of high grade material or manpower or more than usual direct costs
in order to retain the client as against the competitor which might have resulted in lower profits
(Heminway, 2017).
Commercial Window Treatment: In this particular division, the contribution margins for the 3
clients namely Chatham, Dedham and Elm has been 38.89%, 21.72% and 17.07% respectively.
We can see that the margin for Dedham and Elm is very low as compared to Chatham and the
main reason for the same is the allocation of the direct costs to each of these clients (Choy,
2018). The direct cost proportion for Dedham and Elm is 78.27% and 82.02% respectively
whereas for Chatham, the same is as low as 61.11%. Also, since the specific overhead is being
allocated to the customers on the basis of the direct costs, the share of Dedham and Elm is
abnormally high. In case the specific overheads to contribution percentage is being determined,
we can see that the ratio is 54.7%, 125.4% and 159% for Chatham, Dedham and Elm
respectively. This makes the rest of the two clients to be loss making for the company (Jefferson,
2017).
Recommendation
Consulting business Division: On an overall basis, the division has been doing well from the
company standpoint of view but the company needs to optimize and lower both the specific as
well as general overhead costs, only then the profitability can increase as the price cannot be
increased much in the competitive market (Clarke, 2013). It is because of these higher costs that
the company is not profitable inspite of higher contribution percentages. Some of the steps that
the company can take to increase profitability is outsourcing of the functions, relook at the
personnel staff salaries, reducing the administrative costs and fixed costs and greater emphasis
on performance based incentive rather than fixed incentive. This will also raise the performance
levels of the staff.
Commercial Window Treatment business: In case of this division, a greater emphasis and effort
is required to lower the costs in case of Dedham and Elm as only then these customers can be
tabler-icon-diamond-filled.svg

Paraphrase This Document

Need a fresh take? Get an instant paraphrase of this document with our AI Paraphraser
Document Page
made profitable for the business. Both the direct material as well as direct labour component
needs to be optimized (Visinescu, et al., 2017). For material, better negotiation with the vendors
can result in lower costs and for labour, their performance should be monitored and workers
working at less than potential abilities should be replaced. Further, there can be a scope of saving
in terms of the overhead costs and the discount given to Elm can be lowered to say, 2.5%-3% to
increase profitability on that ground as well.
Conclusion
Cost monitoring, management and optimization is the only way through which the costs can be
lowered and profitability can be increased. Therefore, the overheads and other direct costs needs
to be lowered to increase profit per piece. Furthermore, the company should also think of
expanding the customer base and increasing the inputs (Sithole, et al., 2017).
Scenario 2: Transfer Pricing
1) Calculation showing the contribution margin per hour of selling the Super-Chips and Okay-
Chips:
Particulars Super-Chips Okay-Chips
Selling price per unit ($) 80 26
Less: Variable Cost per unit ($) 65 22
Contribution per unit 15 4
Hours required per unit 3 1
Contribution per hour 5
(15/3)
4
(4/1)
In case no interdivisional transfer of super chips is made to the process control division, and also
considering that the semiconductor division is having a maximum capacity of 45000 hours, then
it should be producing the product which gives maximum contribution per hour. Further, if any
remaining hours are left, then the 2nd product can be manufactured. Therefore, in given case,
Super chip should be first produced to its maximum capacity and then the Okay chips can be
produced (Farmer, 2018).
Document Page
Hours Available: 45,000
Hours Required: 45,000
(15000 units X 3 hours per unit)
Balance hours if any NIL
Therefore, the division should be producing 15,000 units of super chip and since, there is no
remainder hours left, therefore it won’t be able to produce Okay chips.
2) Minimum Transfer price of Super-Chip at which it can be transferred to the process division:
(Total Variable Cost of Super Chip + Variable cost of foregoing external sales of 5000 super-
chips)/ Number of units transferred
(65 X 5000 units + 5 X 15,000 hours) / 5000 = $ 80 per unit
Additional procurement cost for Process division = $ 80 - $ 70 = $ 10 which is less than the
additional selling price on the improved product which is $ 145 - $ 132 = $ 13.
Hence there is still a gain of $3 per piece post covering of the additional procurement costs if
at all the units are being procured from the semi-conductor division at $ 80 per unit
(Goldmann, 2016). Therefore, the super-chips should be transferred to the Process control
division to replace circuit boards.
3) The minimum transfer price for Semiconductor division would be its variable cost i.e., $ 65
per unit for the Super chips. The maximum rate at which the transfer can be done to the
Process division is $ 83 beyond which it would not be able to make additional contribution or
profit and therefore transfer price beyond that is not a viable option at all (Grenier, 2017).
Therefore, it can be said that any transfer price within the range of $ 65-83 would help in
achieving the goal congruence for the given entity. The detailed calculation has been shown
below:
Particulars Super-Chips
Minimum Transfer price of Super-Chip to process division
(As per Part 2)
80
Add: Additional gain for process division on by the use of super 13
Document Page
chip
(145-132)
Less: Additional procurement cost for process division (80-70) 10
Maximum price at which process division can procure goods from
its sister concern without a loss to themselves
83
4) Now the Total Capacity is being revised to 60,000 hours
Number of hours that will be required for meeting the external sales requirement for Super-
Chip = 15000 X 3 = 45,000 hours
Number of hours that will be required for manufacturing 5,000 units for Process Division =
5000 X 3 = 15000 hours
Unused capacity, if any: NIL.
Therefore, in case semi-conductor division will be having capacity of 60,000 hours instead of
existing 45000 hours, then it would be able to meet both the demands of both the external
sales as well as 5000 unit for the process division without any conflict and question on the
minimum transfer price (Linden & Freeman, 2017).
Contribution of Process control units without using super-chip
Particulars Amount in $
Selling price per unit 132
Variable Cost:
Circuit board 70
Direct Labor 45
Contribution per unit 17
Contribution of Process control units using the Super-Chip
Particulars Amount in $
Selling price per unit 145
Variable Cost: 80
tabler-icon-diamond-filled.svg

Paraphrase This Document

Need a fresh take? Get an instant paraphrase of this document with our AI Paraphraser
Document Page
Super Chip Transfer pricing cost
Direct Labor 45
Contribution per unit 20
Incremental Contribution per unit = $ 3.
The company would earn a total incremental contribution of 5,000 X 3 = $ 15,000.
References
Belton, P., 2017. Competitive Strategy: Creating and Sustaining Superior Performance. London: Macat
International ltd.
Choy, Y. K., 2018. Cost-benefit Analysis, Values, Wellbeing and Ethics: An Indigenous Worldview Analysis.
Ecological Economics, p. 145.
Clarke, J., 2013. Australian Contract Law. [Online]
[Accessed 8th August 2016].
Dichev, I., 2017. On the conceptual foundations of financial reporting. Accounting and Business
Research, 47(6), pp. 617-632.
Farmer, Y., 2018. Ethical Decision Making and Reputation Management in Public Relations. Journal of
Media Ethics, pp. 1-12.
Goldmann, K., 2016. Financial Liquidity and Profitability Management in Practice of Polish Business.
Financial Environment and Business Development, Volume 4, pp. 103-112.
Grenier, J., 2017. Encouraging Professional Skepticism in the Industry Specialization Era. Journal of
Business Ethics, 142(2), pp. 241-256.
Heminway, J., 2017. Shareholder Wealth Maximization as a Function of Statutes, Decisional Law, and
Organic Documents. SSRN, pp. 1-35.
Jefferson, M., 2017. Energy, Complexity and Wealth Maximization, R. Ayres. Springer, Switzerland.
Technological Forecasting and Social Change, pp. 353-354.
Linden, B. & Freeman, R., 2017. Profit and Other Values: Thick Evaluation in Decision Making. Business
Ethics Quarterly, 27(3), pp. 353-379.
Sithole, S., Chandler, P., Abeysekera, I. & Paas, F., 2017. Benefits of guided self-management of attention
on learning accounting. Journal of Educational Psychology, 109(2), p. 220.
Document Page
Visinescu, L., Jones, M. & Sidorova, A., 2017. Improving Decision Quality: The Role of Business
Intelligence. Journal of Computer Information Systems, 57(1), pp. 58-66.
chevron_up_icon
1 out of 9
circle_padding
hide_on_mobile
zoom_out_icon
[object Object]