Foundations of Business Analysis: Customer Satisfaction Report
VerifiedAdded on 2021/09/09
|23
|4067
|150
Report
AI Summary
This report presents a business analysis of a departmental store, investigating the causes of poor performance attributed to competition from online retailers. The research employed online survey questionnaires to gather data, focusing on customer satisfaction levels. Statistical techniques, including linear regression, correlation analysis, and descriptive statistics, were used to analyze the data and test hypotheses. The findings revealed a gap between current customer satisfaction levels and management targets. The report recommends improvements such as providing shopping assistance, enabling price comparisons, and offering cashback incentives to enhance customer satisfaction and competitiveness. The report concludes by summarizing the statistical analyses and providing actionable recommendations to address the identified issues.
Running head: FOUNDATIONS OF BUSINESS ANALYSIS
1
Foundations of business analysis
Name of Student
Institutional Affiliation
Name of Professor
Date
1
Foundations of business analysis
Name of Student
Institutional Affiliation
Name of Professor
Date
Paraphrase This Document
Need a fresh take? Get an instant paraphrase of this document with our AI Paraphraser
FOUNDATIONS OF BUSINESS ANALYSIS
2
Foundations of business analysis
Executive summary
The report presents the research conducted that aims to address the causes of poor
performance in departmental stores that have made the organisation to lag in the market due to
the online retailers. The report relied on the online survey questionnaires to collect data from the
organisations database where the participants were sampled randomly. Through the formulation
of the hypothesis, the report sought to address the research questions using the tests for the
hypothesis. The techniques selected for testing the formulated hypotheses are the linear
regression analysis, correlation analysis, and the descriptive statistics. From the results, it is
evident that the current level of customer satisfaction does not reflect the managers’ goals and
targets of the customer satisfaction. The report recommends that the factors, which should be
implemented, are the provision for the shopping assistances, provision of the platforms for the
customers to compare the prices, and allowing the cashback for the customers among other
aspects as drafted in the recommendation section.

FOUNDATIONS OF BUSINESS ANALYSIS
3
TABLE OF CONTENTS
Introduction....................................................................................................................................5
The design of research...................................................................................................................6
Data sampling and collection....................................................................................................6
Hypothesis development................................................................................................................7
Research questions and the associated hypotheses.................................................................7
The selection of statistical techniques and justification.............................................................8
Results, statistical, and non-statistical interpretation..............................................................10
Descriptive statistics................................................................................................................10
A correlation between the Satisfactions of male customers.................................................12
Cluster plot...........................................................................................................................13
The impact of level of income on the customer satisfaction.................................................14
Examining the impact of age group on the customer satisfaction.......................................15
Examining the impact of the provision of shopping assistance to customer satisfaction..16
Examining the convenient return policy towards customer satisfaction............................17
Examining the impact of facilities pertaining to physical verification to customer
satisfaction................................................................................................................................18
The ability to compare prices in relation to customer satisfaction.....................................19
Impact of the ability of cashback and other facilities to customer satisfaction.................20
The summary of the statistical analyses and results.................................................................20
⊘ This is a preview!⊘
Do you want full access?
Subscribe today to unlock all pages.
Trusted by 1+ million students worldwide

FOUNDATIONS OF BUSINESS ANALYSIS
4
Recommendations........................................................................................................................21
References.....................................................................................................................................23
4
Recommendations........................................................................................................................21
References.....................................................................................................................................23
Paraphrase This Document
Need a fresh take? Get an instant paraphrase of this document with our AI Paraphraser
FOUNDATIONS OF BUSINESS ANALYSIS
5
Introduction
The foundations to success in any business organisation are centred to concepts and
practices that facilitate the customer satisfactions (Kumar and Reinartz, 2016, pp.36-68).
Mangers and the relevant leadership in different organisations have been reported to put in great
efforts to meet the customer demands. However, this has been pausing a great challenge due to
the dynamic consumer needs that have been changing from time to time. The organisations have
therefore reverted to lay in place the strategic practices that would oversee the satisfaction of
their clients as well as enable them to compete sustainably in the market. As a result, stiff
competition has been precipitated among the companies supplying similar products and services
via various means to their customers.
The report presents an analysis of an Australia department store, Myer and David Jones
enterprise that faces stiff competitors from the online retailers who are reported to be more
reliable and convenient to the consumers (Prebensen, Kim, and Uysal, 2016, pp.934-945). For
the departmental stores to level up in the market performance, the organisation conducts a
research study that would help it address the key areas that would enable quality performance
through customer satisfaction. The objective of the analysis is to identify the poor performing
areas in the service to the customers by considering their preferences that build on the
convenience to the service delivery. The analysis will also seek to address the challenges facing
the departmental stores over the online vendors and the ways of solving these problems through
effective decision making.

FOUNDATIONS OF BUSINESS ANALYSIS
6
The design of research
Data sampling and collection
The use of online questionnaires was deployed for collecting the responses from the
participants who were the customers to the organisation (Stoet, 2017, pp.24-31). The online
survey questionnaires were preferred due to the shorter time taken for collecting data from
different regions/ cities across the country. Additionally, the online survey is cost effective as
well as has lower chances of biases whereby the respondents are given the privilege to express
themselves without the sense of being judged by the interviewer as illustrated by (Brace, 2018).
These respondents were selected from the organisation’s database using the random sampling
techniques that was preferred over other techniques which is believed to cover a large
geographical data samples through the random selections.
However, the questions for the survey were precisely designed to address the research
questions and the hypothesis, which were brief and easy to understand (Rubsamen, Akmatov,
Castell, Karch, and Mikolajczyk, 2017, p.4). Ten questions that had interval answers that were
rated on a scale of 1 to 10 were used to ensure that the respondents use the minimal time to fill
the survey thus encouraging more participating. Through the random sampling techniques, 1000
respondents were selected where 400 completed the survey questions that were considered for
analysis. During the implementation of this method of data collection, the researcher observed
the ethics of research by protecting the privacy of the respondents (Sekaran and Bougie, 2016).
The structure of the questions identified the gender and the type of employment of the
respondents without provision of the names and identities. Additionally, the survey voluntarily
conducted where the respondents could opt out anytime they want without attaching any reasons
⊘ This is a preview!⊘
Do you want full access?
Subscribe today to unlock all pages.
Trusted by 1+ million students worldwide
FOUNDATIONS OF BUSINESS ANALYSIS
7
or explanation. The researcher further ensured the participants have understood the purpose of
collecting data, which was attributed to improving the quality of services for the consumers.
Hypothesis development
The establishment of the hypotheses is aimed at aiding the researcher to conduct a
relevant study in line to the research questions. This ensures that there is consistency and
relevance in the data collection and analysis that would lead to reliable results. According to
(O'Sullivan, Berner, Taliaferro, and Rassel, 2016), the hypotheses also ensure that the researcher
does not go out of the scope of the research problems as outlined by. The following are the
research questions and their associated hypotheses, both null and alternative that were developed.
Research questions and the associated hypotheses
I. What are some of the reasons for poor performance reported among the departmental
stores in the recent years in Australia?
The following hypothesis focusses on the above research question
A. The null hypothesis (H0) is that the existing level of satisfaction is similar to the
target of the management that is the score above seven whereas the alternate hypothesis (HA)
states that the existing level of customer satisfcation is not similar to the target of the
management which is the score above seven.
B. The null hypothesis states that the overall customer satisfaction are different
between the female and the male customers while the alternative hypothesis states that the
overall customer satisfaction are not different between the female and the male customers.
Paraphrase This Document
Need a fresh take? Get an instant paraphrase of this document with our AI Paraphraser
FOUNDATIONS OF BUSINESS ANALYSIS
8
C. The null hypothesis states that the amount of income has an influence on the
overall customer satisfcation while the alternative hypothesis states that the amount of
income has no influence on the overall customer satisfcation while the alternative.
D. The null hypothesis states that there exists differences in satisfcation of customers
basing on the age groups while the alternative hypothesis states that there exists no
differences in satisfcation of customers basing on the age groups.
II. How could the departmental stores compete their online competitors?
The focus on this research question is based on the following hypothesis.
E. The null hypothesis states customer satisfaction is determined by the effective
policies of return, provision of assistance during products purchase, the platform for
comparing the prices, facilitating verification of products through physical provisions, and
allowing cashbacks for the customers. However, the alternative hypothesis states that the
customer satisfaction is not determined by the effective policies of return, provision of
assistance during products purchase, the platform for comparing the prices, facilitating
verification of products through physical provisions, and allowing cashbacks for the
customers
The selection of statistical techniques and justification
The report presents different statistical techniques that were used in the testing of the
hypothesis. The selection of the tools was determined by the nature of the expected/ anticipated
outputs and the relationship to be determined between different variables.
To test the first hypothesis, the use of descriptive analysis will be used to determine the
inferences between the data samples (Zook and Pearce, 2017, pp.43-71). The frequency
FOUNDATIONS OF BUSINESS ANALYSIS
9
distribution of the two set of the scores will be established whereby the first set will be all the
scores that range between one and six while the second set will be the scores that range between
seven and ten for customer satisfaction. By using this technique, it will be possible to determine
whether the hypothesis is true or false through the frequency distribution. Additionally, using the
descriptive statistics technique will enable the determination of the mean and the standard
deviation of the scores for the two classes identified in the hypothesis. This will provide an easier
way to justify if the organisation has achieved the customer satisfaction goals.
However, the use of correlation technique and scatter plots will be used to determine the
differences in satisfaction of the male and the female customers in the second hypothesis. The
data will be arranged in two sets for the male and female customers whereby a correlation test
will be run to establish the relationship in the satisfaction for the two sets of data. The correlation
coefficient R will illustrate the strength of the correlation in the data sets, which range between -
1 and 1 as illustrated by (Darlington and Hayes, 2016). When the range lies within the
boundaries of one within this range, it will depict that there is no differences in satisfaction of the
female and the male customers since the variables are strongly correlated towards the positives.
When the correlation coefficient does not lie within the one boundaries, it would imply that the
variables have no correlation thus indicating that there is a difference in the satisfaction of the
male and the female customers.
In the third and fourth hypotheses, the use of regression analysis will be deployed in the
efforts to determine the rate of income and the age factor relate to the satisfaction of the
customers. The regression analysis will be carried out independently for determining the
existence of the relationship between the customer satisfaction and these variables. The
regression output will establish the relation between the sets of data that would be vital for
⊘ This is a preview!⊘
Do you want full access?
Subscribe today to unlock all pages.
Trusted by 1+ million students worldwide
FOUNDATIONS OF BUSINESS ANALYSIS
10
drawing the conclusions concerning theses hypotheses. The Multiple R coefficient will be used
to determine how the trends in the data sets are related on a scale of zero to one. If the coefficient
is one, it implies the independent and the dependent variables have a relationship while the zero
output will indicate there is no relationship between the variables. Additionally, the evaluation
using the evaluation of the P-value, the probability of existence of a correlation between the sets
of data determined with the aid of the significance value F. During the analysis using these
techniques, when the P-value and the significant value F are high, it implies that the values of the
dependent variable can be altered or predicted with the changes in the independent variable. This
would imply the customer satisfaction is dependent on the age factor and the level of
employment among the consumers.
Additionally, the fifth hypothesis can be verified using the regression analysis to draw the
existence of a relationship between the variables such as the shopping assistance, return policies,
on-site verification of products, the ability to compare prices, and cashbacks in relation to
customer satisfaction. This technique can be justified due to its simplicity in the analysis of bulk
data within a short time. The explanation to the output of this technique is provided in analysis of
third and fourth hypotheses.
Results, statistical, and non-statistical interpretation
Descriptive statistics
To determine whether the organisation has achieved the overall satisfaction goals, the
data was sorted into two categories where the frequencies of each data set was recorded as shown
below. The range of 7-10 was considered as the met goals by the management of customer
satisfaction while the range from 1-6 indicated that the customer satisfaction do not meet the set
Paraphrase This Document
Need a fresh take? Get an instant paraphrase of this document with our AI Paraphraser
FOUNDATIONS OF BUSINESS ANALYSIS
11
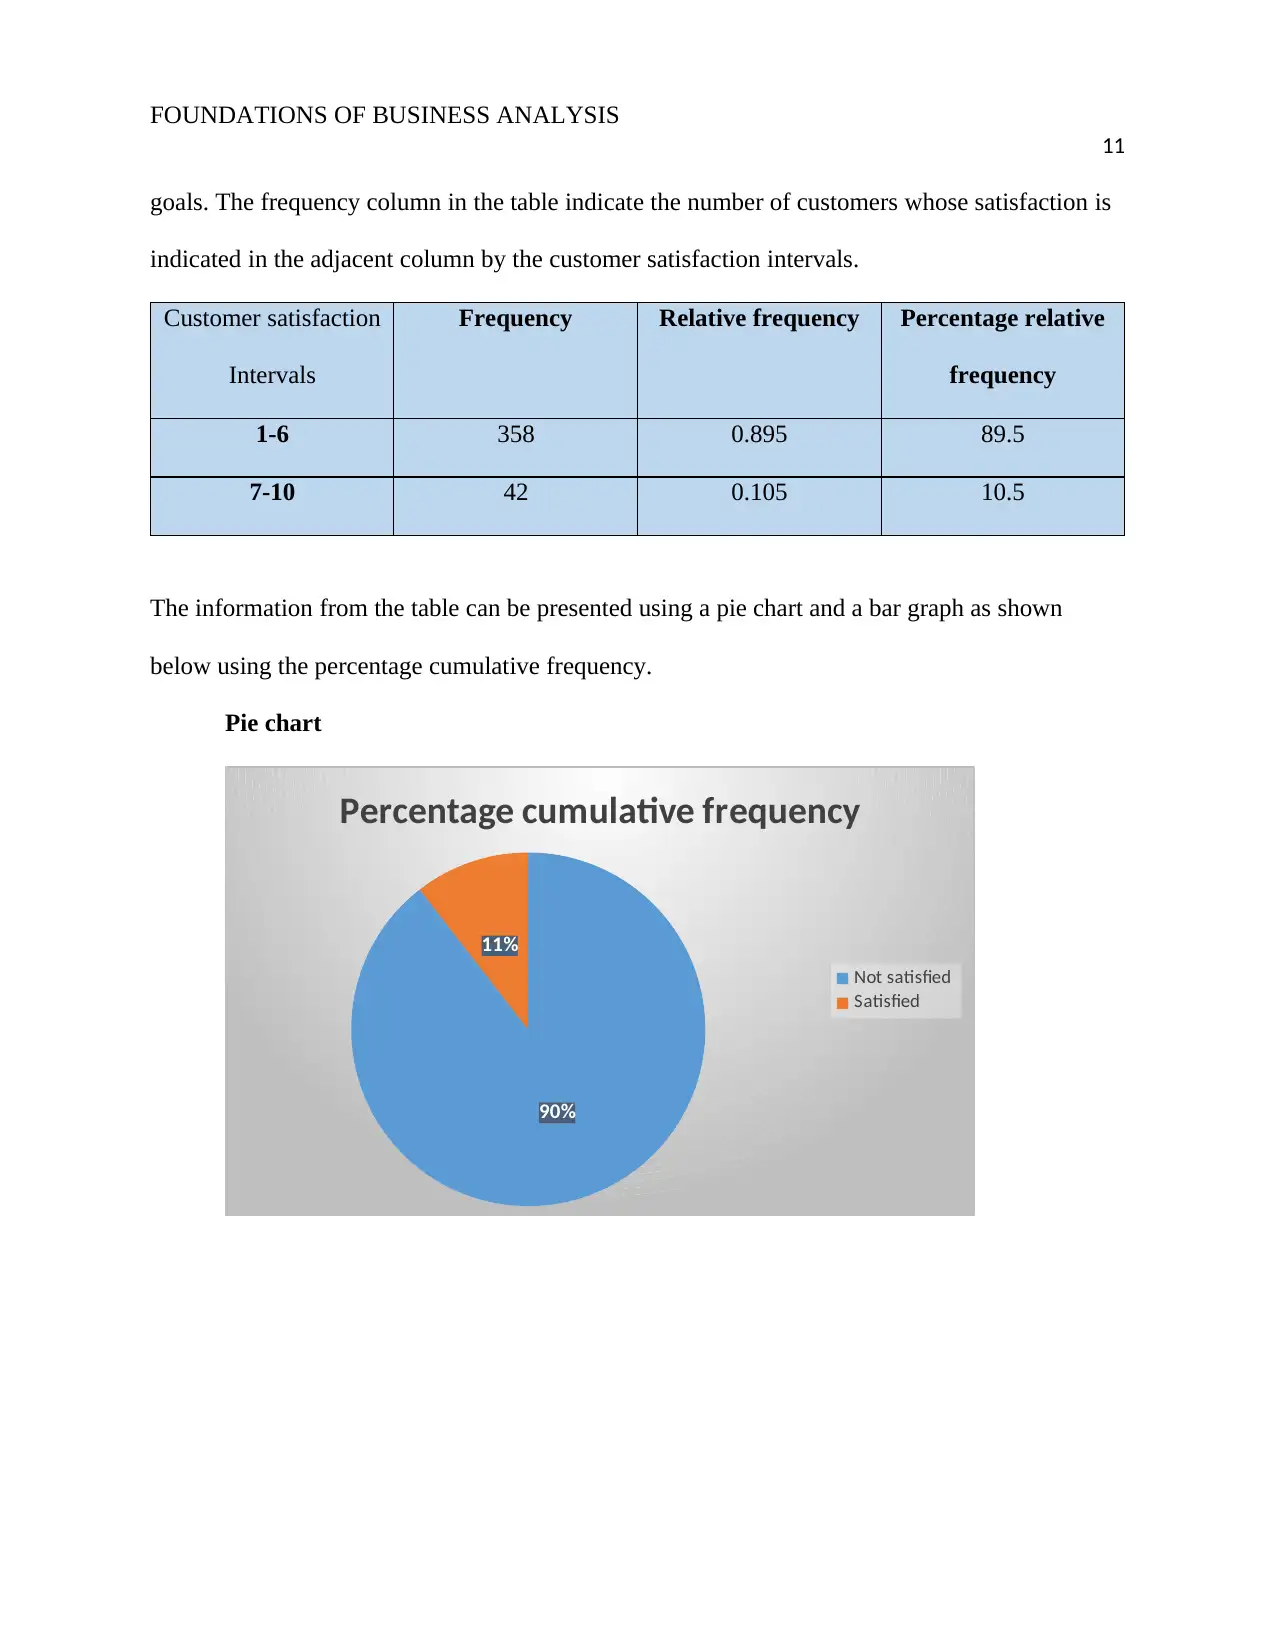
goals. The frequency column in the table indicate the number of customers whose satisfaction is
indicated in the adjacent column by the customer satisfaction intervals.
Customer satisfaction
Intervals
Frequency Relative frequency Percentage relative
frequency
1-6 358 0.895 89.5
7-10 42 0.105 10.5
The information from the table can be presented using a pie chart and a bar graph as shown
below using the percentage cumulative frequency.
Pie chart
90%
11%
Percentage cumulative frequency
Not satisfied
Satisfied
11
goals. The frequency column in the table indicate the number of customers whose satisfaction is
indicated in the adjacent column by the customer satisfaction intervals.
Customer satisfaction
Intervals
Frequency Relative frequency Percentage relative
frequency
1-6 358 0.895 89.5
7-10 42 0.105 10.5
The information from the table can be presented using a pie chart and a bar graph as shown
below using the percentage cumulative frequency.
Pie chart
90%
11%
Percentage cumulative frequency
Not satisfied
Satisfied
FOUNDATIONS OF BUSINESS ANALYSIS
12
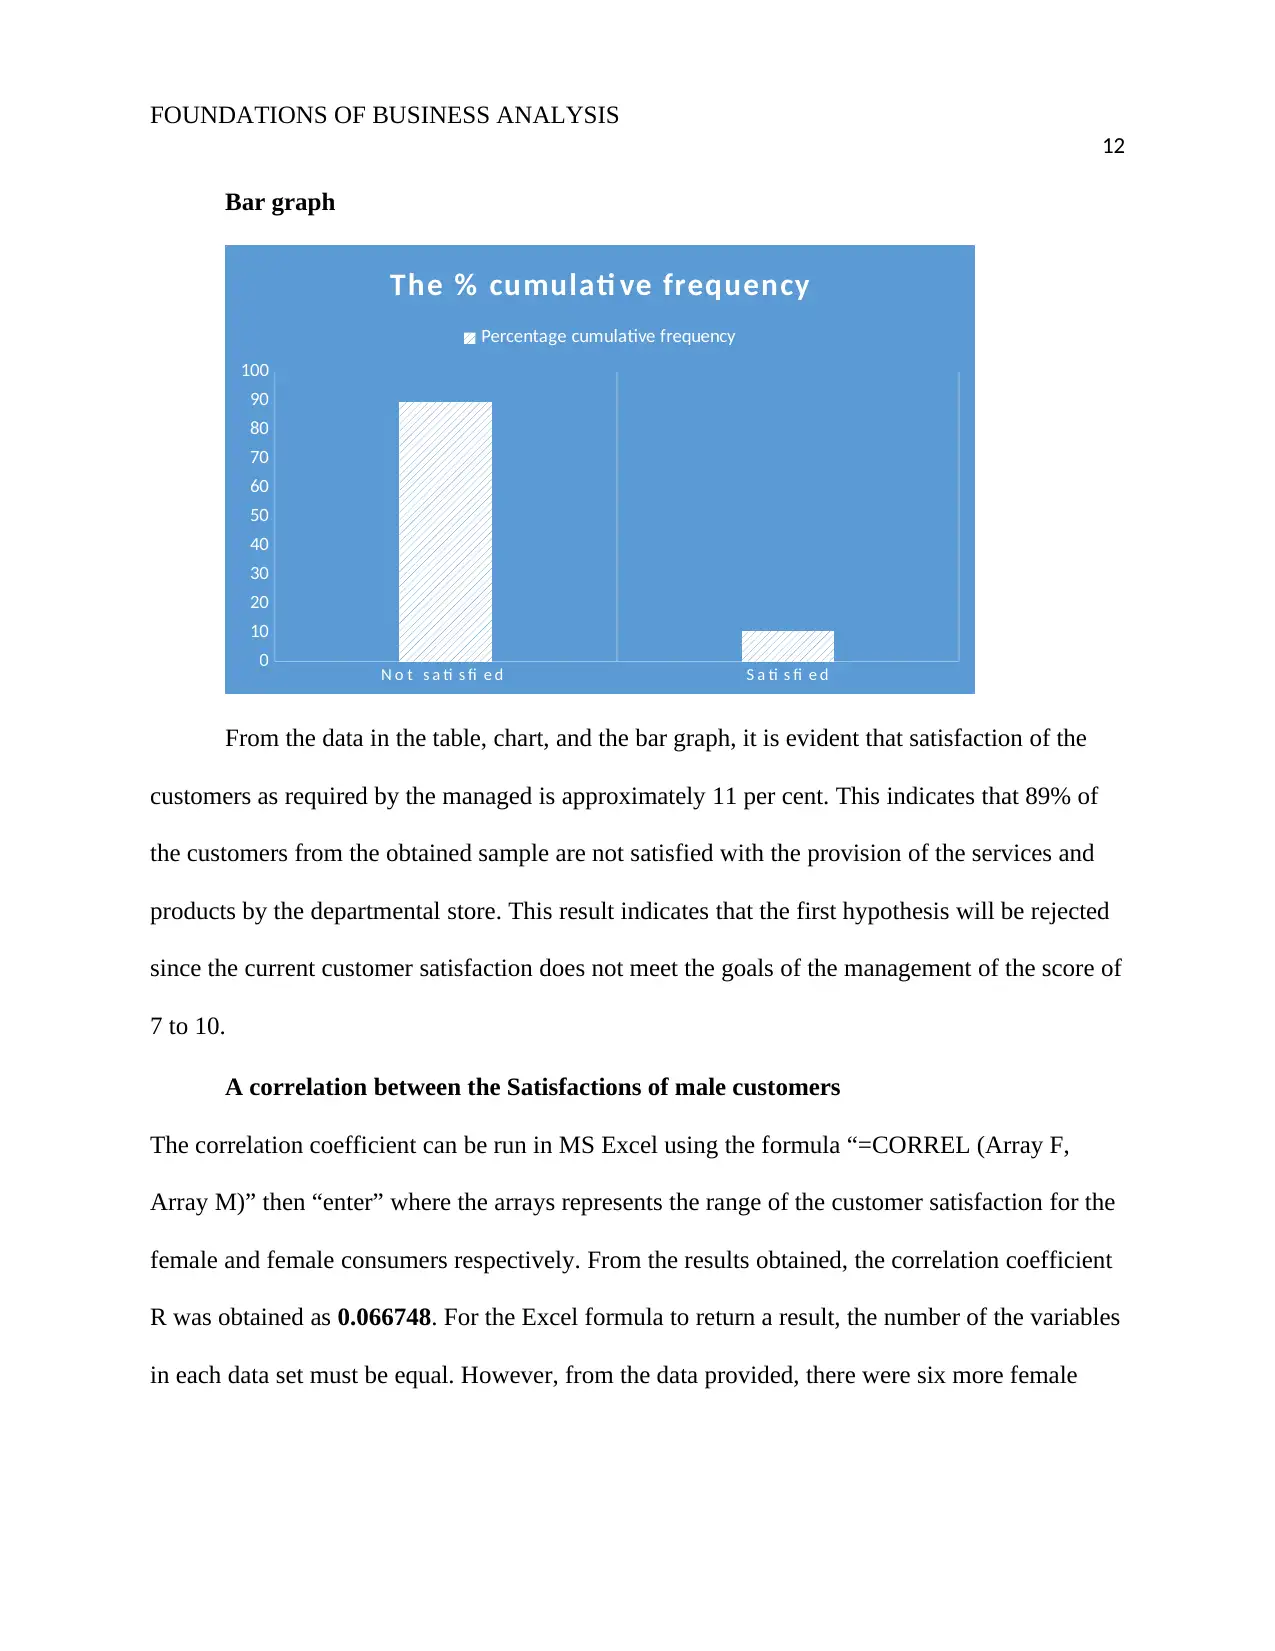
Bar graph
N o t s a ti s fi e d S a ti s fi e d
0
10
20
30
40
50
60
70
80
90
100
The % cumulati ve frequency
Percentage cumulative frequency
From the data in the table, chart, and the bar graph, it is evident that satisfaction of the
customers as required by the managed is approximately 11 per cent. This indicates that 89% of
the customers from the obtained sample are not satisfied with the provision of the services and
products by the departmental store. This result indicates that the first hypothesis will be rejected
since the current customer satisfaction does not meet the goals of the management of the score of
7 to 10.
A correlation between the Satisfactions of male customers
The correlation coefficient can be run in MS Excel using the formula “=CORREL (Array F,
Array M)” then “enter” where the arrays represents the range of the customer satisfaction for the
female and female consumers respectively. From the results obtained, the correlation coefficient
R was obtained as 0.066748. For the Excel formula to return a result, the number of the variables
in each data set must be equal. However, from the data provided, there were six more female
12
Bar graph
N o t s a ti s fi e d S a ti s fi e d
0
10
20
30
40
50
60
70
80
90
100
The % cumulati ve frequency
Percentage cumulative frequency
From the data in the table, chart, and the bar graph, it is evident that satisfaction of the
customers as required by the managed is approximately 11 per cent. This indicates that 89% of
the customers from the obtained sample are not satisfied with the provision of the services and
products by the departmental store. This result indicates that the first hypothesis will be rejected
since the current customer satisfaction does not meet the goals of the management of the score of
7 to 10.
A correlation between the Satisfactions of male customers
The correlation coefficient can be run in MS Excel using the formula “=CORREL (Array F,
Array M)” then “enter” where the arrays represents the range of the customer satisfaction for the
female and female consumers respectively. From the results obtained, the correlation coefficient
R was obtained as 0.066748. For the Excel formula to return a result, the number of the variables
in each data set must be equal. However, from the data provided, there were six more female
⊘ This is a preview!⊘
Do you want full access?
Subscribe today to unlock all pages.
Trusted by 1+ million students worldwide
1 out of 23
Related Documents


Your All-in-One AI-Powered Toolkit for Academic Success.
+13062052269
info@desklib.com
Available 24*7 on WhatsApp / Email
![[object Object]](/_next/static/media/star-bottom.7253800d.svg)
Unlock your academic potential
Copyright © 2020–2026 A2Z Services. All Rights Reserved. Developed and managed by ZUCOL.