Customer Satisfaction Measurement in Hospitality Enterprises: A Review
VerifiedAdded on 2022/09/14
|24
|21730
|16
Report
AI Summary
This report analyzes the article "Customer satisfaction and its measurement in hospitality enterprises" by Abraham Pizam and Taylor Ellis, published in the International Journal of Contemporary Hospitality Management. The article emphasizes customer satisfaction as a critical factor for success in the hospitality and tourism industries. It explores various methods for measuring customer satisfaction, including surveys and questionnaires, and discusses the importance of understanding customer expectations and requirements. The report delves into different theories of customer satisfaction, such as expectancy disconfirmation theory, and examines how these theories apply to the hospitality sector. It highlights the significance of a customer-oriented corporate culture and the challenges in implementing effective customer satisfaction measurement programs, while also considering global and cross-cultural issues impacting customer satisfaction. The article underscores the shift towards prioritizing customer value delivery and provides valuable insights for hospitality businesses aiming to enhance customer satisfaction and achieve sustainable competitive advantages.
International Journal of Contemporary Hospitality Management
Customer satisfaction and its measurement in hospitality enterprises
Abraham Pizam, Taylor Ellis,
Article information:
To cite this document:
Abraham Pizam, Taylor Ellis, (1999) "Customer satisfaction and its measurement in hospitality enterprises", International
Journal of Contemporary Hospitality Management, Vol. 11 Issue: 7, pp.326-339, https://doi.org/10.1108/09596119910293231
Permanent link to this document:
https://doi.org/10.1108/09596119910293231
Downloaded on: 11 April 2019, At: 21:12 (PT)
References: this document contains references to 87 other documents.
To copy this document: permissions@emeraldinsight.com
The fulltext of this document has been downloaded 48209 times since 2006*
Users who downloaded this article also downloaded:
(2011),"Hospitality quality: new directions and new challenges", International Journal of Contemporary
Hospitality Management, Vol. 23 Iss 4 pp. 463-478 <a href="https://doi.org/10.1108/09596111111129986">https://
doi.org/10.1108/09596111111129986</a>
(2005),"Service innovation and customer choices in the hospitality industry", Managing Service Quality: An
International Journal, Vol. 15 Iss 6 pp. 555-576 <a href="https://doi.org/10.1108/09604520510634023">https://
doi.org/10.1108/09604520510634023</a>
Access to this document was granted through an Emerald subscription provided by emerald-srm:414810 []
For Authors
If you would like to write for this, or any other Emerald publication, then please use our Emerald for Authors service
information about how to choose which publication to write for and submission guidelines are available for all. Plea
visit www.emeraldinsight.com/authors for more information.
About Emerald www.emeraldinsight.com
Emerald is a global publisher linking research and practice to the benefit of society. The company manages a portf
more than 290 journals and over 2,350 books and book series volumes, as well as providing an extensive range of
products and additional customer resources and services.
Emerald is both COUNTER 4 and TRANSFER compliant. The organization is a partner of the Committee on Publication
Ethics (COPE) and also works with Portico and the LOCKSS initiative for digital archive preservation.
*Related content and download information correct at time of download.
Downloaded by VICTORIA UNIVERSITY (Australia) At 21:12 11 April 2019 (PT)
Paraphrase This Document
Need a fresh take? Get an instant paraphrase of this document with our AI Paraphraser
Customer satisfaction and its measurement in
hospitality enterprises
Abraham Pizam
Department of Hospitality Management, University of Central Florida, Orlando,
Florida, USA
Taylor Ellis
Department of Hospitality Management, University of Central Florida, Orlando,
Florida, USA
Measuring service quality via
customer satisfaction
Customer satisfaction is the leading criterion
for determining the quality that is actually
delivered to customers through the product/
service and by the accompanying servicing
(Vavra, 1997). Simply stated, customer satis-
faction is essential for corporate survival.
Several studies have found that it costs about
five times as much in time, money and
resources to attract a new customer as it does
to retain an existing customer (Naumann,
1995). This creates the challenge of main-
taining high levels of service, awareness of
customer expectations and improvement in
services and product.
Knowledge of customer expectations and
requirements, Hayes states, is essential for
two reasons ± it provides understanding of
how the customer defines quality of service
and products, and facilitates the development
of a customer satisfaction questionnaires
(Hayes, 1997, p. 7). Furthermore, customer
satisfaction is recognized as of great impor-
tance to all commercial firms because of its
influence on repeat purchases and word-of-
mouth recommendations (Berkman and
Gilson, 1986).
Satisfaction, reinforces positive attitudes
toward the brand, leading to a greater like-
lihood that the same brand will be purchased
again ... dissatisfaction leads to negative
brand attitudes and lessens the likelihood of
buying the same brand again (Assael, 1987,
p. 47).
Or as others put it:
...if consumers are satisfied with a product or
brand, they will be more likely to continue to
purchase and use it and to tell others of their
favorable experience with it ... if they are
dissatisfied, they will be more likely to switch
brands and complain to manufacturers,
retailers, and other consumers about the
product (Peter and Olson, 1987, p. 512).
Satisfaction of customers also happens to be
the cheapest means of promotion. Various
researchers have found this ratio to range
from about 10 to 1 (Knutson, 1988, p. 17) to 5 to
1 (Naumann, 1995, p. 22).
There are several ways to assess the
quality of services and customer satisfaction
through subjective, or soft, measures of
quality, which focus on perceptions and
attitudes of the customer rather than more
concrete objective criteria. These soft mea-
sures include customer satisfaction surveys
and questionnaires to determine customer
attitudes and perceptions of the quality of the
service they are receiving (Hayes, 1997, p. 2).
Because the extent to which goods or services
meet the customer's needs and requirements
is the index by which quality is determined,
customers' perceptions of service is vital in
identifying customer needs and satisfaction.
To be successful, a customer satisfaction
measurement (CSM) programme must come
from and be incorporated into the firm's
corporate culture (Naumann, 1995, p. 12). In
today's competitive environment one of the
most important goals of corporate cultures is
retaining and satisfying current and past
customers. Experience shows that only
``consumer oriented'' corporations can
achieve this goal. These companies focus on
the needs and wants of specific target groups
and then work hard to maximize satisfaction
with the product or service being offered
(Vavra, 1997, p. 12). Instead of waiting for
customer complaints to let them know when
something isn't satisfactory or wrong, a
The current issue and fulltext archive of this journalis availableat
http://www.emerald-library.com
[ 326 ]
International Journal of
Contemporary Hospitality
Management
11/7 [ 1999] 326±339
# MCB University Press
[ISSN 0959-6119]
Keywords
Customer satisfaction,
Service quality,
Hospitality industry.
Abstract
Reviews and discusses the topic
of customer satisfaction and its
application to the hospitality and
tourism industries. Defines the
concept and analyzes its impor-
tance to services in general and to
hospitality/tourism services in
particular. Following a discussion
on the dimensions and attributes
of satisfaction, lists the main
methods of measuring satisfaction
and concludes with a review of
globaland cross-cultural issues
that affect satisfaction.
This article is partially
based on a previous article
published by one of the
current authors, Abraham
Pizam, and titled:
``Monitoring customer
satisfaction'', in Davis, B.E.
and Lockwood, A.J. (Eds),
Food and Beverage
Management: A Selection of
Readings, London,
Butterworth Heinemann,
1994, pp. 231-47.
Downloaded by VICTORIA UNIVERSITY (Australia) At 21:12 11 April 2019 (PT)
``consumer oriented'' corporate culture, seeks
continuous feedback from its customers
through repeated customer satisfaction
measurements (Vavra, 1997, p. 13).
In reality, application of CSM often does
not accomplish the objectives of the
researcher or company. The reasons for this
shortfall are numerous. First, organizations
often set customer satisfaction goals without
any clear understanding of their current
customers' satisfaction levels (Dutka, 1994).
Second, The companies that do measure
customer satisfaction, don't always act on the
results obtained (Dutka, 1994). Finally, as
organizations become more experienced with
CSM, problems become increasingly appar-
ent. For example, Jones and Sasser (1995)
indicate that satisfaction data does not
always correlate highly with organizational
performance. This was supported by
customers who responded that they were
satisfied with the organization, yet
purchased goods and services elsewhere.
Finding a strong relationship between
satisfaction scores and performance does not
ensure economic success. In the long run the
level of satisfaction may decline, customers'
attitudes and desires change, and new
competition may emerge.
Quality may no longer provide a clear
competitive advantage. Butz and Goodstein
(1996), found that increasing numbers of
managers reported that product innovation
and quality no longer provided the basis for a
competitive advantage. Because of this
situation, the search for a competitive
advantage has shifted from internal
processes and structure to markets and
customers. As a result there has been an
increasing number of organizations that are
reorienting strategy toward superior value
delivery (Band, 1991; Day, 1990; Gale, 1994;
Naumann, 1995). These authors usually cite
one or more of the following four kinds of
evidence to support their position:
(1) Widely publicized success stories (e.g.
AT&T, Federal Express, Xerox, Eastman
Chemical Company);
(2) analysis of profit impact of marketing
strategy (PIMS) data that shows a strong
relationship between quality, market
share, and profitability (Gale, 1994);
(3) studies finding a positive relationship
between market orientation and organi-
zational performance (Jaworski and
Kohli, 1993; Narver and Slater, 1990); and
(4) analyses of costs demonstrating that
customer retention is substantially less
expensive than customer acquisition
(Birch, 1990). Because of all the over-
whelming number of authors encouraging
organizations to provide customer value,
the question becomes how to do it? This
paper will provide valid methods that an
organization can use to measure the value
it provides to its customers.
What is customer satisfaction?
Social psychologists, marketing researchers,
and students of consumer behaviour, have
extensively studied the concepts of customer
satisfaction and dissatisfaction. The increas-
ing importance of quality in both service and
manufacturing industries has also created a
proliferation of research, with more than
15,000 academic and trade articles having
been published on the topic of customer
satisfaction in the past two decades (Peterson
and Wilson, 1992). Several conferences have
been devoted to the subject and extensive
literature reviews have been published (Day,
1977; Hunt, 1977; LaTour and Peat, 1979;
Smart, 1982; Ross, et al., 1987, Barsky, 1992:
Oh and Parks, 1997) The result of all this
research has been the development of nine
distinct theories of customer satisfaction.
The majority of these theories are based on
cognitive psychology, some have received
moderate attention, while other theories
have been introduced without any empirical
research. The nine theories include:
1 expectancy disconfirmation;
2 assimilation or cognitive dissonance;
3 contrast;
4 assimilation-contrast;
5 equity;
6 attribution;
7 comparison-level;
8 generalized negativity; and
9 value-precept (Oh and Parks, 1997).
Recently, numerous researchers have
attempted to apply CS theories developed by
consumer behaviourists in the areas of lod-
ging (Barsky, 1992; Barsky and Labagh, 1992;
Saleh and Ryan, 1991; Ekinci and Riley, 1998),
restaurant (Dube et al., 1994; Bojanic and
Rosen, 1994; Lee and Hing, 1995; Oh and
Jeong, 1996), foodservice (Almanza et al.,
1994), and tourism (Pizam and Milman, 1993;
Danaher and Arweiler, 1996; Ryan and Cliff,
1997; Hudson and Shepard, 1998) in order to
investigate CS applicability to the hospitality
and tourism industries.
Customer satisfaction is a psychological
concept that involves the feeling of well-being
and pleasure that results from obtaining
what one hopes for and expects from an
appealing product and/or service (WTO,
1985). While there are a variety of approaches
to the explanation of customer satisfaction/
dissatisfaction, the most widely used is the
one proposed by Richard Oliver who has
[ 327 ]
Abraham Pizam and
Taylor Ellis
Customer satisfaction and its
measurement in hospitality
enterprises
International Journal of
Contemporary Hospitality
Management
11/7 [1999] 326±339
Downloaded by VICTORIA UNIVERSITY (Australia) At 21:12 11 April 2019 (PT)
⊘ This is a preview!⊘
Do you want full access?
Subscribe today to unlock all pages.
Trusted by 1+ million students worldwide
developed the expectancy disconfirmation
theory (Oliver, 1980). According to this
theory, which has been tested and confirmed
in several studies (Oliver and DeSarbo, 1988;
Tse and Wilton, 1988), customers purchase
goods and services with pre-purchase expec-
tations about anticipated performance. Once
the product or service has been purchased
and used, outcomes are compared against
expectations. When outcome matches expec-
tations, confirmation occurs. Discon-
firmation occurs when there are differences
between expectations and outcomes.
Negative disconfirmation occurs when
product/service performance is less than
expected. Positive disconfirmation occurs
when product/service performance is better
than expected. Satisfaction is caused by
confirmation or positive disconfirmation of
consumer expectations, and dissatisfaction is
caused by negative disconfirmation of
consumer expectations.
Customer satisfaction can also be defined
as satisfaction based on an outcome or a
process. Vavra's (1997, p. 4) outcome defini-
tion of customer satisfaction characterizes
satisfaction as the end-state resulting from
the experience of consumption. This end
state may be a cognitive state of reward, an
emotional response to an experience or a
comparison of rewards and costs to the
anticipated consequences. Vavra also puts
forth a definition of customer satisfaction
based as a process, emphasizing the percep-
tual, evaluative and psychological processes
contributing to customer satisfaction (1997,
p. 4). In this definition, assessment of satis-
faction is made during the service delivery
process.
A minority of researchers perceive the
satisfaction process to be subjective in ex-
pectations but objective in the perceptions of
the product attributes, or outcome. Thus,
Klaus (1985, p. 21) defines satisfaction as ``the
customer's subjective evaluation of a
consumption experience, based on some
relationship between the customer's percep-
tions and objective attributes of the product''.
Others point out that both what is perceived
(outcome) and what is expected are subjec-
tive and therefore psychological phenomena -
not reality (Maister, 1985). The importance of
the subjective nature of the process cannot be
overstated. Since both expectations and
perceptions are psychological phenomena,
they are both susceptible to external influ-
ences and manipulation. As an illustration of
how expectations can be explicitly manipu-
lated Sasser et al. (1979, p. 89) note that:
``Some restaurants follow the practice of
promising guests a waiting time in excess of
the ``expected time''. If people are willing to
agree to wait this length of time, they are
quite pleased to be seated earlier, thus
starting the meal with a more positive
feeling'' (Maister, 1985, p.114). An example of
creating low customer expectations is a
restaurant in Orlando, Florida, which calls
itself Warm Beer & Lousy Food. Once a
customer has experienced a reasonable meal
at the above restaurant he/she is pleasantly
surprised and comes out very satisfied.
Manipulating perceptions of outcome is also
a common practice in some hotels where
front office clerks mention nonchalantly that
a particular suite in the hotel is a favorite of a
famous personality. The intention here is to
influence the perception of the customer and
suggest that the hotel must be good since an
``expert'' regularly frequents it.
Satisfaction is not a universal phenomenon
and not everyone gets the same satisfaction
out of the same hospitality experience. The
reason is that customers have different
needs, objectives and past experiences that
influence their expectations. To a student on
a limited budget, a lunch composed of fast
food items at the crowded and noisy school
cafeteria may be a highly satisfying experi-
ence, while the same experience may be
perceived as totally dissatisfying to an
affluent executive discussing a business
transaction. The same customer may also
have different needs and expectations on
different meal occasions, or at different times
of the day (Davis and Stone, 1985, p. 31). The
student in our previous example will not be
highly satisfied when his college friends take
him out for a ``birthday'' meal celebration at
the school cafeteria. Therefore it is important
to gain a clear idea of the customer needs and
objectives that correspond to different kinds
of satisfactions. This necessitates the
segmentation of the market, because no
service or product can offer everyone the
same degree of satisfaction (WTO, 1985).
To recapitulate what we have established
by now is that an individual's satisfaction
with outcomes received from a hospitality
experience results from a comparison of
these outcomes with expectations. Expecta-
tions can be described as a mutable internal
standard which is based on a multitude of
factors including needs, objectives, past
personal or vicarious experiences with the
same establishment restaurant, with similar
establishments, and the availability of alter-
natives (i.e. are there any other establish-
ments in town?). This view is supported by
Mazursky who suggests that:
Experiences beyond those with the focal
brands may lead to different normative
standards employed by consumers in evalu-
ating performance. Possible norms, according
[ 328 ]
Abraham Pizam and
Taylor Ellis
Customer satisfaction and its
measurement in hospitality
enterprises
International Journal of
Contemporary Hospitality
Management
11/7 [1999] 326±339
Downloaded by VICTORIA UNIVERSITY (Australia) At 21:12 11 April 2019 (PT)
Paraphrase This Document
Need a fresh take? Get an instant paraphrase of this document with our AI Paraphraser
to this view, include perceived best brand, the
most recently used brand, a brand used by a
reference person, products competing for the
same needs, and the like (p. 338).
Changes in satisfaction with the meal
experience may result from changes in the
perception of the actual quality of outcomes
received, or from changes in the expectations
against which these outcomes are compared.
Alterations in the expectations can result
from change in needs (i.e. hungry versus full;
tired versus rested) change of objectives (i.e.
business trip vs leisure trip), new personal or
vicarious experiences (i.e. recently had a
superb hospitality experience at another
hotel) and any other influences that make
salient a particular quality of outcomes (i.e.
it's a very hot day and the restaurant is not
air conditioned) (McCallum and Harrison,
1985).
Past research in customer satisfaction and
service quality has resulted in increasing
research efforts to look at new ways to
evaluate these concepts. Historically, the
assumption has been that a linear relation-
ship exists between satisfaction/dissatis-
faction and disconfirmation or performance
evaluations. Researchers such as Oliva et al.
(1992) proposed a catastrophe model theoriz-
ing the nature of the relationship of satis-
faction with transaction costs and brand
loyalty. This theory hypothesizes that satis-
faction and dissatisfaction occur at different
points, specifically these behaviours are
associated with transaction costs and brand
loyalty and are not monotonic. Research by
various authors (Cronin and Taylor, 1992;
Oliver and Swan, 1989; Cadotte et al., 1987)
using structural modelling, found underlying
causal dynamics among Customer Service
model constructs. The result of this discovery
is that CS researchers must, determine a
generalizable causal relationship among
model constructs and identify a representa-
tive parsimonious CS structural model.
The components of satisfaction
Unlike material products or pure services,
most hospitality experiences are an amalgam
of products and services. Therefore it is
possible to say that satisfaction with a
hospitality experience such as a hotel stay or
a restaurant meal is a sum total of satis-
factions with the individual elements or
attributes of all the products and services
that make up the experience.
There is no uniformity of opinion among
marketing experts as to the classification of
the elements in service encounters. Reuland
et al. (1985, p. 142) suggest that hospitality
services consist of a harmonious mixture of
three elements: the material product in a
narrow sense which in the case of a restau-
rant is the food and beverages; the behaviour
and attitude of the employees who are
responsible for hosting the guest, serving the
meal and beverages and who come in direct
contact with the guests, and the environ-
ment, such as the building, the layout, the
furnishing, the lighting in the restaurant, etc.
Czepiel et al. (1985) on the other hand,
suggest that satisfaction with a service is a
function of satisfaction with two independent
elements. The functional element, i.e. the
food and beverage in a restaurant, and the
performance-delivery element, i.e. the
service. To prove the independence of the two
elements from each other, the authors claim
that restaurant clients are quite capable of
having responses to each element that differ
one from the other: ``The service was great,
the food poor'' or conversely... (p. 13).
Davis and Stone (1985, p.29) divide the
service encounter into two elements: direct
and indirect services. For example, direct
services may be the actual check-in/check-
out process in hotels, while the indirect
services include the provision of parking
facilities, concierge, public telephones for
guests' use, etc.
Lovelock (1985) divides the service attri-
butes into two groups: core and secondary.
Airline service provides a good example, with
customers first making inquiries and reser-
vations, then checking in their baggage,
getting seat assignments, being checked at the
gate, receiving on-board service in flight, and
retrieving their baggage at the destination
airport. Each of these activities is an opera-
tions task that is secondary to the core
product of physically transporting passengers
and their bags between two airports. But
these secondary tasks have a greater poten-
tial to generate customer dissatisfaction if
performed poorly (p. 272).
In a restaurant situation Lovelock's core will
be composed of the food and beverage, while
his secondary will be composed of everything
else, including service, environment, etc.
Lewis (1987), too, classifies the service
encounter attributes in two groups: essential
and subsidiary. The essential attributes are
identical to Czepiel's functional, Davis and
Stone's direct, Reuland and colleagues' pro-
duct, and Lovelock's core, i.e. the food and
beverage in the meal experience. On the
other hand Lewis's subsidiary attributes are
more comprehensive than either Davis and
Stone's indirect, Czepiel's performance-
delivery, or Lovelock's secondary, and
include such factors as: accessibility,
convenience of location, availability and
timing and flexibility, as well as interactions
[ 329 ]
Abraham Pizam and
Taylor Ellis
Customer satisfaction and its
measurement in hospitality
enterprises
International Journal of
Contemporary Hospitality
Management
11/7 [1999] 326±339
Downloaded by VICTORIA UNIVERSITY (Australia) At 21:12 11 April 2019 (PT)
with those providing the service and with
other customers. It is equivalent to a
combination of the behaviour and environ-
ment elements in the Reuland et al. model.
Yet other researchers support the idea that
the service encounter attributes are situa-
tion-specific and as such cannot be classified
into universal elements. For example,
Fiebelkorn (1985) doing a study at Citibank
found that overall satisfaction with Citibank
as one of the customer's banks (or his bank
only) is based on satisfaction with the last
encounter with the bank in five main areas:
teller encounter, platform encounter, ATM
(automatic teller machines) encounter,
phone encounter, problem encounter. He
then concludes that ``the common thread
running through all five service-encounter
types is that customers want: prompt service
by people who know what to do and how to do
it, and who care about them as valued
customers'' (Fiebelkorn, 1985, p. 185).
Dimensions of satisfaction
In service organizations, the assessment of
the quality of a service is made during the
actual delivery of the service ± usually an
encounter between the customer and a
service contact person. Parasuraman et al.
(1985, 1988, 1991) identified the following five
generic dimensions of service quality
(SERVQUAL) that must be present in the
service delivery in order for it to result in
customer satisfaction:
. Reliability ± the ability to perform the
promised services dependably and
accurately.
. Responsiveness ± the willingness to help
customers and provide prompt service.
. Assurance ± the knowledge and courtesy of
employees as well as their ability to
convey trust and confidence.
. Empathy ± the provision of caring,
individualized attention to customers, and
. Tangibles, the appearance of physical
facilities, equipment, personnel and
communication materials.
The model conceptualizes service quality as a
gap between customer's expectations (E) and
the perception of the service providers'
performance (P). According to Parasuraman
et al. (1985), service quality should be
measured by subtracting customer's percep-
tion scores from customer expectation scores
(Q = P ± E). The greater the positive score
represents the greater the positive amount of
service quality or visa versa.
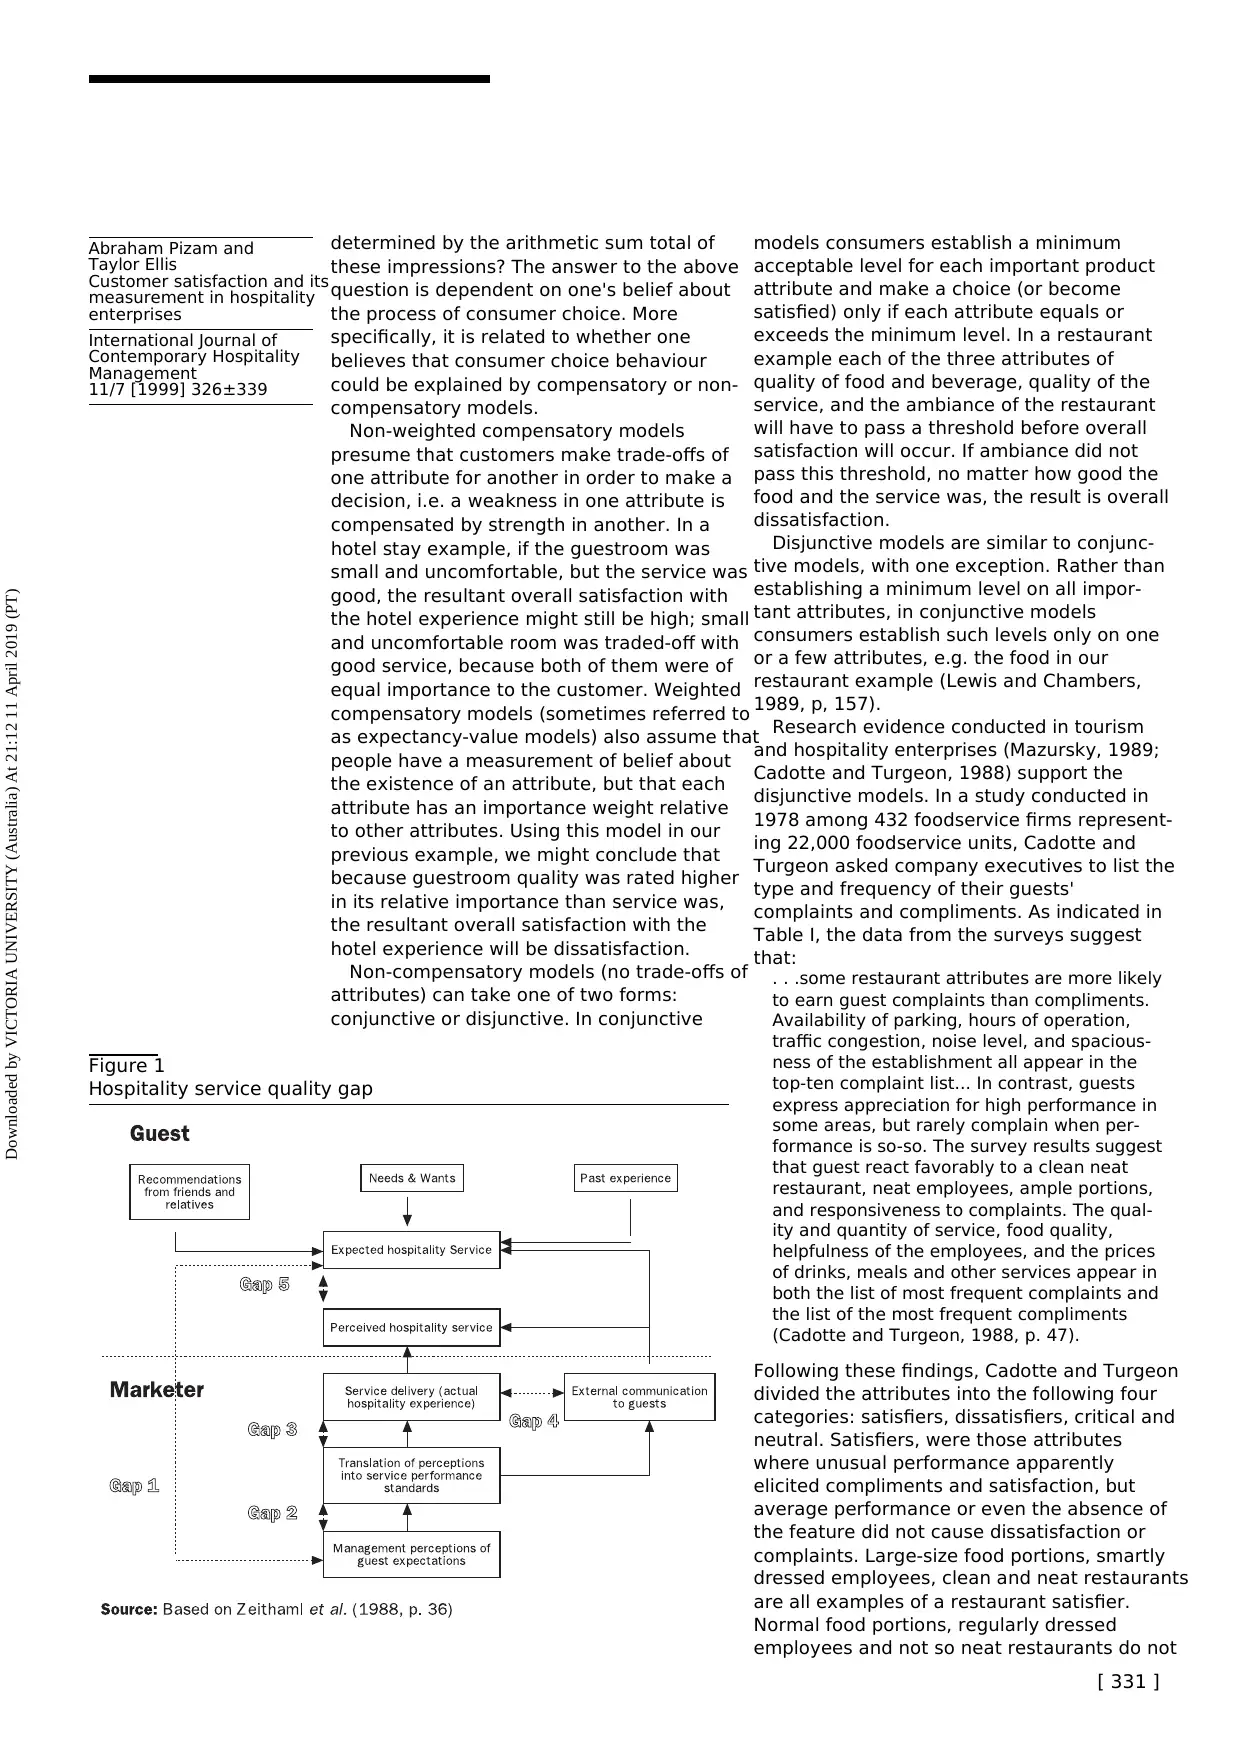
The gap that may exist between the custo-
mers' expected and perceived service is not
only a measure of the quality of the service,
but is also a determinant of customer
satisfaction/dissatisfaction. Measuring the
gap between expected and perceived service
is a routine method of utilizing customer
feedback. Zeithaml et al., (1988) suggested a
model that details the gaps between customer
expectations and the actual service delivered.
(see Figure 1). Vavra (1997, p. 91) identified a
sixth gap namely the difference between the
customers' desired service and their expected
service.
Since its introduction in 1988, SERVQUAL
has been used in hundreds of studies includ-
ing numerous studies in the hospitality and
tourism industries (Fick and Ritchie, 1991;
Saleh and Ryan, 1991; Luk et al., 1993; Bojanic
and Rosen, 1994; Lee and Hing, 1995; Ryan
and Cliff, 1997). SERVQUAL was also used by
Knutson et al. (1991) to create a lodging-
specific instrument called LODGSERV which
is a 26 item index designed to measure
consumer expectations for service quality in
the hotel experience. LODGSERV, however,
is not as popular among hospitality and
tourism researchers as SERVQUAL and was
used only in a limited number of studies (i.e.
Patton et al., 1994; Ekinci et al., 1998).
But SERVQUAL has also been seriously
criticized (Carman, 1990; Finn and Lamb,
1991; Babakus and Boller, 1992; Brown et al.,
1993; Smith, 1995). The main criticisms of the
model relate to the application of expecta-
tions and the gap scoring. First, the concep-
tualization of expectation as a comparison
standard in the model is a difficult concept to
quantify. Second, if the variables are difficult
to quantify then, by implication, the gap
score becomes that much less secure as a
measurement. Third, some methodological
issues arise. Finally, doubt has been
expressed as to the universal quality of the
dimensions. (Eckinci and Riley, 1998, p. 355)
Overall satisfaction vs satisfaction
with individual attributes
In the previous section we indicated that it is
possible to say that satisfaction with a
hospitality experience is a sum total of
satisfactions with the individual elements or
attributes of all the products and services
that make up the experience. Though super-
ficially the above statement makes sense, in
reality the matter is more compounded. The
question that we have to ask ourselves is
whether when customers experience the
attributes of the hospitality experience they
form a set of independent impressions on
each and compare those with the expecta-
tions of the same attributes. And, is the
resultant overall level of satisfaction
[ 330 ]
Abraham Pizam and
Taylor Ellis
Customer satisfaction and its
measurement in hospitality
enterprises
International Journal of
Contemporary Hospitality
Management
11/7 [1999] 326±339
Downloaded by VICTORIA UNIVERSITY (Australia) At 21:12 11 April 2019 (PT)
other customers. It is equivalent to a
combination of the behaviour and environ-
ment elements in the Reuland et al. model.
Yet other researchers support the idea that
the service encounter attributes are situa-
tion-specific and as such cannot be classified
into universal elements. For example,
Fiebelkorn (1985) doing a study at Citibank
found that overall satisfaction with Citibank
as one of the customer's banks (or his bank
only) is based on satisfaction with the last
encounter with the bank in five main areas:
teller encounter, platform encounter, ATM
(automatic teller machines) encounter,
phone encounter, problem encounter. He
then concludes that ``the common thread
running through all five service-encounter
types is that customers want: prompt service
by people who know what to do and how to do
it, and who care about them as valued
customers'' (Fiebelkorn, 1985, p. 185).
Dimensions of satisfaction
In service organizations, the assessment of
the quality of a service is made during the
actual delivery of the service ± usually an
encounter between the customer and a
service contact person. Parasuraman et al.
(1985, 1988, 1991) identified the following five
generic dimensions of service quality
(SERVQUAL) that must be present in the
service delivery in order for it to result in
customer satisfaction:
. Reliability ± the ability to perform the
promised services dependably and
accurately.
. Responsiveness ± the willingness to help
customers and provide prompt service.
. Assurance ± the knowledge and courtesy of
employees as well as their ability to
convey trust and confidence.
. Empathy ± the provision of caring,
individualized attention to customers, and
. Tangibles, the appearance of physical
facilities, equipment, personnel and
communication materials.
The model conceptualizes service quality as a
gap between customer's expectations (E) and
the perception of the service providers'
performance (P). According to Parasuraman
et al. (1985), service quality should be
measured by subtracting customer's percep-
tion scores from customer expectation scores
(Q = P ± E). The greater the positive score
represents the greater the positive amount of
service quality or visa versa.
The gap that may exist between the custo-
mers' expected and perceived service is not
only a measure of the quality of the service,
but is also a determinant of customer
satisfaction/dissatisfaction. Measuring the
gap between expected and perceived service
is a routine method of utilizing customer
feedback. Zeithaml et al., (1988) suggested a
model that details the gaps between customer
expectations and the actual service delivered.
(see Figure 1). Vavra (1997, p. 91) identified a
sixth gap namely the difference between the
customers' desired service and their expected
service.
Since its introduction in 1988, SERVQUAL
has been used in hundreds of studies includ-
ing numerous studies in the hospitality and
tourism industries (Fick and Ritchie, 1991;
Saleh and Ryan, 1991; Luk et al., 1993; Bojanic
and Rosen, 1994; Lee and Hing, 1995; Ryan
and Cliff, 1997). SERVQUAL was also used by
Knutson et al. (1991) to create a lodging-
specific instrument called LODGSERV which
is a 26 item index designed to measure
consumer expectations for service quality in
the hotel experience. LODGSERV, however,
is not as popular among hospitality and
tourism researchers as SERVQUAL and was
used only in a limited number of studies (i.e.
Patton et al., 1994; Ekinci et al., 1998).
But SERVQUAL has also been seriously
criticized (Carman, 1990; Finn and Lamb,
1991; Babakus and Boller, 1992; Brown et al.,
1993; Smith, 1995). The main criticisms of the
model relate to the application of expecta-
tions and the gap scoring. First, the concep-
tualization of expectation as a comparison
standard in the model is a difficult concept to
quantify. Second, if the variables are difficult
to quantify then, by implication, the gap
score becomes that much less secure as a
measurement. Third, some methodological
issues arise. Finally, doubt has been
expressed as to the universal quality of the
dimensions. (Eckinci and Riley, 1998, p. 355)
Overall satisfaction vs satisfaction
with individual attributes
In the previous section we indicated that it is
possible to say that satisfaction with a
hospitality experience is a sum total of
satisfactions with the individual elements or
attributes of all the products and services
that make up the experience. Though super-
ficially the above statement makes sense, in
reality the matter is more compounded. The
question that we have to ask ourselves is
whether when customers experience the
attributes of the hospitality experience they
form a set of independent impressions on
each and compare those with the expecta-
tions of the same attributes. And, is the
resultant overall level of satisfaction
[ 330 ]
Abraham Pizam and
Taylor Ellis
Customer satisfaction and its
measurement in hospitality
enterprises
International Journal of
Contemporary Hospitality
Management
11/7 [1999] 326±339
Downloaded by VICTORIA UNIVERSITY (Australia) At 21:12 11 April 2019 (PT)
⊘ This is a preview!⊘
Do you want full access?
Subscribe today to unlock all pages.
Trusted by 1+ million students worldwide
determined by the arithmetic sum total of
these impressions? The answer to the above
question is dependent on one's belief about
the process of consumer choice. More
specifically, it is related to whether one
believes that consumer choice behaviour
could be explained by compensatory or non-
compensatory models.
Non-weighted compensatory models
presume that customers make trade-offs of
one attribute for another in order to make a
decision, i.e. a weakness in one attribute is
compensated by strength in another. In a
hotel stay example, if the guestroom was
small and uncomfortable, but the service was
good, the resultant overall satisfaction with
the hotel experience might still be high; small
and uncomfortable room was traded-off with
good service, because both of them were of
equal importance to the customer. Weighted
compensatory models (sometimes referred to
as expectancy-value models) also assume that
people have a measurement of belief about
the existence of an attribute, but that each
attribute has an importance weight relative
to other attributes. Using this model in our
previous example, we might conclude that
because guestroom quality was rated higher
in its relative importance than service was,
the resultant overall satisfaction with the
hotel experience will be dissatisfaction.
Non-compensatory models (no trade-offs of
attributes) can take one of two forms:
conjunctive or disjunctive. In conjunctive
models consumers establish a minimum
acceptable level for each important product
attribute and make a choice (or become
satisfied) only if each attribute equals or
exceeds the minimum level. In a restaurant
example each of the three attributes of
quality of food and beverage, quality of the
service, and the ambiance of the restaurant
will have to pass a threshold before overall
satisfaction will occur. If ambiance did not
pass this threshold, no matter how good the
food and the service was, the result is overall
dissatisfaction.
Disjunctive models are similar to conjunc-
tive models, with one exception. Rather than
establishing a minimum level on all impor-
tant attributes, in conjunctive models
consumers establish such levels only on one
or a few attributes, e.g. the food in our
restaurant example (Lewis and Chambers,
1989, p, 157).
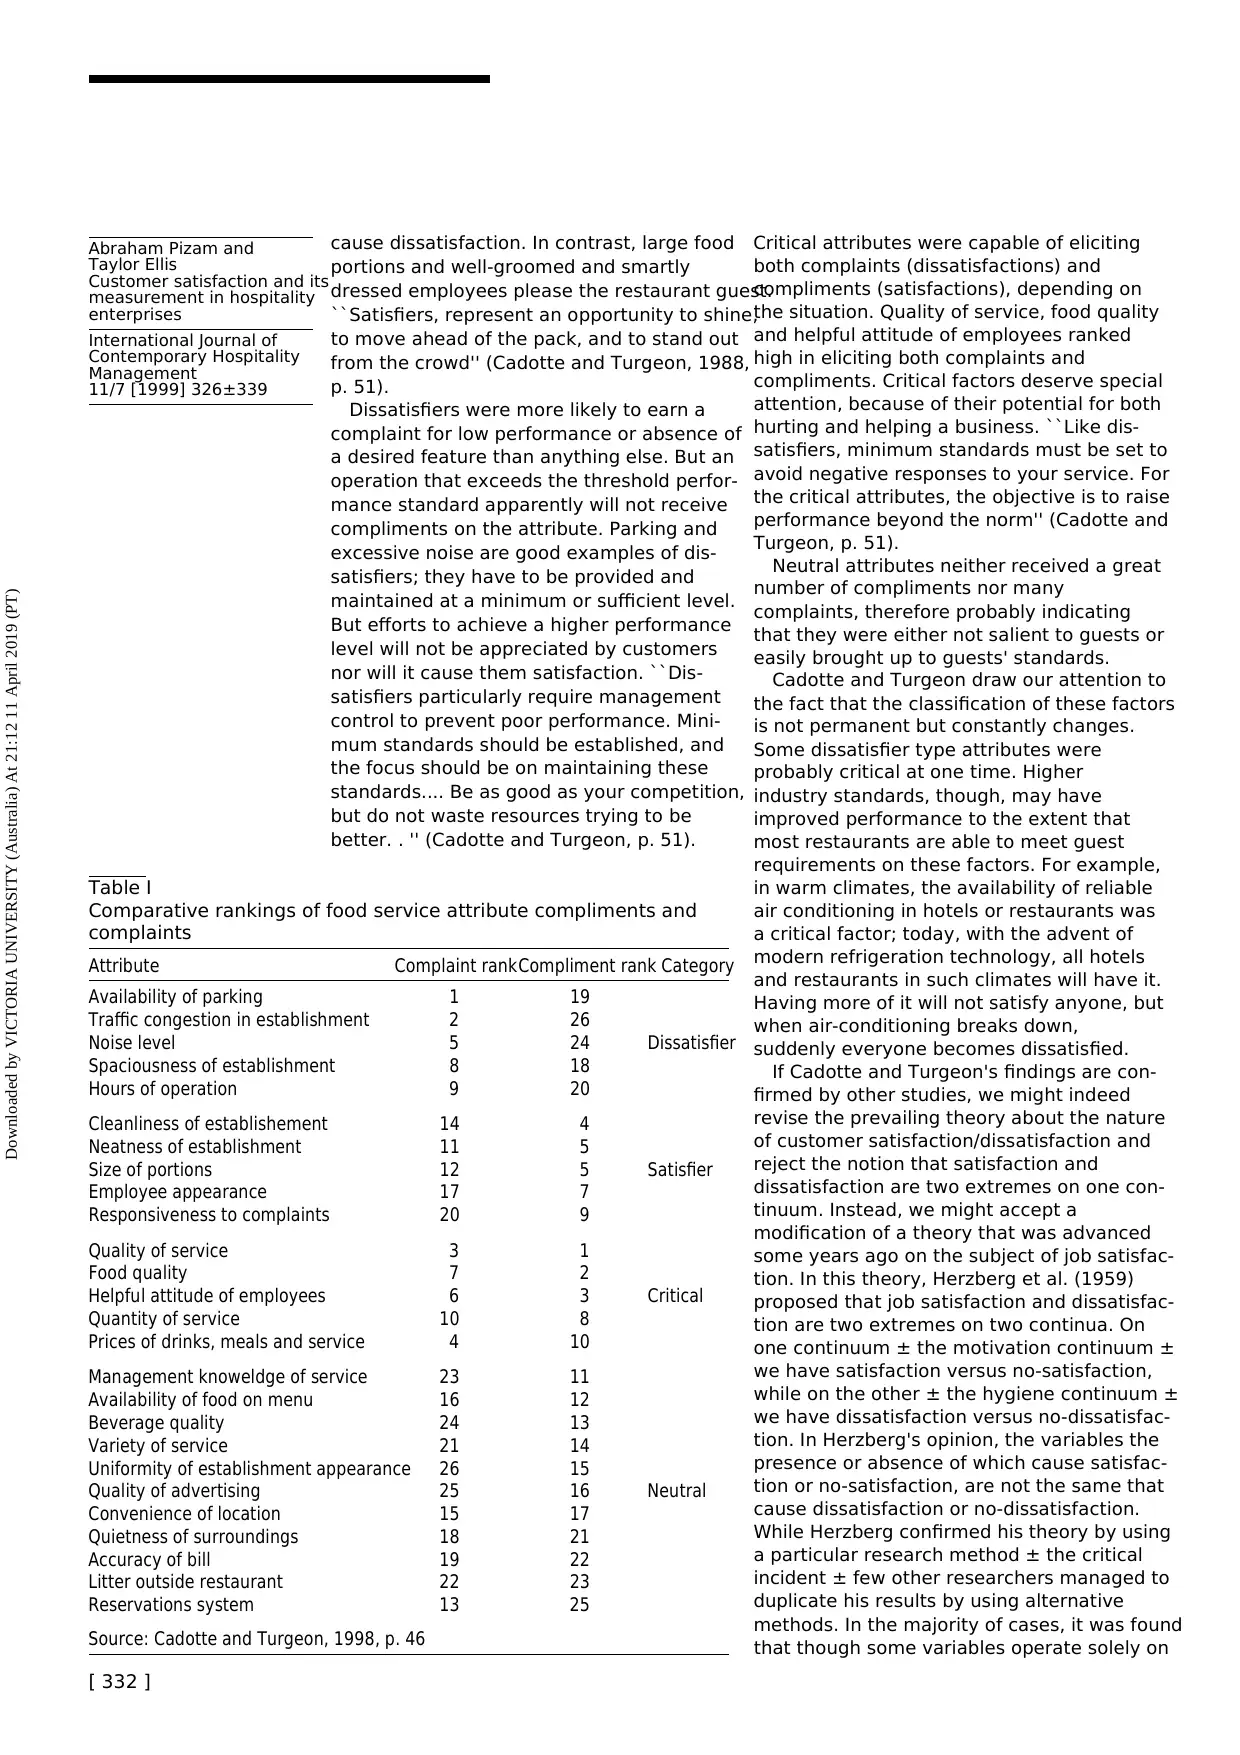
Research evidence conducted in tourism
and hospitality enterprises (Mazursky, 1989;
Cadotte and Turgeon, 1988) support the
disjunctive models. In a study conducted in
1978 among 432 foodservice firms represent-
ing 22,000 foodservice units, Cadotte and
Turgeon asked company executives to list the
type and frequency of their guests'
complaints and compliments. As indicated in
Table I, the data from the surveys suggest
that:
. . .some restaurant attributes are more likely
to earn guest complaints than compliments.
Availability of parking, hours of operation,
traffic congestion, noise level, and spacious-
ness of the establishment all appear in the
top-ten complaint list... In contrast, guests
express appreciation for high performance in
some areas, but rarely complain when per-
formance is so-so. The survey results suggest
that guest react favorably to a clean neat
restaurant, neat employees, ample portions,
and responsiveness to complaints. The qual-
ity and quantity of service, food quality,
helpfulness of the employees, and the prices
of drinks, meals and other services appear in
both the list of most frequent complaints and
the list of the most frequent compliments
(Cadotte and Turgeon, 1988, p. 47).
Following these findings, Cadotte and Turgeon
divided the attributes into the following four
categories: satisfiers, dissatisfiers, critical and
neutral. Satisfiers, were those attributes
where unusual performance apparently
elicited compliments and satisfaction, but
average performance or even the absence of
the feature did not cause dissatisfaction or
complaints. Large-size food portions, smartly
dressed employees, clean and neat restaurants
are all examples of a restaurant satisfier.
Normal food portions, regularly dressed
employees and not so neat restaurants do not
Figure 1
Hospitality service quality gap
[ 331 ]
Abraham Pizam and
Taylor Ellis
Customer satisfaction and its
measurement in hospitality
enterprises
International Journal of
Contemporary Hospitality
Management
11/7 [1999] 326±339
Downloaded by VICTORIA UNIVERSITY (Australia) At 21:12 11 April 2019 (PT)
these impressions? The answer to the above
question is dependent on one's belief about
the process of consumer choice. More
specifically, it is related to whether one
believes that consumer choice behaviour
could be explained by compensatory or non-
compensatory models.
Non-weighted compensatory models
presume that customers make trade-offs of
one attribute for another in order to make a
decision, i.e. a weakness in one attribute is
compensated by strength in another. In a
hotel stay example, if the guestroom was
small and uncomfortable, but the service was
good, the resultant overall satisfaction with
the hotel experience might still be high; small
and uncomfortable room was traded-off with
good service, because both of them were of
equal importance to the customer. Weighted
compensatory models (sometimes referred to
as expectancy-value models) also assume that
people have a measurement of belief about
the existence of an attribute, but that each
attribute has an importance weight relative
to other attributes. Using this model in our
previous example, we might conclude that
because guestroom quality was rated higher
in its relative importance than service was,
the resultant overall satisfaction with the
hotel experience will be dissatisfaction.
Non-compensatory models (no trade-offs of
attributes) can take one of two forms:
conjunctive or disjunctive. In conjunctive
models consumers establish a minimum
acceptable level for each important product
attribute and make a choice (or become
satisfied) only if each attribute equals or
exceeds the minimum level. In a restaurant
example each of the three attributes of
quality of food and beverage, quality of the
service, and the ambiance of the restaurant
will have to pass a threshold before overall
satisfaction will occur. If ambiance did not
pass this threshold, no matter how good the
food and the service was, the result is overall
dissatisfaction.
Disjunctive models are similar to conjunc-
tive models, with one exception. Rather than
establishing a minimum level on all impor-
tant attributes, in conjunctive models
consumers establish such levels only on one
or a few attributes, e.g. the food in our
restaurant example (Lewis and Chambers,
1989, p, 157).
Research evidence conducted in tourism
and hospitality enterprises (Mazursky, 1989;
Cadotte and Turgeon, 1988) support the
disjunctive models. In a study conducted in
1978 among 432 foodservice firms represent-
ing 22,000 foodservice units, Cadotte and
Turgeon asked company executives to list the
type and frequency of their guests'
complaints and compliments. As indicated in
Table I, the data from the surveys suggest
that:
. . .some restaurant attributes are more likely
to earn guest complaints than compliments.
Availability of parking, hours of operation,
traffic congestion, noise level, and spacious-
ness of the establishment all appear in the
top-ten complaint list... In contrast, guests
express appreciation for high performance in
some areas, but rarely complain when per-
formance is so-so. The survey results suggest
that guest react favorably to a clean neat
restaurant, neat employees, ample portions,
and responsiveness to complaints. The qual-
ity and quantity of service, food quality,
helpfulness of the employees, and the prices
of drinks, meals and other services appear in
both the list of most frequent complaints and
the list of the most frequent compliments
(Cadotte and Turgeon, 1988, p. 47).
Following these findings, Cadotte and Turgeon
divided the attributes into the following four
categories: satisfiers, dissatisfiers, critical and
neutral. Satisfiers, were those attributes
where unusual performance apparently
elicited compliments and satisfaction, but
average performance or even the absence of
the feature did not cause dissatisfaction or
complaints. Large-size food portions, smartly
dressed employees, clean and neat restaurants
are all examples of a restaurant satisfier.
Normal food portions, regularly dressed
employees and not so neat restaurants do not
Figure 1
Hospitality service quality gap
[ 331 ]
Abraham Pizam and
Taylor Ellis
Customer satisfaction and its
measurement in hospitality
enterprises
International Journal of
Contemporary Hospitality
Management
11/7 [1999] 326±339
Downloaded by VICTORIA UNIVERSITY (Australia) At 21:12 11 April 2019 (PT)
Paraphrase This Document
Need a fresh take? Get an instant paraphrase of this document with our AI Paraphraser
cause dissatisfaction. In contrast, large food
portions and well-groomed and smartly
dressed employees please the restaurant guest.
``Satisfiers, represent an opportunity to shine,
to move ahead of the pack, and to stand out
from the crowd'' (Cadotte and Turgeon, 1988,
p. 51).
Dissatisfiers were more likely to earn a
complaint for low performance or absence of
a desired feature than anything else. But an
operation that exceeds the threshold perfor-
mance standard apparently will not receive
compliments on the attribute. Parking and
excessive noise are good examples of dis-
satisfiers; they have to be provided and
maintained at a minimum or sufficient level.
But efforts to achieve a higher performance
level will not be appreciated by customers
nor will it cause them satisfaction. ``Dis-
satisfiers particularly require management
control to prevent poor performance. Mini-
mum standards should be established, and
the focus should be on maintaining these
standards.... Be as good as your competition,
but do not waste resources trying to be
better. . '' (Cadotte and Turgeon, p. 51).
Critical attributes were capable of eliciting
both complaints (dissatisfactions) and
compliments (satisfactions), depending on
the situation. Quality of service, food quality
and helpful attitude of employees ranked
high in eliciting both complaints and
compliments. Critical factors deserve special
attention, because of their potential for both
hurting and helping a business. ``Like dis-
satisfiers, minimum standards must be set to
avoid negative responses to your service. For
the critical attributes, the objective is to raise
performance beyond the norm'' (Cadotte and
Turgeon, p. 51).
Neutral attributes neither received a great
number of compliments nor many
complaints, therefore probably indicating
that they were either not salient to guests or
easily brought up to guests' standards.
Cadotte and Turgeon draw our attention to
the fact that the classification of these factors
is not permanent but constantly changes.
Some dissatisfier type attributes were
probably critical at one time. Higher
industry standards, though, may have
improved performance to the extent that
most restaurants are able to meet guest
requirements on these factors. For example,
in warm climates, the availability of reliable
air conditioning in hotels or restaurants was
a critical factor; today, with the advent of
modern refrigeration technology, all hotels
and restaurants in such climates will have it.
Having more of it will not satisfy anyone, but
when air-conditioning breaks down,
suddenly everyone becomes dissatisfied.
If Cadotte and Turgeon's findings are con-
firmed by other studies, we might indeed
revise the prevailing theory about the nature
of customer satisfaction/dissatisfaction and
reject the notion that satisfaction and
dissatisfaction are two extremes on one con-
tinuum. Instead, we might accept a
modification of a theory that was advanced
some years ago on the subject of job satisfac-
tion. In this theory, Herzberg et al. (1959)
proposed that job satisfaction and dissatisfac-
tion are two extremes on two continua. On
one continuum ± the motivation continuum ±
we have satisfaction versus no-satisfaction,
while on the other ± the hygiene continuum ±
we have dissatisfaction versus no-dissatisfac-
tion. In Herzberg's opinion, the variables the
presence or absence of which cause satisfac-
tion or no-satisfaction, are not the same that
cause dissatisfaction or no-dissatisfaction.
While Herzberg confirmed his theory by using
a particular research method ± the critical
incident ± few other researchers managed to
duplicate his results by using alternative
methods. In the majority of cases, it was found
that though some variables operate solely on
Table I
Comparative rankings of food service attribute compliments and
complaints
Attribute Complaint rankCompliment rank Category
Availability of parking 1 19
Traffic congestion in establishment 2 26
Noise level 5 24 Dissatisfier
Spaciousness of establishment 8 18
Hours of operation 9 20
Cleanliness of establishement 14 4
Neatness of establishment 11 5
Size of portions 12 5 Satisfier
Employee appearance 17 7
Responsiveness to complaints 20 9
Quality of service 3 1
Food quality 7 2
Helpful attitude of employees 6 3 Critical
Quantity of service 10 8
Prices of drinks, meals and service 4 10
Management knoweldge of service 23 11
Availability of food on menu 16 12
Beverage quality 24 13
Variety of service 21 14
Uniformity of establishment appearance 26 15
Quality of advertising 25 16 Neutral
Convenience of location 15 17
Quietness of surroundings 18 21
Accuracy of bill 19 22
Litter outside restaurant 22 23
Reservations system 13 25
Source: Cadotte and Turgeon, 1998, p. 46
[ 332 ]
Abraham Pizam and
Taylor Ellis
Customer satisfaction and its
measurement in hospitality
enterprises
International Journal of
Contemporary Hospitality
Management
11/7 [1999] 326±339
Downloaded by VICTORIA UNIVERSITY (Australia) At 21:12 11 April 2019 (PT)
one continuum (i.e. working conditions were
found to be a hygiene factor, or dissatisfier),
others (i.e. salary) appeared in both the
hygiene (dissatisfier) continuum as well as
the motivator (satisfier) continuum. Applying
the same rationale to Cadotte and Turgeon's
findings, one might conclude that if supported
by other studies, customer satisfaction/dissa-
tisfaction could also be explained as a process
operating in three continua: the first for
satisfaction, the second for dissatisfaction and
the third (critical) for common factors that
can cause both satisfaction as well as dissa-
tisfaction.
But until such time we must still operate
under the assumption that satisfaction and
dissatisfaction are two extremes that operate
on one continuum. Therefore we propose that
customers' overall satisfaction with a hospi-
tality service encounter is a sum total of the
difference between their perceived outcome
and expectations relating to a group of
weighted attributes, some of which carry
minimum thresholds, plus an additional
mysterious factor which Gronroos (1984)
calls image and Lewis calls overall feeling
(Lewis, 1987, pp. 84-85). The following equa-
tion (modified from Lewis and Chambers,
1989, p. 157) gives a mathematical depiction of
overall customer satisfaction:
Ajk
X nWik Bijk
with
Bijk > I
where
Ajk = consumer k's overall satisfaction
score for hospitality enterprise j,
Wik = the importance weight assigned by
consumer k to attribute i,
Bijk = consumer k's rating of the amount of
attribute i offered by enterprise j,
n = the number of product/service
attributes, and
I = a minimum level (threshold).
As to the question of identifying the indivi-
dual attributes in the hospitality experience,
and determining their relative importance
weights as well as their minimum threshold
levels, the answer to that has to be deter-
mined by each enterprise for each customer
segment. However, based on previous re-
search findings it is possible to identify these
attributes and determine their relative im-
portance among consumers of certain pro-
ducts/services. By using a particular
technique called the Importance/
Performance Analysis (IPA) hospitality and
tourism researchers such as Evans and Chon
(1989), Green (1993), Chacko and Dimanche
(1994), Martin (1995), Duke and Persia (1996),
Vaske et al. (1996), Opperman (1996), Mount
(1997), Go and Zhang (1997), Oh and Parks
(1998), Hudson and Shepard (1998) managed
to identify not only the gaps between the
customer and service provider perception of
quality, but also determine the gap between
importance and performance.
Following Reuland et al. (1985) we suggest
that a hospitality experience consists of the
following elements which can be classified
into three groups: the material product, the
environment, and the behaviour and attitude
of the employees. For example in a restau-
rant case the material product would be the
food and beverage, the environment would be
the physical attributes of the restaurant, and
the behaviour and attitude would be the
restaurant's staff conduct before and during
the meal (see Table II).
Measuring customer satisfaction
1. Key measurement issues
Customer satisfaction measurement (CSM)
serves two roles, providing information and
enabling communication with customers.
Perhaps the primary reason for taking the
time to measure customer satisfaction is to
collect information, either regarding what
customers say that needs to be done differ-
ently or to assess how well an organization is
currently meeting its customer needs (Vavra,
1997, p. 28). A secondary, but no less impor-
tant function of CSM in hospitality enter-
prises, is that by surveying customers, an
organization is demonstrating its interest in
communicating with its customers ± finding
out their needs, pleasures, displeasures and
overall well-being. Though it is impossible to
measure the satisfaction of every single
customer, those whose opinions are solicited
and others who observe this process, are
given a sense of importance and recognition.
The reasons for measuring customer
satisfaction may vary from organization to
organization. Naumann (1995) however,
suggested the following five objectives that in
his opinion are the most common.
1 To get close to the customer ± understand
what attributes are the most important to
customers, find which attributes affect the
customer's decision making, the relative
importance of the attributes and get a
performance evaluation of how well the
firm is delivering each attribute.
2 Measure continuous improvement ± the
attributes significant to the customer are
linked directly to value-added processes in
the firm and are put into a form consistent
with the internal measurements used to
evaluate the process.
[ 333 ]
Abraham Pizam and
Taylor Ellis
Customer satisfaction and its
measurement in hospitality
enterprises
International Journal of
Contemporary Hospitality
Management
11/7 [1999] 326±339
Downloaded by VICTORIA UNIVERSITY (Australia) At 21:12 11 April 2019 (PT)
⊘ This is a preview!⊘
Do you want full access?
Subscribe today to unlock all pages.
Trusted by 1+ million students worldwide
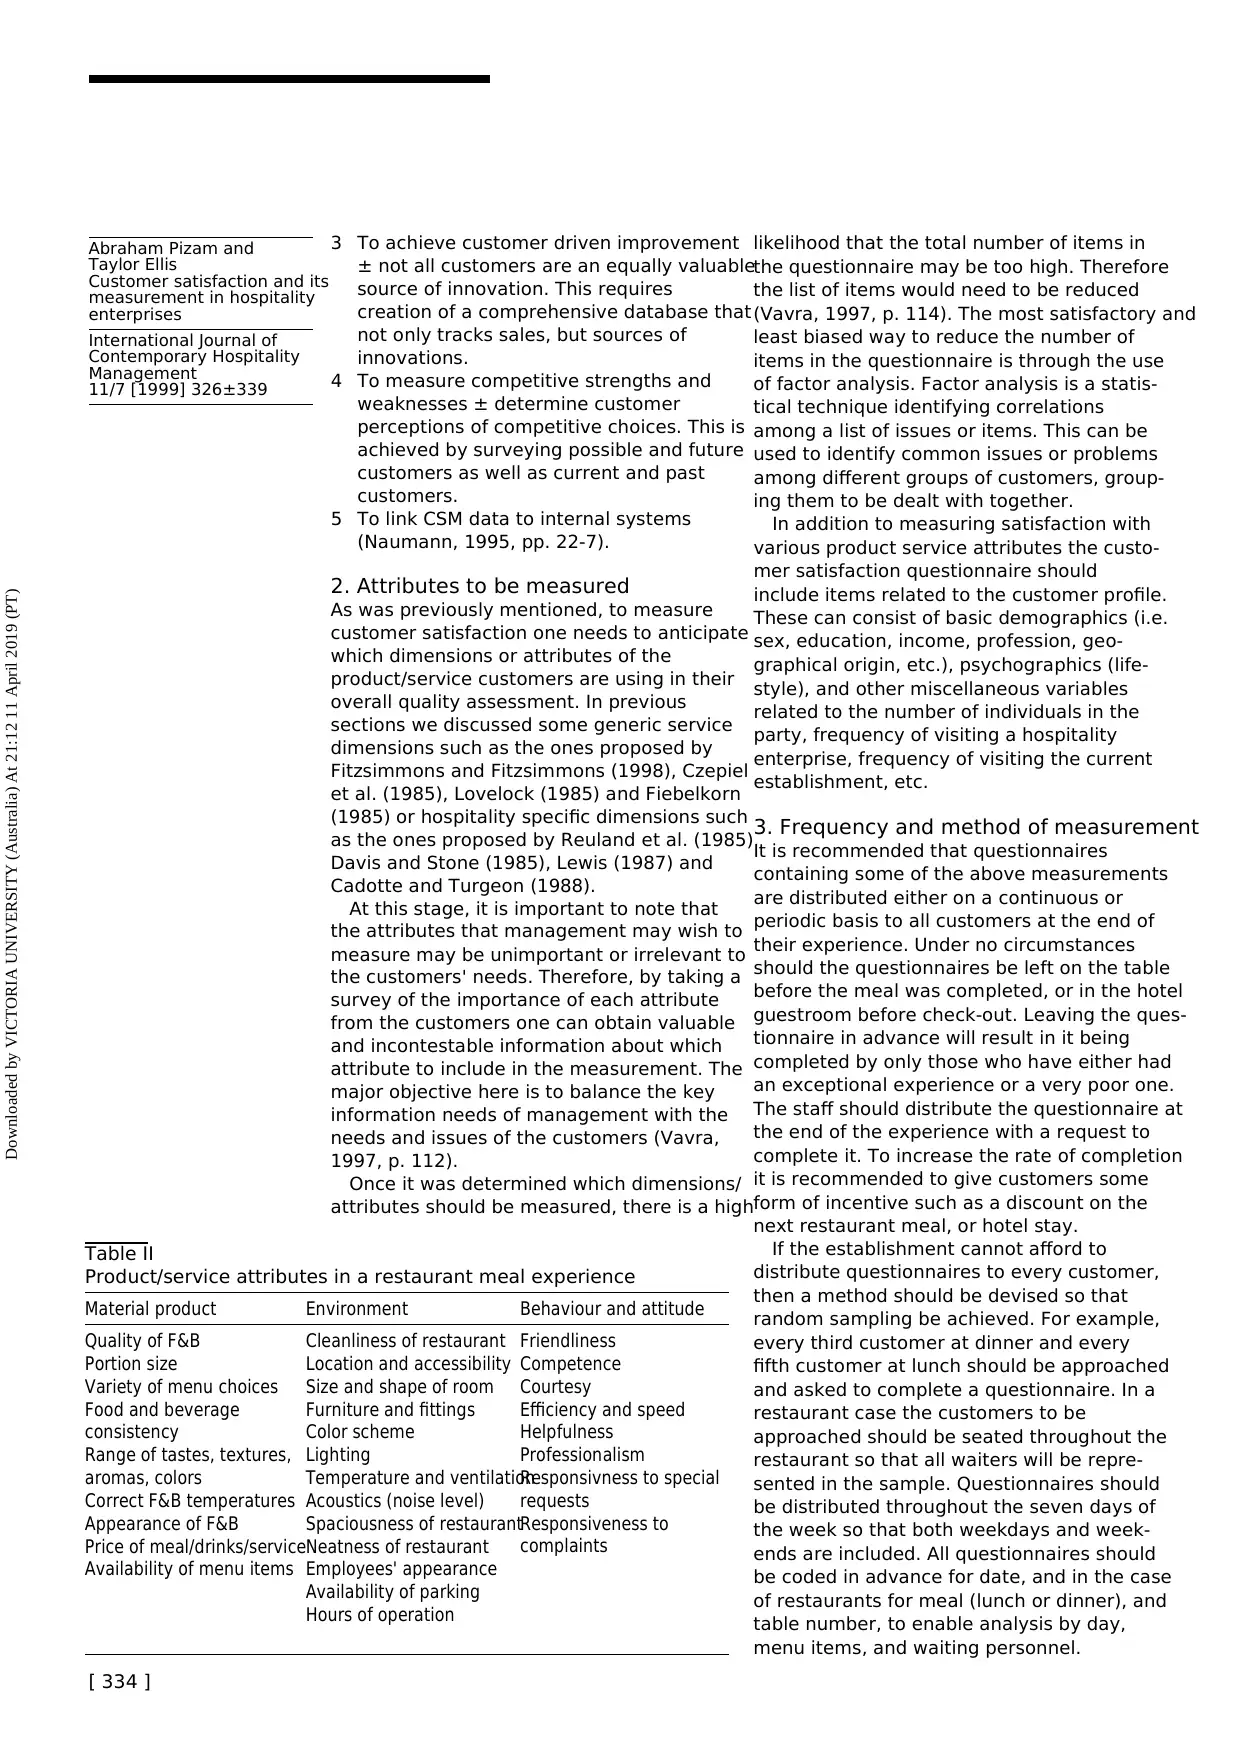
3 To achieve customer driven improvement
± not all customers are an equally valuable
source of innovation. This requires
creation of a comprehensive database that
not only tracks sales, but sources of
innovations.
4 To measure competitive strengths and
weaknesses ± determine customer
perceptions of competitive choices. This is
achieved by surveying possible and future
customers as well as current and past
customers.
5 To link CSM data to internal systems
(Naumann, 1995, pp. 22-7).
2. Attributes to be measured
As was previously mentioned, to measure
customer satisfaction one needs to anticipate
which dimensions or attributes of the
product/service customers are using in their
overall quality assessment. In previous
sections we discussed some generic service
dimensions such as the ones proposed by
Fitzsimmons and Fitzsimmons (1998), Czepiel
et al. (1985), Lovelock (1985) and Fiebelkorn
(1985) or hospitality specific dimensions such
as the ones proposed by Reuland et al. (1985)
Davis and Stone (1985), Lewis (1987) and
Cadotte and Turgeon (1988).
At this stage, it is important to note that
the attributes that management may wish to
measure may be unimportant or irrelevant to
the customers' needs. Therefore, by taking a
survey of the importance of each attribute
from the customers one can obtain valuable
and incontestable information about which
attribute to include in the measurement. The
major objective here is to balance the key
information needs of management with the
needs and issues of the customers (Vavra,
1997, p. 112).
Once it was determined which dimensions/
attributes should be measured, there is a high
likelihood that the total number of items in
the questionnaire may be too high. Therefore
the list of items would need to be reduced
(Vavra, 1997, p. 114). The most satisfactory and
least biased way to reduce the number of
items in the questionnaire is through the use
of factor analysis. Factor analysis is a statis-
tical technique identifying correlations
among a list of issues or items. This can be
used to identify common issues or problems
among different groups of customers, group-
ing them to be dealt with together.
In addition to measuring satisfaction with
various product service attributes the custo-
mer satisfaction questionnaire should
include items related to the customer profile.
These can consist of basic demographics (i.e.
sex, education, income, profession, geo-
graphical origin, etc.), psychographics (life-
style), and other miscellaneous variables
related to the number of individuals in the
party, frequency of visiting a hospitality
enterprise, frequency of visiting the current
establishment, etc.
3. Frequency and method of measurement
It is recommended that questionnaires
containing some of the above measurements
are distributed either on a continuous or
periodic basis to all customers at the end of
their experience. Under no circumstances
should the questionnaires be left on the table
before the meal was completed, or in the hotel
guestroom before check-out. Leaving the ques-
tionnaire in advance will result in it being
completed by only those who have either had
an exceptional experience or a very poor one.
The staff should distribute the questionnaire at
the end of the experience with a request to
complete it. To increase the rate of completion
it is recommended to give customers some
form of incentive such as a discount on the
next restaurant meal, or hotel stay.
If the establishment cannot afford to
distribute questionnaires to every customer,
then a method should be devised so that
random sampling be achieved. For example,
every third customer at dinner and every
fifth customer at lunch should be approached
and asked to complete a questionnaire. In a
restaurant case the customers to be
approached should be seated throughout the
restaurant so that all waiters will be repre-
sented in the sample. Questionnaires should
be distributed throughout the seven days of
the week so that both weekdays and week-
ends are included. All questionnaires should
be coded in advance for date, and in the case
of restaurants for meal (lunch or dinner), and
table number, to enable analysis by day,
menu items, and waiting personnel.
Table II
Product/service attributes in a restaurant meal experience
Material product Environment Behaviour and attitude
Quality of F&B
Portion size
Variety of menu choices
Food and beverage
consistency
Range of tastes, textures,
aromas, colors
Correct F&B temperatures
Appearance of F&B
Price of meal/drinks/service
Availability of menu items
Cleanliness of restaurant
Location and accessibility
Size and shape of room
Furniture and fittings
Color scheme
Lighting
Temperature and ventilation
Acoustics (noise level)
Spaciousness of restaurant
Neatness of restaurant
Employees' appearance
Availability of parking
Hours of operation
Friendliness
Competence
Courtesy
Efficiency and speed
Helpfulness
Professionalism
Responsivness to special
requests
Responsiveness to
complaints
[ 334 ]
Abraham Pizam and
Taylor Ellis
Customer satisfaction and its
measurement in hospitality
enterprises
International Journal of
Contemporary Hospitality
Management
11/7 [1999] 326±339
Downloaded by VICTORIA UNIVERSITY (Australia) At 21:12 11 April 2019 (PT)
Paraphrase This Document
Need a fresh take? Get an instant paraphrase of this document with our AI Paraphraser
4. Data analysis
The analysis of the data should be conducted
on a weekly basis and the results compared
with previous weeks. The mean and standard
deviation should be computed for the global/
overall satisfaction variables as well as for
each of the product/service attributes. To
understand better the satisfaction/dissatis-
factions of each market segment, it is
recommended that separate analyses be
conducted for each identifiable market
segment (i.e. leisure travellers, business
travellers, conventioneers, etc.).
To determine the relative importance
(weights) of each product/service attribute,
an establishment can either conduct a
periodic study to determine how customers
themselves rate these, or alternatively deter-
mine the weights by running a multiple
regression with the global satisfaction
variable as the dependent variable and each
of the product/service attributes as the
independent variables. The beta weights for
each independent variable in the regression
will be equivalent to the importance rates of
the attributes. Since the relative importance
of product/service attributes changes from
time to time, it is recommended that these
weights be computed at least once a year and
if possible more than that.
Global issues and cultural
differences in customer satisfaction
When designing global customer satisfaction
measurements, regional and cultural aspects
must be taken into account. And indeed,
studies conducted by Chadee and Mattsson
(1995) and Scott and Shieff (1993) found
significant cross-cultural differences when
measuring customer satisfaction. Services
and products important to Asians may be
completely different from those sought by
Europeans. Culture has an impact on
perception, problem solving and cognition
and often leads to differences in satisfaction
levels for a single product between different
global customers. Global customers may
have different expectations, different ways of
evaluating performance, differing uses of
response scale formats and may be influ-
enced differently by the number of response
positions in any question scale (Vavra, 1997,
p. 430).
The majority of customer satisfaction
research is done in industrialized economies,
leaving very little research conducted in
Africa, the Middle East, South America,
Latin America and large portions of Asia.
The question therefore is what can be done to
avoid the confounds and problems of global
cross-cultural customer satisfaction
research? To start with, it is critical that the
satisfaction survey design, process and data
be as comparable across countries as possi-
ble. If results of a country are used only
within that country, equivalence is not an
issue; if the results are to be used to gain a
global picture, compatibility is essential.
Differing languages, levels of literacy, inter-
pretations of constructs and cultural beha-
viour must all be taken into account when
creating a foreign customer satisfaction
survey. Similar survey designs may or may
not be usable in different socio-cultural
environments or even within a single work
environment as language and culture may
not be homogeneous with a customers'
corporation or work place.
To deal with the differences of socio-
cultural behaviours, Vavra suggests looking
into the ``emic-etic dilemma''. An ``Emic''
approach is based on recognition of the
differences between cultures and acknow-
ledging the importance of each culture's
idiosyncrasies. This would constitute creat-
ing a different survey, with different ques-
tions, a different method of measurement and
administration for each different culture. An
``Etic'' approach is based on the belief that
certain industry standards, requirements,
values and behaviours are continuous and
transcend. This would allow for a ``universal''
type of evaluation to be developed and used
cross-culturally. There are benefits to using
either mode of evaluation, but there are also
problems inherent in each method. In the
``Emic'' approach it is much more difficult to
compare results from different cultures and
each cultural evaluation is highly subjective
to misinterpretation by evaluators from
differing cultures. Should the ``Etic''
approach be used, caution must be used not
to apply it in an unchecked manner or abuse
the measures ± imposing them on cultures
without the adaptation or sensitivity to use
the evaluative materials correctly (Vavra,
1997, p. 431-2).
Whether the ``Etic'' or ``Emic'' approach is
used to evaluate global customers' satis-
faction some sort of equivalence must be
established within and between surveys.
Vavra has identified the following two major
categories of equivalence that should be
considered when creating or administering
international customer satisfaction surveys:
Establishing Equivalence
. Construct equivalence: This is the most
basic form of equivalence. Basically this is
asking whether or not a construct or
phenomenon actually exists in another
culture. It should never be assumed that a
construct exists in another culture with-
[ 335 ]
Abraham Pizam and
Taylor Ellis
Customer satisfaction and its
measurement in hospitality
enterprises
International Journal of
Contemporary Hospitality
Management
11/7 [1999] 326±339
Downloaded by VICTORIA UNIVERSITY (Australia) At 21:12 11 April 2019 (PT)
out extensive qualitative research
demonstrating its cultural existence.
. Conceptual equivalence: Concepts may be
culturally hidebound. For example, the
concept of ``indifference'' may not exist
within another culture's parameters.
. Functional equivalence: This addresses the
question of whether or not products and
services are expected to deliver identical
functions across the various cultures.
Consumer goods may vary in sameness or
function.
. Category equivalence: The way objects,
stimuli and behaviour are grouped, varies
cross-culturally and may influence
customer response. An example of this is
making scales with fewer responses more
applicable in some cultures.
Measurement equivalence
. Scalar equivalence: Do corporate chosen
scales function similarly in different
cultures? It is a good idea to test a scale's
acceptance in a culture before applying it.
. Item/linguistic equivalence: The items in
the questionnaire must be able to be
translated in an accurate manner so that
the linguistic meaning remains similar
across cultures.
. Sample equivalence: There is a likelihood
that there might be a more homogenous
sample across cultures because all survey
participants will have chosen, purchased
and used the same product or service in
order to participate in the customer
satisfaction survey. This homogeneity
may not exist in other circumstances
(Vavra, 1997, p. 434).
When designing global or cross-cultural
satisfaction surveys, purchase behaviour
should also be taken into account. Product/
service categories and appropriateness/
relevance of different products will vary
cross-culturally (Vavra, 1997, p. 439). Also,
the way in which purchases are made is also
highly relevant. For example in the case of
customer satisfaction surveys for food shop-
pers the difference between Americans'
weekly supermarket trips and Asians' daily
trips to the market play a part in how these
surveys are constructed, utilized and to
whom they are administered.
Finally, the attitudes and psychographics of
customers must be taken into account when
writing surveys. Questions relating to life-
styles and individual values are subject to a
wide range of cultural interpretations. It is
important to take cultural values into account
when writing customer satisfaction surveys,
recognizing values that may be held in
common and making a special point to create
allowances for country or culture specific
concepts or measures. Knowledge of cultural
attitudes and taboos helps the surveyor to
create a courteous, understandable and
concise questionnaire (Vavra, 1997, p. 440).
A final consideration when administering
a questionnaire across multiple cultures is
the language to be used. Global customers
should be surveyed in their native language,
which necessitates the translation of the
instrument into the various languages
needed. The four main methods of translating
survey instruments are:
1 Direct translation ± the use of bilingual
translators to translate the original into
the required languages.
2 Back translation ± translation of the
questionnaire by a native speaking
bilingual into the desired language
followed by a translation back to the
original language by a another bilingual
native speaker.
3 De-centered translation ± the successive
translations and re-translations, so that
the final questionnaires employ terms and
phasing equally meaningful in both
languages.
4 Parallel translation ± the translation is
continually performed by a committee of
translators, all equally conversant in both
languages, until the committee agrees that
the questionnaires have near equal
meanings in both languages.
In conclusion, if properly designed, adminis-
tered and analyzed, the process of monitoring
customer satisfaction can be beneficial to any
hospitality enterprise and make the differ-
ence between offering a mediocre product
and an excellent, quality product.
References
Almanza, B.A., Jaffe, W. and Lin, L. (1994), ``Use of
the service attribute matrix to measure
consumer satisfaction'', Hospitality Research
Journal, Vol. 17 No. 2, pp. 63-75.
Assael, H. (1987), Consumer Behavior and
Marketing Action, 3rd ed., PWS-Kent, Boston.
Babakus, F. and Boller, G.W. (1992), ``An empirical
assessment of the SERVQUAL scale'', Journal
of Business Research, Vol. 24, pp. 253-68.
Band, W.A. (1991), Creating Value for Customers,
John Wiley, New York, NY.
Barsky, J.D. (1992), ``Customer satisfaction in the
hotel industry: meaning and measurement'',
Hospitality Research Journal, Vol. 16 No. 1,
pp. 51-73.
Barsky, J.D. and Labagh, R. (1992), ``Quality
management: a strategy for customer satisfac-
tion'', Cornell Hotel and Restaurant
Administration Quarterly, Vol. 33 No. 5,
pp. 32-7.
[ 336 ]
Abraham Pizam and
Taylor Ellis
Customer satisfaction and its
measurement in hospitality
enterprises
International Journal of
Contemporary Hospitality
Management
11/7 [1999] 326±339
Downloaded by VICTORIA UNIVERSITY (Australia) At 21:12 11 April 2019 (PT)
⊘ This is a preview!⊘
Do you want full access?
Subscribe today to unlock all pages.
Trusted by 1+ million students worldwide
1 out of 24
Related Documents


Your All-in-One AI-Powered Toolkit for Academic Success.
+13062052269
info@desklib.com
Available 24*7 on WhatsApp / Email
![[object Object]](/_next/static/media/star-bottom.7253800d.svg)
Unlock your academic potential
Copyright © 2020–2026 A2Z Services. All Rights Reserved. Developed and managed by ZUCOL.