Analysis of Customer Satisfaction for Luke Althorp Retailer
VerifiedAdded on 2023/05/30
|62
|9676
|294
Report
AI Summary
This technical report, titled 'Customer Satisfaction,' analyzes the performance of Luke Althorp, a premium UK retailer, facing declining profits and high customer turnover. The report, addressed to CEO Ms. Gemma Hanson, delves into the root causes of the business's challenges, employing various analytical tools. It begins with stakeholder analysis and problem definition, followed by cause and effect diagrams, Pareto analysis, run charts, and the use of scatter plots and histograms to demonstrate issues like employee turnover and sales decline across departments. A force field analysis is also included to understand the driving and restraining forces affecting revenue generation. The report identifies key issues such as lack of employee engagement, poor human resource management, and insufficient inventory management as contributing factors to customer dissatisfaction and reduced profits. Appendices include supporting data like customer survey results, calculations, and staffing details. The report concludes with recommendations based on the findings to improve customer satisfaction and business performance.
Running head: CUSTOMER SATISFACTION
Name of the student
Degree
Subject
Semester
To,
Ms Gemma Hanson, CEO,
M/s Luke Althorp
Dear Madam,
Please find below the technical report titled ‘Customer Satisfaction’ for your kind perusal and
further decision making. It would be a great pleasure to hear from your end.
Regards,
Name and details of the sender,
……..
Paraphrase This Document
Need a fresh take? Get an instant paraphrase of this document with our AI Paraphraser
1
CUSTOMER SATISFACTION
Customer Satisfaction
Name of the Student
Name of the University
Author note
CUSTOMER SATISFACTION
Customer Satisfaction
Name of the Student
Name of the University
Author note
2
CUSTOMER SATISFACTION
Table of Contents
2. Technical Report:.........................................................................................................................3
2.1. Introduction:.............................................................................................................................3
2.2.1. Stakeholder analysis:.............................................................................................................4
2.2.2. Problem definition sheet:.......................................................................................................5
2.2.3. Cause and Effect:...................................................................................................................8
2.2.4. Pareto Analysis:.....................................................................................................................9
2.2.5. Run Charts:..........................................................................................................................12
2.2.6. Use of appropriate tools:......................................................................................................12
Scatter plots analysis:................................................................................................................13
Histogram analysis:...................................................................................................................13
Force Field Analysis:.................................................................................................................15
2.3. Conclusion:.............................................................................................................................15
2.4. Appendices:............................................................................................................................17
2.4.1. Pareto chart calculations:.................................................................................................17
2.4.2. Staffing:...........................................................................................................................27
2.4.3. LA customer survey:........................................................................................................28
2.4.4. Telephone Converstaion a few days after the meeting........................................................53
Appendix 2.4.5. Email regarding agency staff:.............................................................................56
References:....................................................................................................................................60
⊘ This is a preview!⊘
Do you want full access?
Subscribe today to unlock all pages.
Trusted by 1+ million students worldwide

3
CUSTOMER SATISFACTION
CUSTOMER SATISFACTION
Paraphrase This Document
Need a fresh take? Get an instant paraphrase of this document with our AI Paraphraser
4
CUSTOMER SATISFACTION
2. Technical Report:
2.1. Introduction:
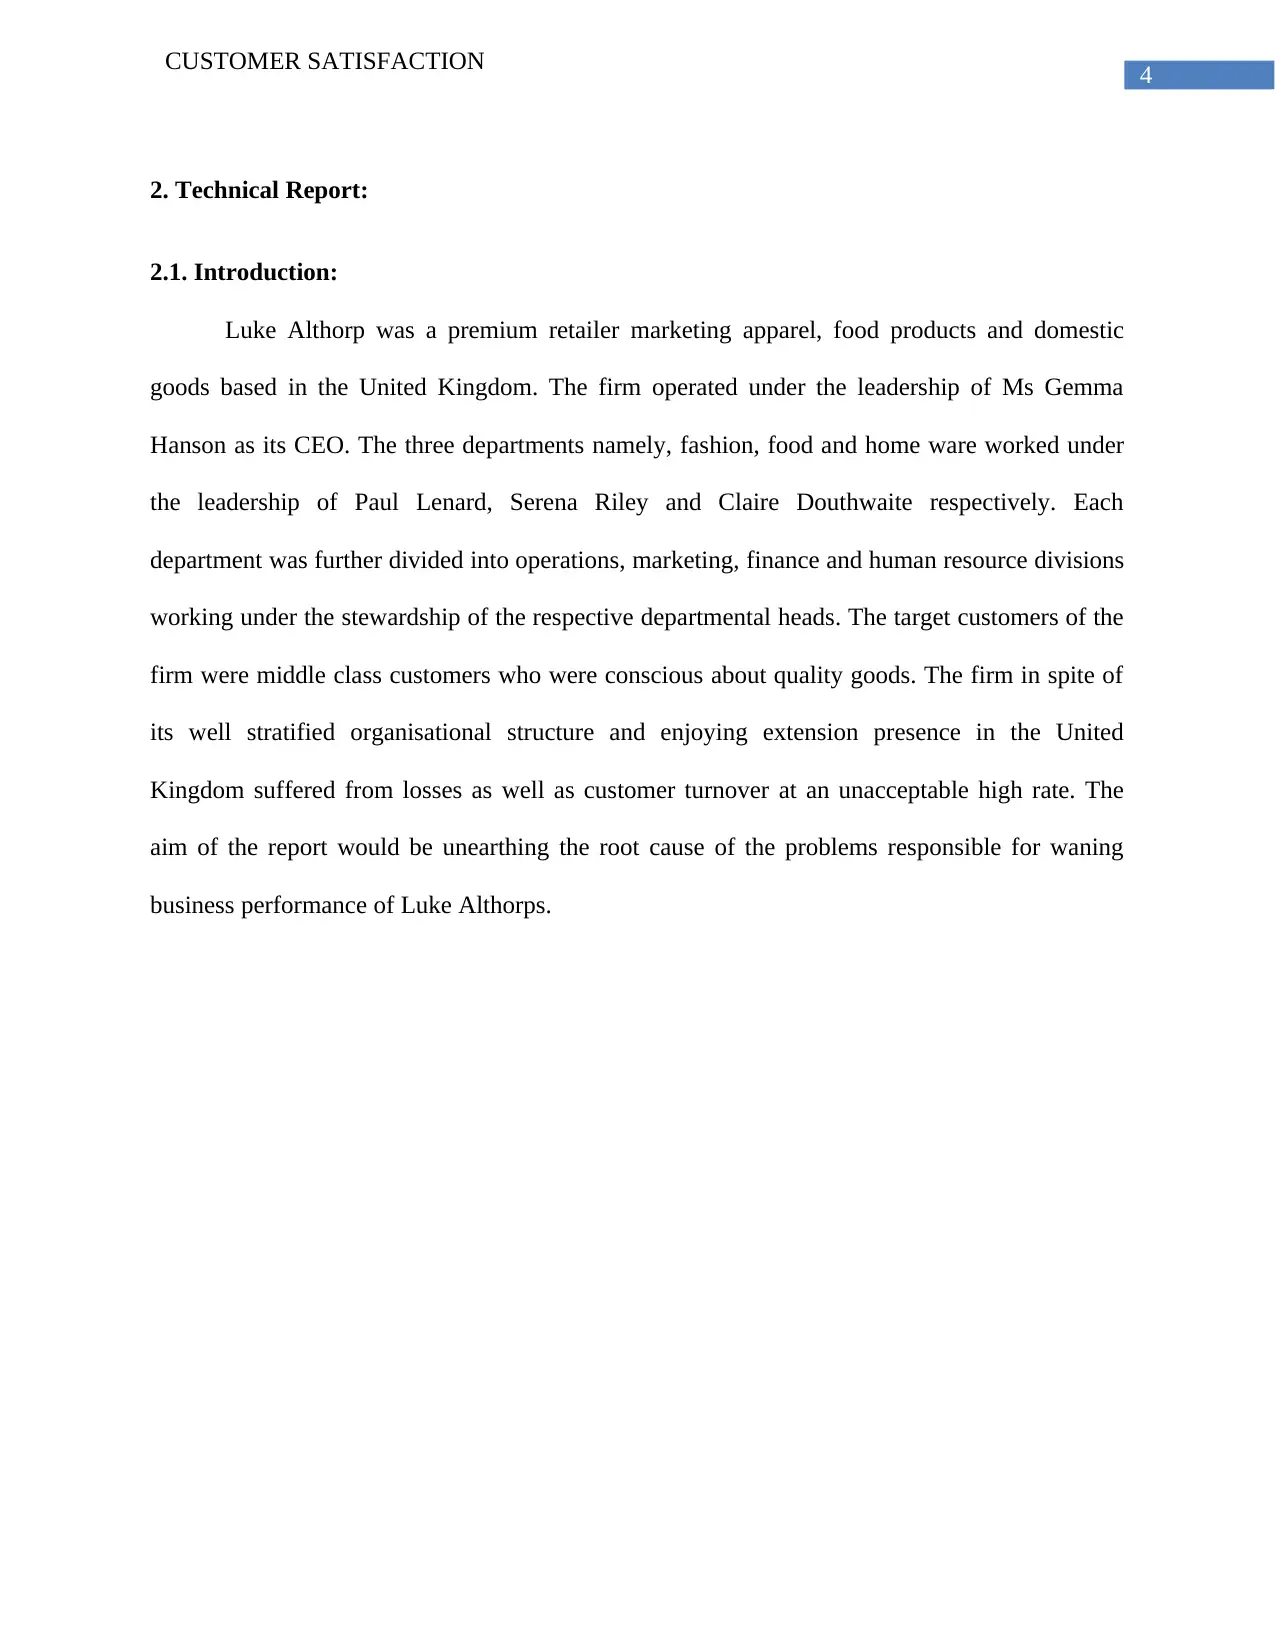
Luke Althorp was a premium retailer marketing apparel, food products and domestic
goods based in the United Kingdom. The firm operated under the leadership of Ms Gemma
Hanson as its CEO. The three departments namely, fashion, food and home ware worked under
the leadership of Paul Lenard, Serena Riley and Claire Douthwaite respectively. Each
department was further divided into operations, marketing, finance and human resource divisions
working under the stewardship of the respective departmental heads. The target customers of the
firm were middle class customers who were conscious about quality goods. The firm in spite of
its well stratified organisational structure and enjoying extension presence in the United
Kingdom suffered from losses as well as customer turnover at an unacceptable high rate. The
aim of the report would be unearthing the root cause of the problems responsible for waning
business performance of Luke Althorps.
CUSTOMER SATISFACTION
2. Technical Report:
2.1. Introduction:
Luke Althorp was a premium retailer marketing apparel, food products and domestic
goods based in the United Kingdom. The firm operated under the leadership of Ms Gemma
Hanson as its CEO. The three departments namely, fashion, food and home ware worked under
the leadership of Paul Lenard, Serena Riley and Claire Douthwaite respectively. Each
department was further divided into operations, marketing, finance and human resource divisions
working under the stewardship of the respective departmental heads. The target customers of the
firm were middle class customers who were conscious about quality goods. The firm in spite of
its well stratified organisational structure and enjoying extension presence in the United
Kingdom suffered from losses as well as customer turnover at an unacceptable high rate. The
aim of the report would be unearthing the root cause of the problems responsible for waning
business performance of Luke Althorps.
5
CUSTOMER SATISFACTION
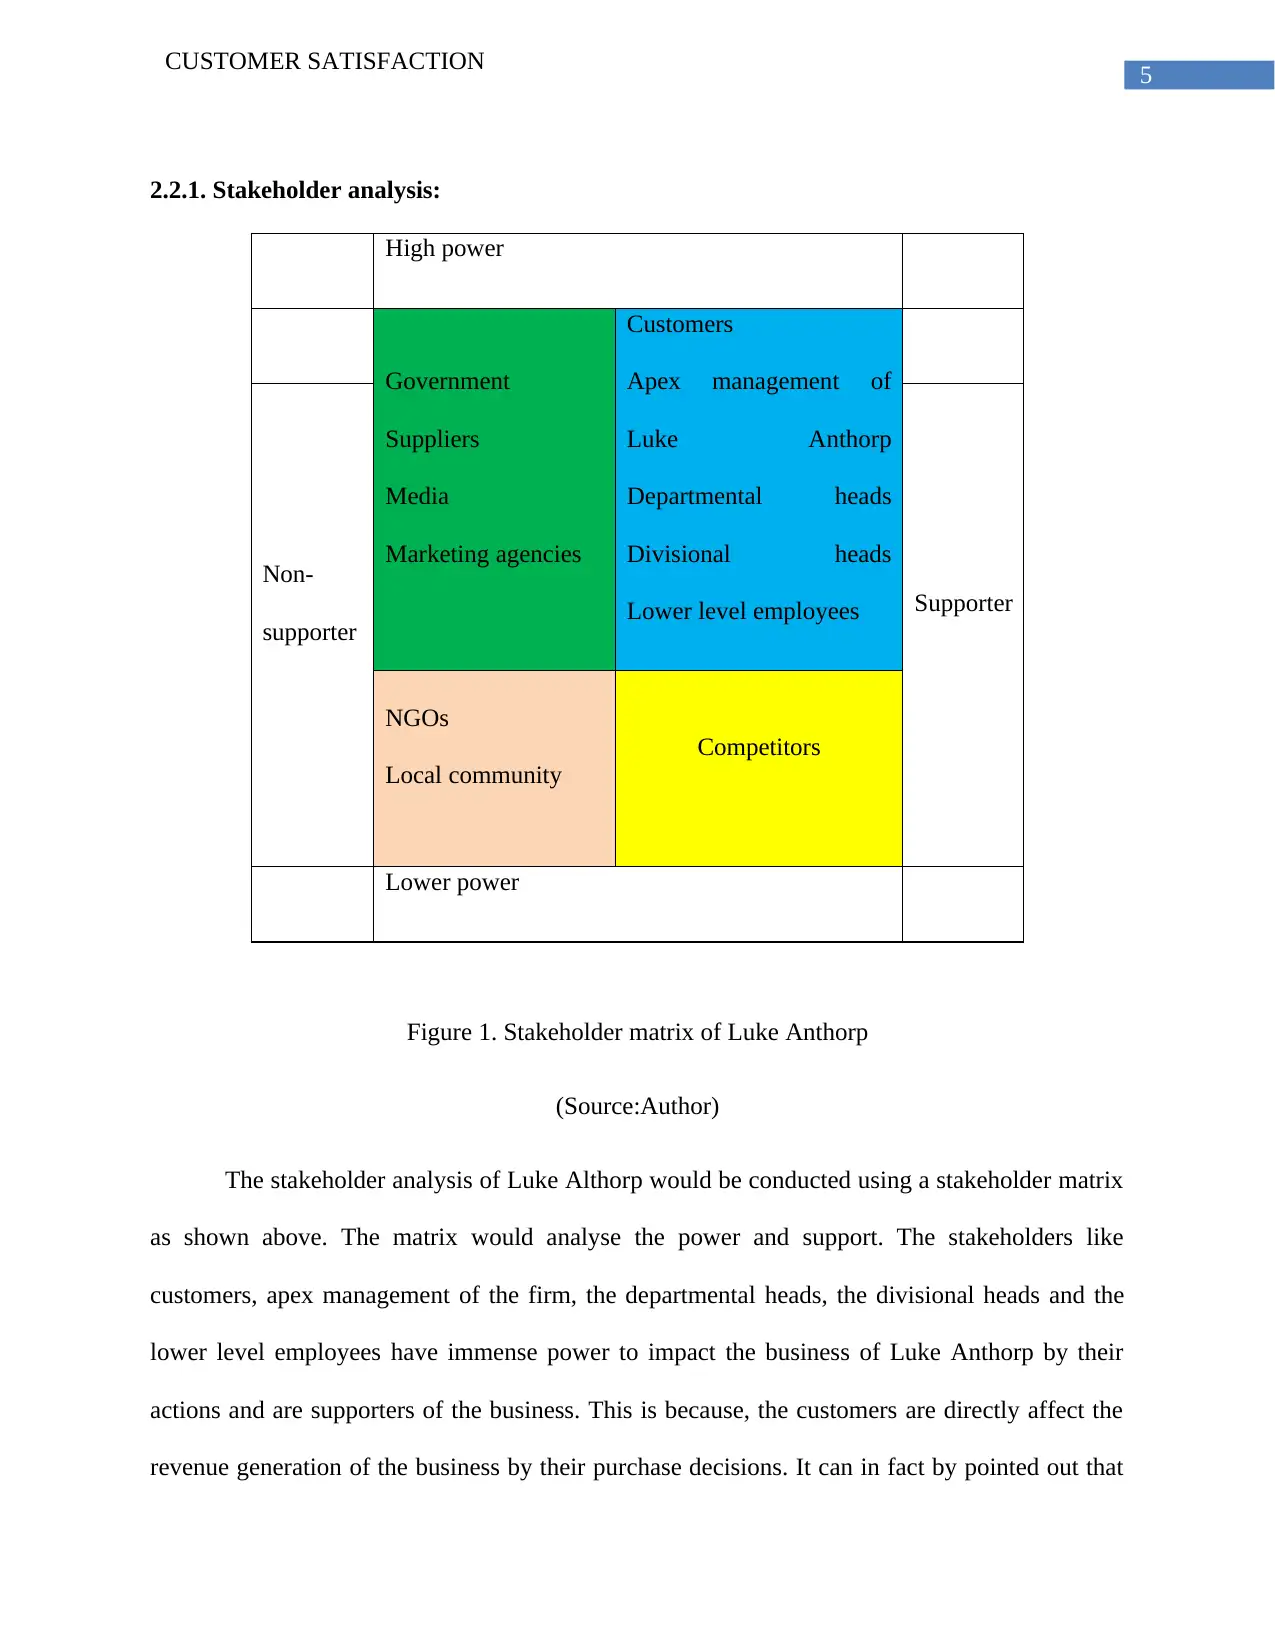
2.2.1. Stakeholder analysis:
High power
Government
Suppliers
Media
Marketing agencies
Customers
Apex management of
Luke Anthorp
Departmental heads
Divisional heads
Lower level employees
Non-
supporter
Supporter
NGOs
Local community
Competitors
Lower power
Figure 1. Stakeholder matrix of Luke Anthorp
(Source:Author)
The stakeholder analysis of Luke Althorp would be conducted using a stakeholder matrix
as shown above. The matrix would analyse the power and support. The stakeholders like
customers, apex management of the firm, the departmental heads, the divisional heads and the
lower level employees have immense power to impact the business of Luke Anthorp by their
actions and are supporters of the business. This is because, the customers are directly affect the
revenue generation of the business by their purchase decisions. It can in fact by pointed out that
CUSTOMER SATISFACTION
2.2.1. Stakeholder analysis:
High power
Government
Suppliers
Media
Marketing agencies
Customers
Apex management of
Luke Anthorp
Departmental heads
Divisional heads
Lower level employees
Non-
supporter
Supporter
NGOs
Local community
Competitors
Lower power
Figure 1. Stakeholder matrix of Luke Anthorp
(Source:Author)
The stakeholder analysis of Luke Althorp would be conducted using a stakeholder matrix
as shown above. The matrix would analyse the power and support. The stakeholders like
customers, apex management of the firm, the departmental heads, the divisional heads and the
lower level employees have immense power to impact the business of Luke Anthorp by their
actions and are supporters of the business. This is because, the customers are directly affect the
revenue generation of the business by their purchase decisions. It can in fact by pointed out that
⊘ This is a preview!⊘
Do you want full access?
Subscribe today to unlock all pages.
Trusted by 1+ million students worldwide
6
CUSTOMER SATISFACTION
the reason for rising loss of the firm was customers deciding against buying products form Luke
Anthorp. The apex management is a stakeholder holding high power and providing high support
since it is responsible for making business decisions. The middle level management formed by
departmental heads and divisional heads breakdown the strategies of the apex management into
further divisions for the lower level employees to execute them. The lower level employees are
also capable impacting the business directly by their actions. It can be pointed out that the
business of Luke Anthorp was suffering losses because the lower level employees showed lack
of interest in serving customers. Thus it is evident that businesses need continuous support of all
the above mentioned stakeholders which actually prove their high power. The suppliers in the
figure above occupy the first quadrant since they have high powers but their support is only
required after response of customers which is demand for products. The staff members
communicate the demands by placing the orders. That is why the suppliers occupy the first
quadrant with the government. This is because like suppliers the latter is not directly involved in
the product planning of the firm. The competitors, NGOs and local communities occupy the
lower positions in the matrix.
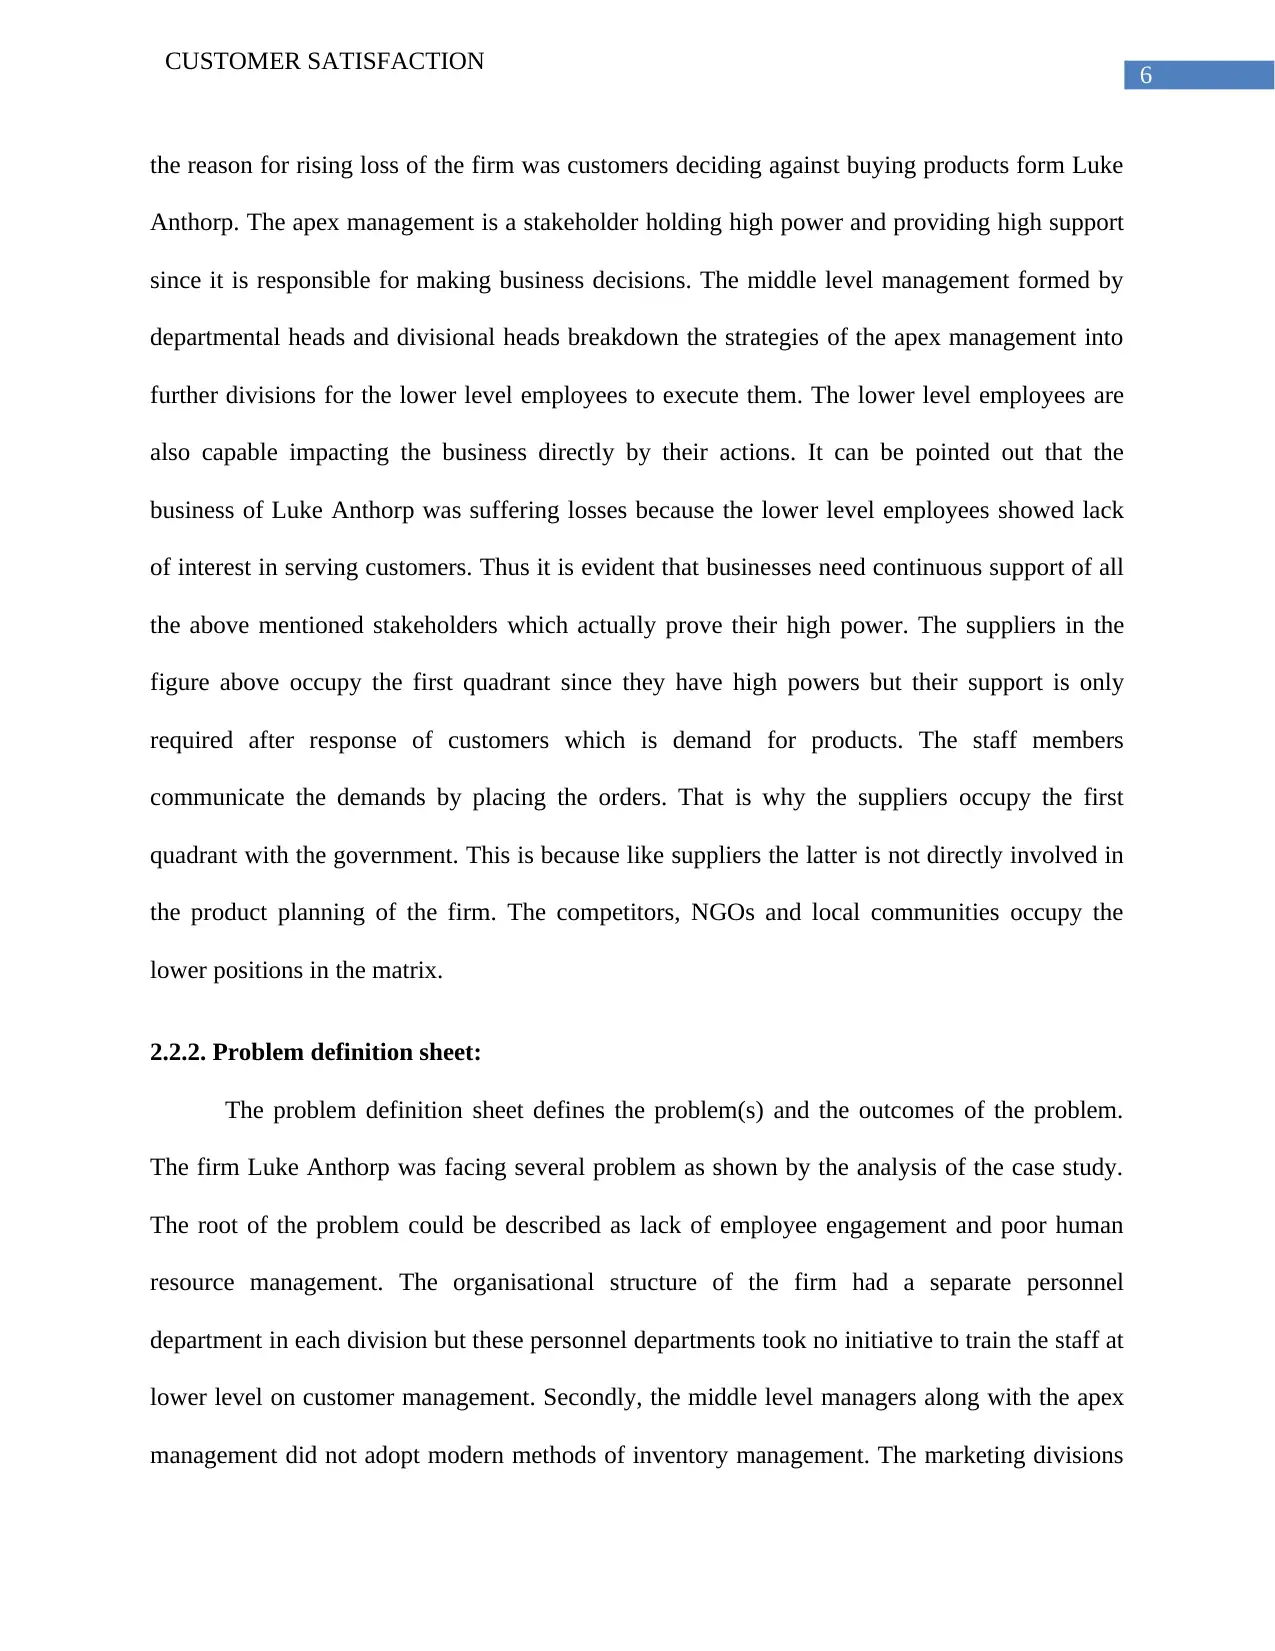
2.2.2. Problem definition sheet:
The problem definition sheet defines the problem(s) and the outcomes of the problem.
The firm Luke Anthorp was facing several problem as shown by the analysis of the case study.
The root of the problem could be described as lack of employee engagement and poor human
resource management. The organisational structure of the firm had a separate personnel
department in each division but these personnel departments took no initiative to train the staff at
lower level on customer management. Secondly, the middle level managers along with the apex
management did not adopt modern methods of inventory management. The marketing divisions
CUSTOMER SATISFACTION
the reason for rising loss of the firm was customers deciding against buying products form Luke
Anthorp. The apex management is a stakeholder holding high power and providing high support
since it is responsible for making business decisions. The middle level management formed by
departmental heads and divisional heads breakdown the strategies of the apex management into
further divisions for the lower level employees to execute them. The lower level employees are
also capable impacting the business directly by their actions. It can be pointed out that the
business of Luke Anthorp was suffering losses because the lower level employees showed lack
of interest in serving customers. Thus it is evident that businesses need continuous support of all
the above mentioned stakeholders which actually prove their high power. The suppliers in the
figure above occupy the first quadrant since they have high powers but their support is only
required after response of customers which is demand for products. The staff members
communicate the demands by placing the orders. That is why the suppliers occupy the first
quadrant with the government. This is because like suppliers the latter is not directly involved in
the product planning of the firm. The competitors, NGOs and local communities occupy the
lower positions in the matrix.
2.2.2. Problem definition sheet:
The problem definition sheet defines the problem(s) and the outcomes of the problem.
The firm Luke Anthorp was facing several problem as shown by the analysis of the case study.
The root of the problem could be described as lack of employee engagement and poor human
resource management. The organisational structure of the firm had a separate personnel
department in each division but these personnel departments took no initiative to train the staff at
lower level on customer management. Secondly, the middle level managers along with the apex
management did not adopt modern methods of inventory management. The marketing divisions
Paraphrase This Document
Need a fresh take? Get an instant paraphrase of this document with our AI Paraphraser
7
CUSTOMER SATISFACTION
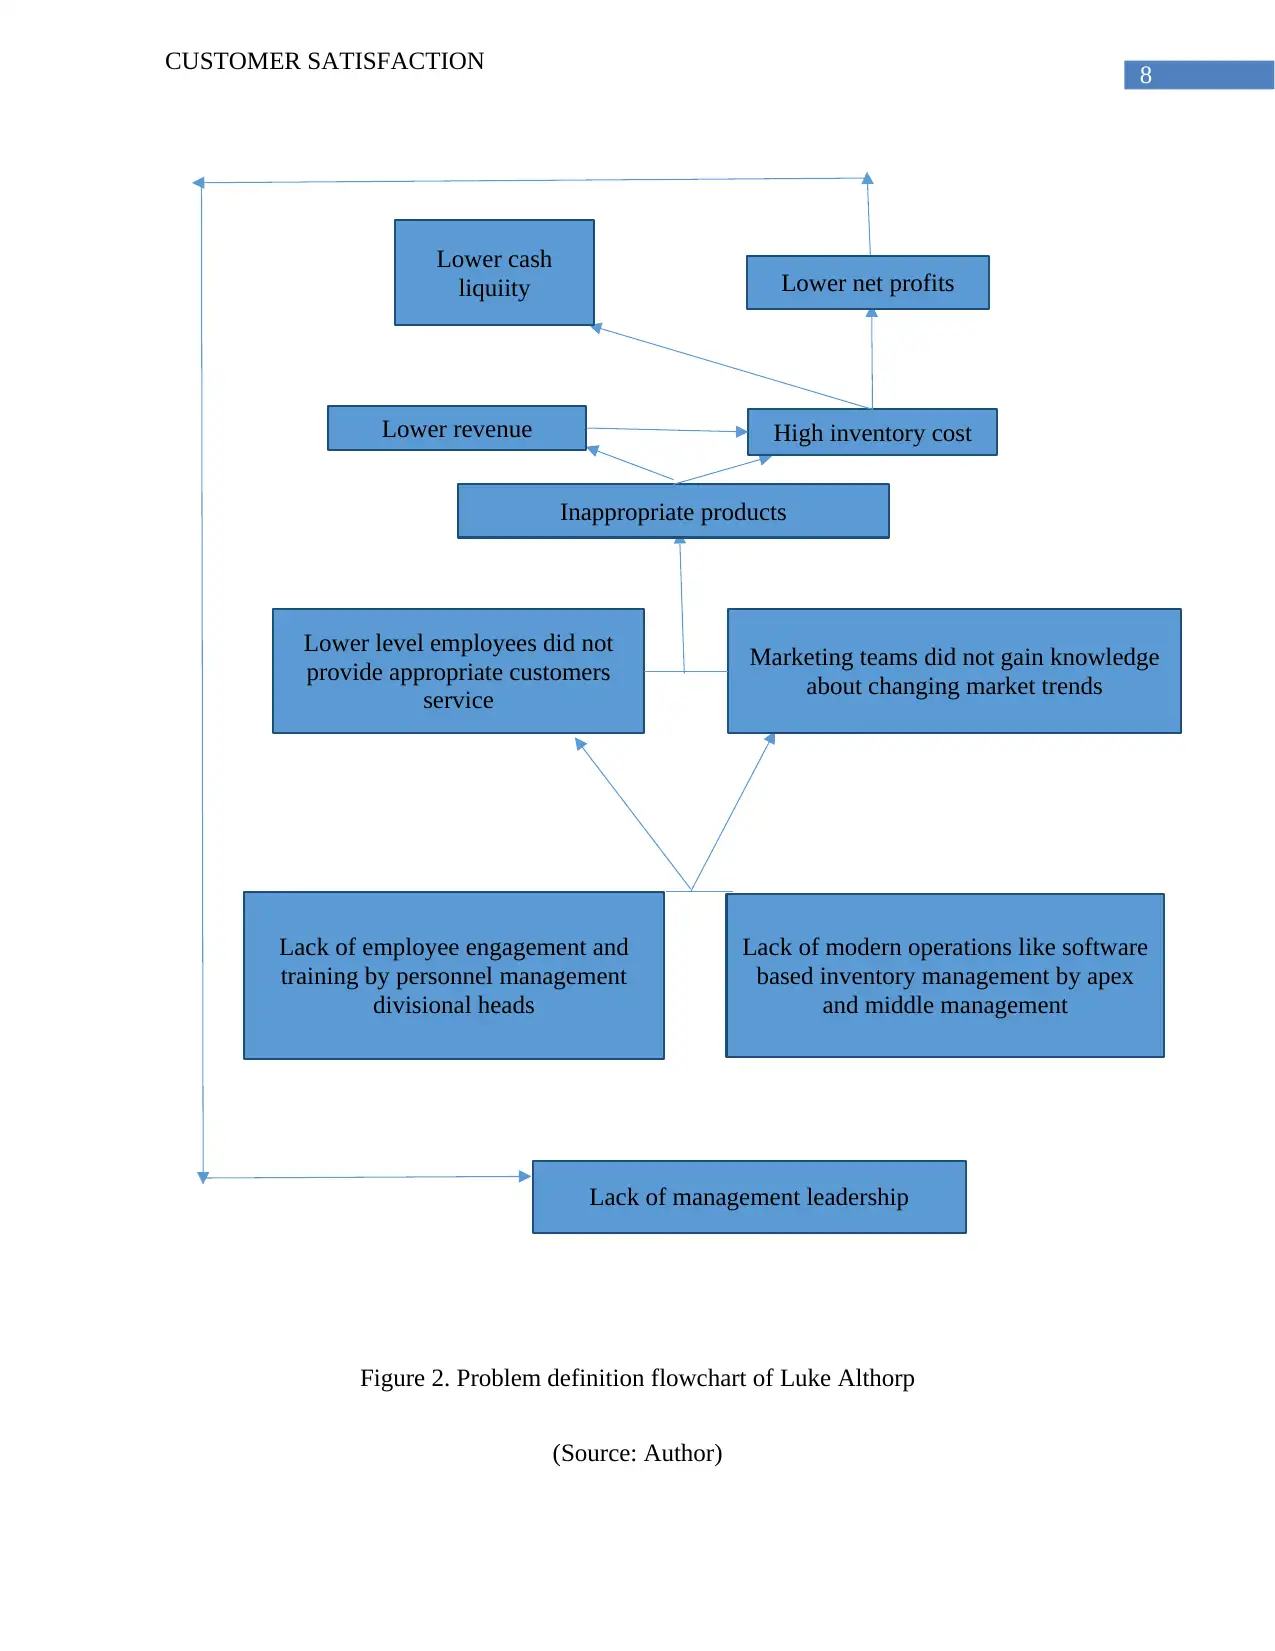
under each department did not acquire information about changing customer preferences and as a
result, the supply of products at the outlets could satisfy customers’ needs. This disparity
between demand from consumers and supply of products from the side of the firm led to lower
profits. In fact, it can be pointed out that immense amount liquid cash was locked in the stock of
finished goods, thus disrupting the liquidity of the firm. The repulsion of customers led to
waning revenue generation which only added to the high amount losses the firm suffered due to
wastage of products. The above definition statement would be presented in form of a flow chart
below:
CUSTOMER SATISFACTION
under each department did not acquire information about changing customer preferences and as a
result, the supply of products at the outlets could satisfy customers’ needs. This disparity
between demand from consumers and supply of products from the side of the firm led to lower
profits. In fact, it can be pointed out that immense amount liquid cash was locked in the stock of
finished goods, thus disrupting the liquidity of the firm. The repulsion of customers led to
waning revenue generation which only added to the high amount losses the firm suffered due to
wastage of products. The above definition statement would be presented in form of a flow chart
below:
Lack of employee engagement and
training by personnel management
divisional heads
Lack of modern operations like software
based inventory management by apex
and middle management
Marketing teams did not gain knowledge
about changing market trends
Lower level employees did not
provide appropriate customers
service
Inappropriate products
Lower revenue High inventory cost
Lower net profits
Lower cash
liquiity
Lack of management leadership
8
CUSTOMER SATISFACTION
Figure 2. Problem definition flowchart of Luke Althorp
(Source: Author)
⊘ This is a preview!⊘
Do you want full access?
Subscribe today to unlock all pages.
Trusted by 1+ million students worldwide
Declining
profits
Lack of staff training
and retention
Lack of customer
service by employees
Lack of inventory
management
Lack of customer
knowledge
9
CUSTOMER SATISFACTION
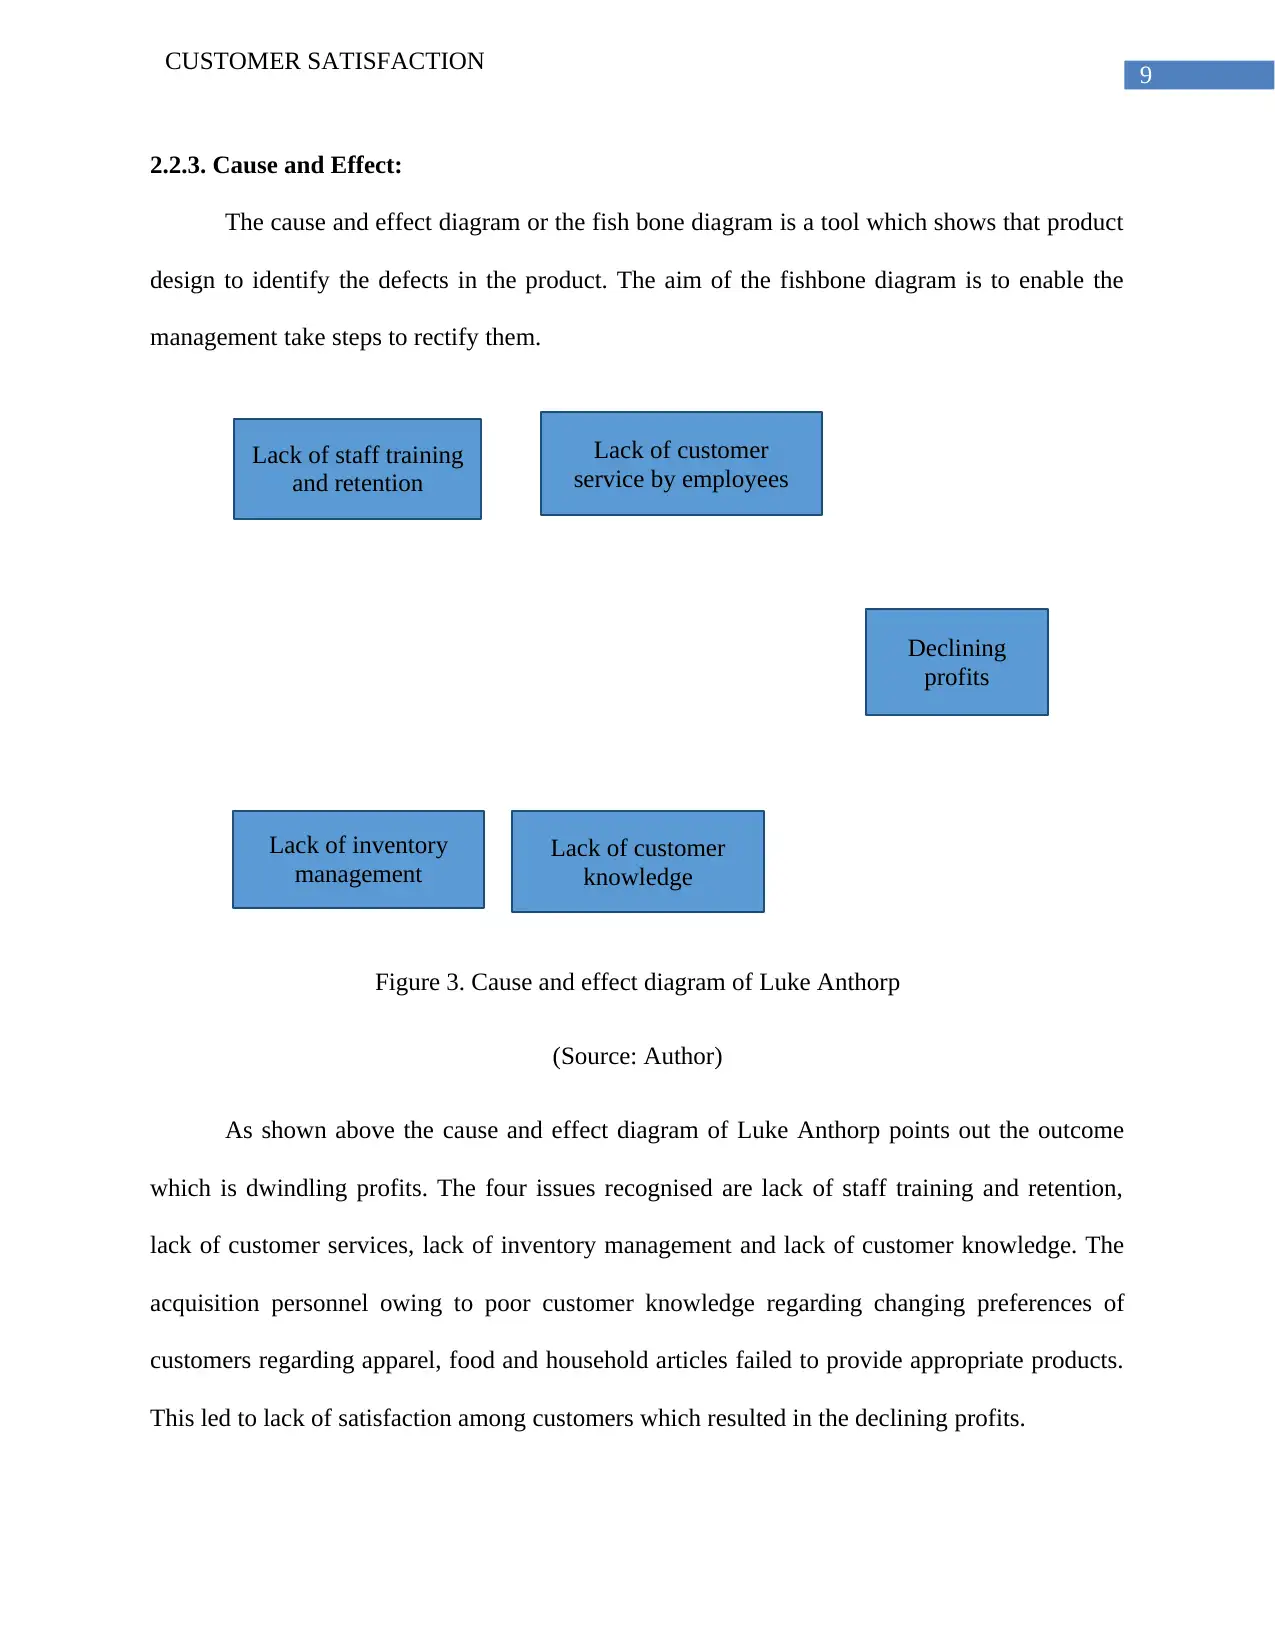
2.2.3. Cause and Effect:
The cause and effect diagram or the fish bone diagram is a tool which shows that product
design to identify the defects in the product. The aim of the fishbone diagram is to enable the
management take steps to rectify them.
Figure 3. Cause and effect diagram of Luke Anthorp
(Source: Author)
As shown above the cause and effect diagram of Luke Anthorp points out the outcome
which is dwindling profits. The four issues recognised are lack of staff training and retention,
lack of customer services, lack of inventory management and lack of customer knowledge. The
acquisition personnel owing to poor customer knowledge regarding changing preferences of
customers regarding apparel, food and household articles failed to provide appropriate products.
This led to lack of satisfaction among customers which resulted in the declining profits.
profits
Lack of staff training
and retention
Lack of customer
service by employees
Lack of inventory
management
Lack of customer
knowledge
9
CUSTOMER SATISFACTION
2.2.3. Cause and Effect:
The cause and effect diagram or the fish bone diagram is a tool which shows that product
design to identify the defects in the product. The aim of the fishbone diagram is to enable the
management take steps to rectify them.
Figure 3. Cause and effect diagram of Luke Anthorp
(Source: Author)
As shown above the cause and effect diagram of Luke Anthorp points out the outcome
which is dwindling profits. The four issues recognised are lack of staff training and retention,
lack of customer services, lack of inventory management and lack of customer knowledge. The
acquisition personnel owing to poor customer knowledge regarding changing preferences of
customers regarding apparel, food and household articles failed to provide appropriate products.
This led to lack of satisfaction among customers which resulted in the declining profits.
Paraphrase This Document
Need a fresh take? Get an instant paraphrase of this document with our AI Paraphraser
10
CUSTOMER SATISFACTION
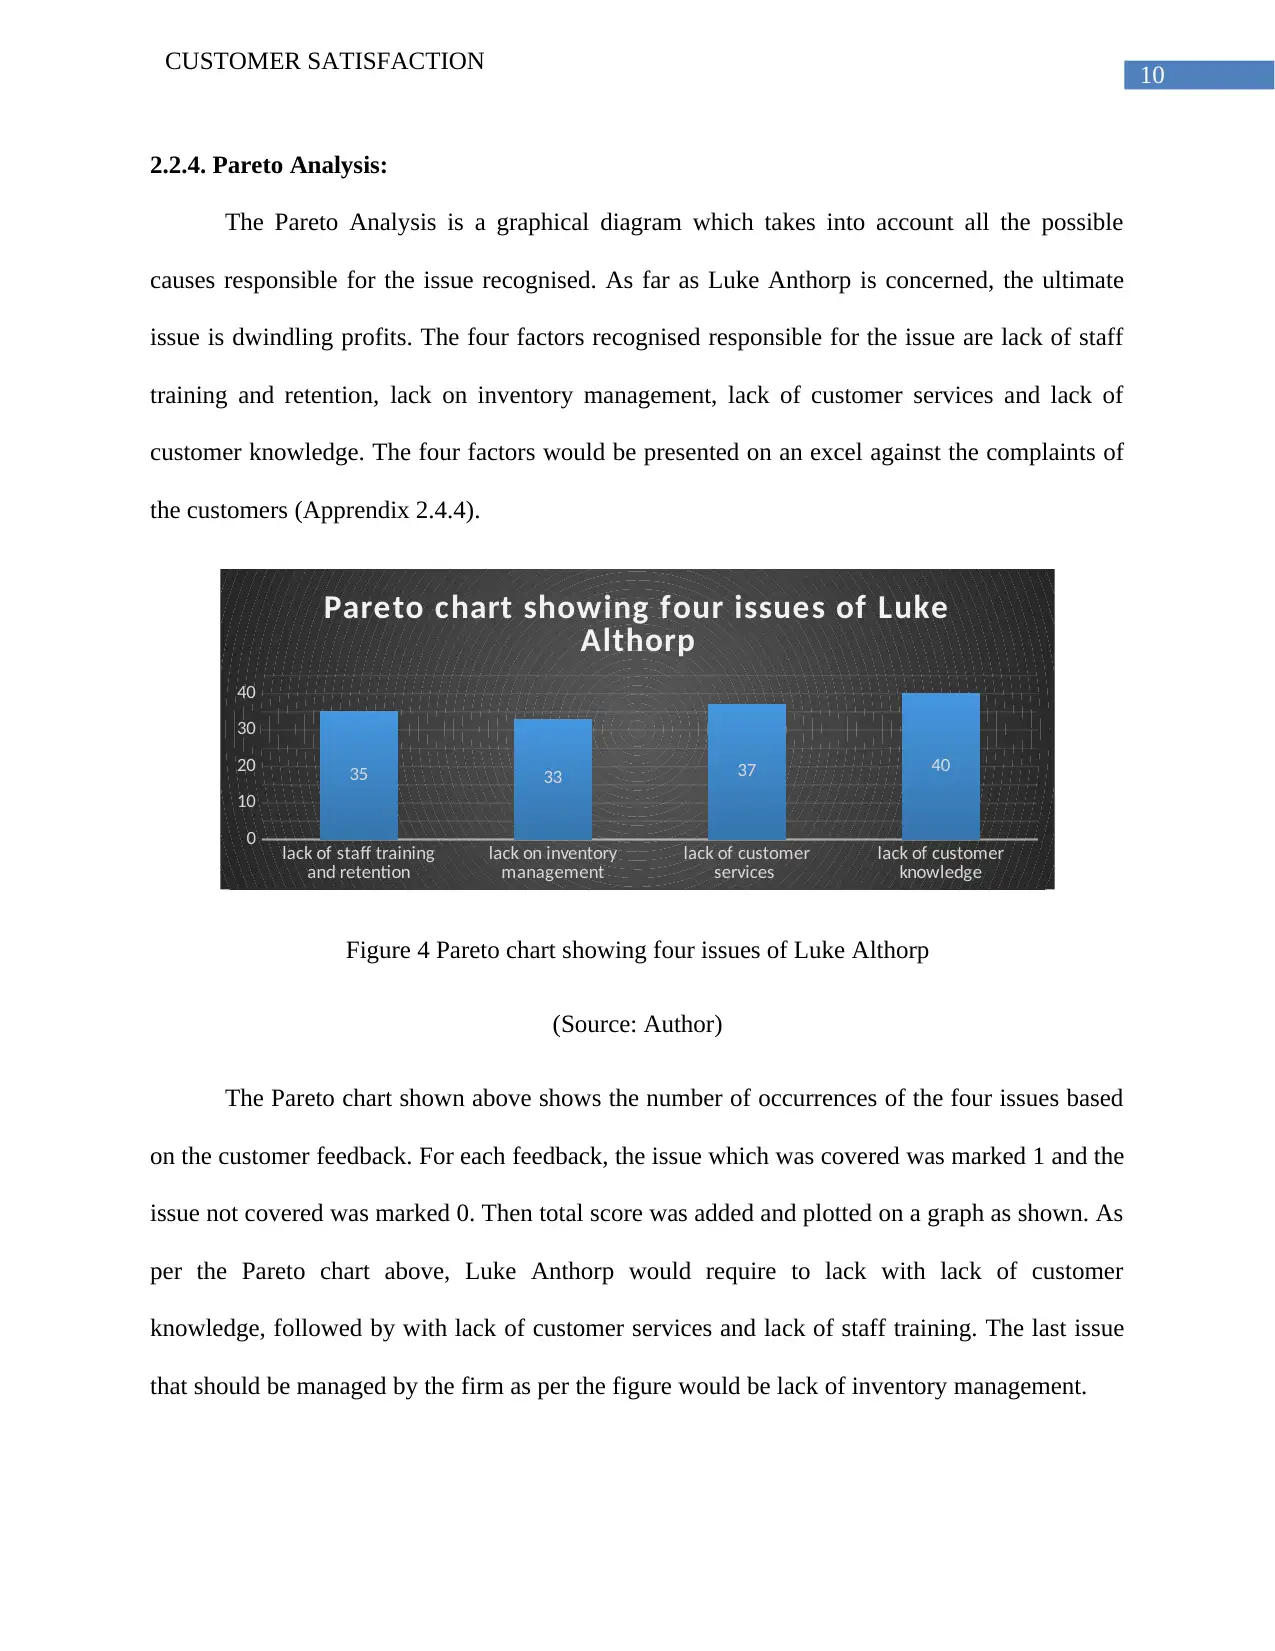
2.2.4. Pareto Analysis:
The Pareto Analysis is a graphical diagram which takes into account all the possible
causes responsible for the issue recognised. As far as Luke Anthorp is concerned, the ultimate
issue is dwindling profits. The four factors recognised responsible for the issue are lack of staff
training and retention, lack on inventory management, lack of customer services and lack of
customer knowledge. The four factors would be presented on an excel against the complaints of
the customers (Apprendix 2.4.4).
lack of staff training
and retention lack on inventory
management lack of customer
services lack of customer
knowledge
0
10
20
30
40
35 33 37 40
Pareto chart showing four issues of Luke
Althorp
Figure 4 Pareto chart showing four issues of Luke Althorp
(Source: Author)
The Pareto chart shown above shows the number of occurrences of the four issues based
on the customer feedback. For each feedback, the issue which was covered was marked 1 and the
issue not covered was marked 0. Then total score was added and plotted on a graph as shown. As
per the Pareto chart above, Luke Anthorp would require to lack with lack of customer
knowledge, followed by with lack of customer services and lack of staff training. The last issue
that should be managed by the firm as per the figure would be lack of inventory management.
CUSTOMER SATISFACTION
2.2.4. Pareto Analysis:
The Pareto Analysis is a graphical diagram which takes into account all the possible
causes responsible for the issue recognised. As far as Luke Anthorp is concerned, the ultimate
issue is dwindling profits. The four factors recognised responsible for the issue are lack of staff
training and retention, lack on inventory management, lack of customer services and lack of
customer knowledge. The four factors would be presented on an excel against the complaints of
the customers (Apprendix 2.4.4).
lack of staff training
and retention lack on inventory
management lack of customer
services lack of customer
knowledge
0
10
20
30
40
35 33 37 40
Pareto chart showing four issues of Luke
Althorp
Figure 4 Pareto chart showing four issues of Luke Althorp
(Source: Author)
The Pareto chart shown above shows the number of occurrences of the four issues based
on the customer feedback. For each feedback, the issue which was covered was marked 1 and the
issue not covered was marked 0. Then total score was added and plotted on a graph as shown. As
per the Pareto chart above, Luke Anthorp would require to lack with lack of customer
knowledge, followed by with lack of customer services and lack of staff training. The last issue
that should be managed by the firm as per the figure would be lack of inventory management.
11
CUSTOMER SATISFACTION
Oct
Nov
Dec
Jan
Feb
Mar
Apr
May
Jun
Jul
Aug
Sep
Oct
Nov
Dec
Jan
Feb
Mar
Apr
May
Jun
Jul
Aug
Sep
Oct
Nov
Dec
2017 2018
0
5
10
15
20
25
Homeware turnover
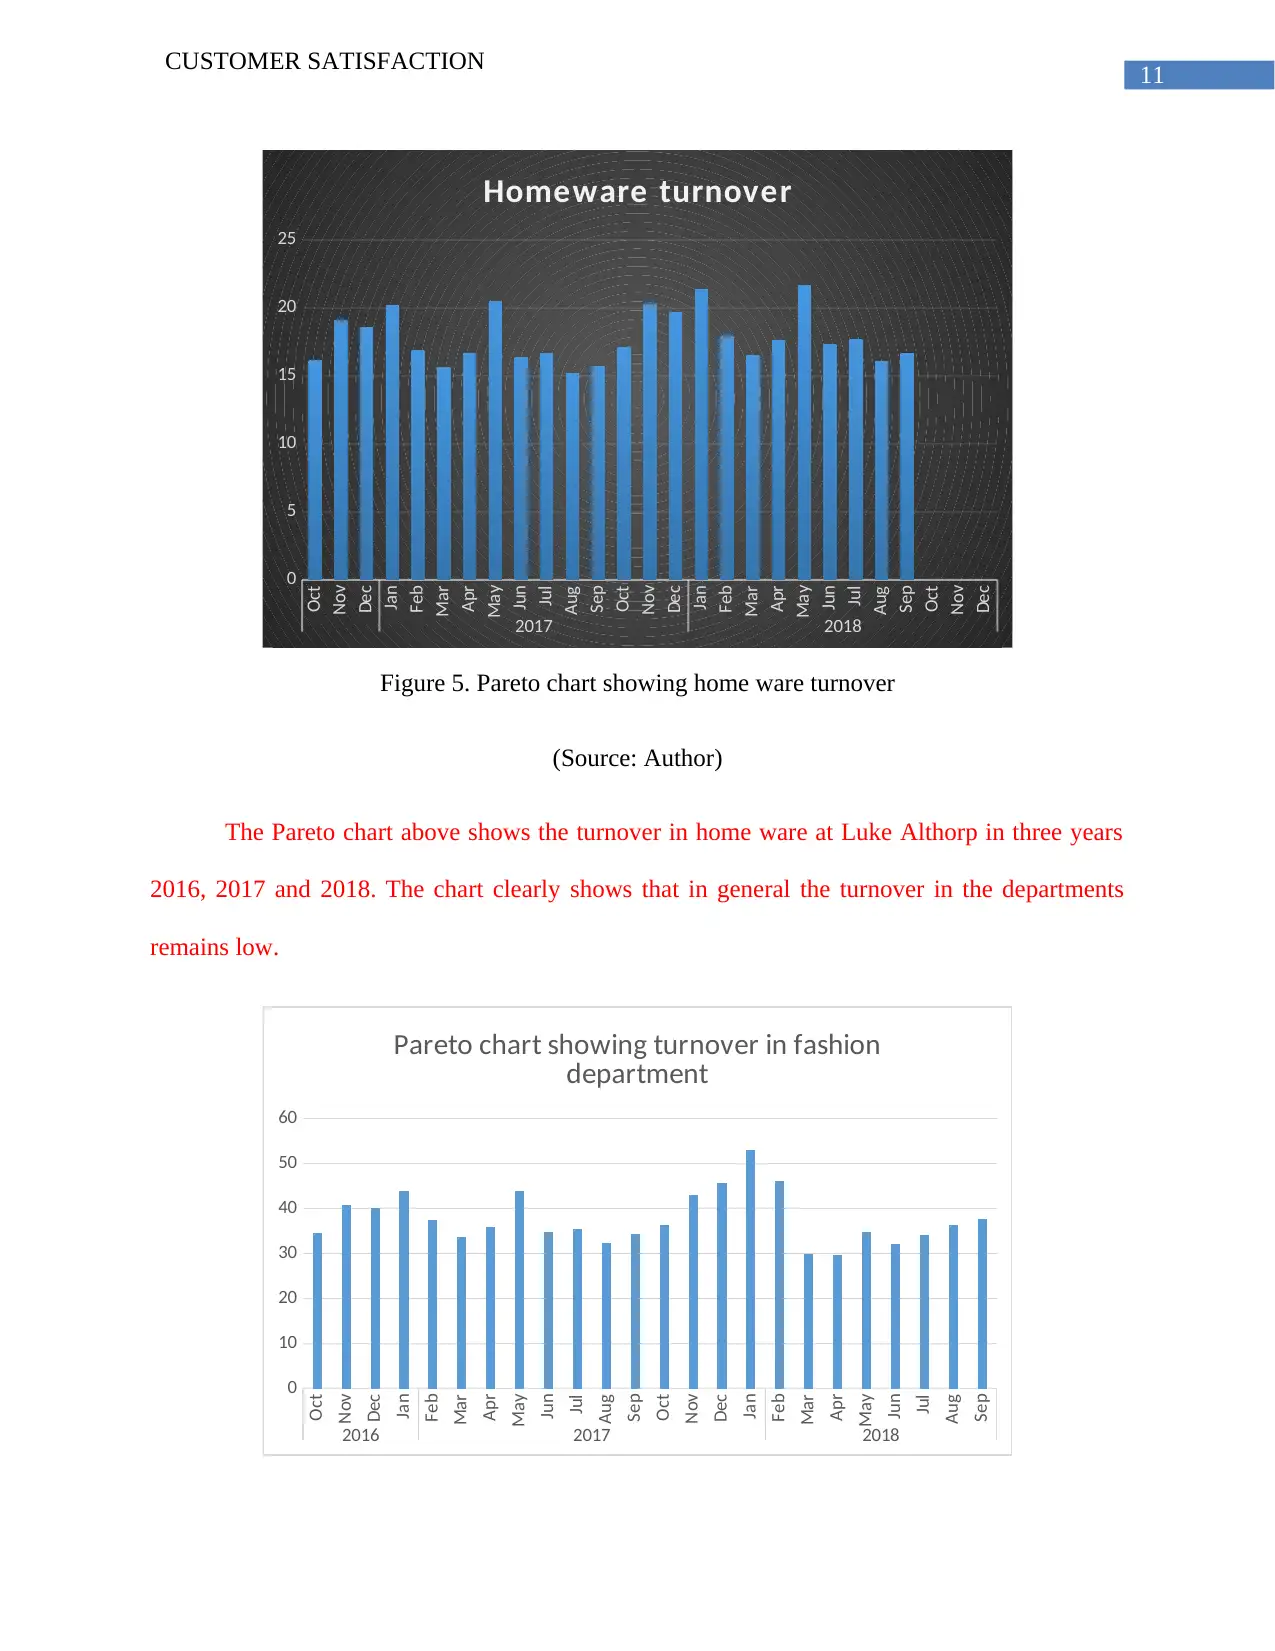
Figure 5. Pareto chart showing home ware turnover
(Source: Author)
The Pareto chart above shows the turnover in home ware at Luke Althorp in three years
2016, 2017 and 2018. The chart clearly shows that in general the turnover in the departments
remains low.
Oct
Nov
Dec
Jan
Feb
Mar
Apr
May
Jun
Jul
Aug
Sep
Oct
Nov
Dec
Jan
Feb
Mar
Apr
May
Jun
Jul
Aug
Sep
2016 2017 2018
0
10
20
30
40
50
60
Pareto chart showing turnover in fashion
department
CUSTOMER SATISFACTION
Oct
Nov
Dec
Jan
Feb
Mar
Apr
May
Jun
Jul
Aug
Sep
Oct
Nov
Dec
Jan
Feb
Mar
Apr
May
Jun
Jul
Aug
Sep
Oct
Nov
Dec
2017 2018
0
5
10
15
20
25
Homeware turnover
Figure 5. Pareto chart showing home ware turnover
(Source: Author)
The Pareto chart above shows the turnover in home ware at Luke Althorp in three years
2016, 2017 and 2018. The chart clearly shows that in general the turnover in the departments
remains low.
Oct
Nov
Dec
Jan
Feb
Mar
Apr
May
Jun
Jul
Aug
Sep
Oct
Nov
Dec
Jan
Feb
Mar
Apr
May
Jun
Jul
Aug
Sep
2016 2017 2018
0
10
20
30
40
50
60
Pareto chart showing turnover in fashion
department
⊘ This is a preview!⊘
Do you want full access?
Subscribe today to unlock all pages.
Trusted by 1+ million students worldwide
1 out of 62

Your All-in-One AI-Powered Toolkit for Academic Success.
+13062052269
info@desklib.com
Available 24*7 on WhatsApp / Email
![[object Object]](/_next/static/media/star-bottom.7253800d.svg)
Unlock your academic potential
Copyright © 2020–2026 A2Z Services. All Rights Reserved. Developed and managed by ZUCOL.