SPSS Report: Customer Satisfaction Analysis for Passio Coffee (FPTU)
VerifiedAdded on 2021/06/30
|25
|7501
|247
Report
AI Summary
This report presents an SPSS-based analysis of customer satisfaction at Passio Coffee, focusing on the FPT University branch. The study, conducted by a group of students, aimed to evaluate the impact of Passio's service quality on customer satisfaction using a 35-item questionnaire based on the SERVQUAL model. The methodology involved a survey of over 200 customers, followed by data analysis using SPSS to determine the relationships between service quality dimensions (tangibles, responsiveness, reliability, empathy, and assurance) and customer satisfaction. The analysis included descriptive statistics, Cronbach's alpha for reliability testing, Pearson correlation, and linear regression. The key findings revealed a high correlation between empathy and tangible variables with customer satisfaction, while responsiveness, reliability, and assurance showed insignificant correlations. The report concludes with recommendations for Passio to enhance service quality and improve customer satisfaction based on these findings, providing a valuable guideline for the management to improve the quality of Passio in FPT area.
1
SPSS REPORT
Measure the customers’ satisfaction level
of Passio Coffee
April 12th, 2020
Subject: Business Decision Making
Teacher: Nguyen Huu Hoang Giao
Class: FPTU-BA1401-BDM201
Members:
Nguyen Le Minh Han
Tran Dai Duong
Le Trong Quang
Luong Nhat Tuan
Nguyen Ngoc Ky Thoa
Pham Dao Tan Dung
SPSS REPORT
Measure the customers’ satisfaction level
of Passio Coffee
April 12th, 2020
Subject: Business Decision Making
Teacher: Nguyen Huu Hoang Giao
Class: FPTU-BA1401-BDM201
Members:
Nguyen Le Minh Han
Tran Dai Duong
Le Trong Quang
Luong Nhat Tuan
Nguyen Ngoc Ky Thoa
Pham Dao Tan Dung
Paraphrase This Document
Need a fresh take? Get an instant paraphrase of this document with our AI Paraphraser
2
Contents
Abstract ........................................................................................................................................................ 3
1. Introduction ..................................................................................................................................... 3
2. Literature review ............................................................................................................................. 4
3. Methodology ................................................................................................................................... 5
4. Data analysis .................................................................................................................................... 7
4.1. Descriptive Statistic .......................................................................................................................... 7
a. Frequencies .................................................................................................................................... 7
b. Descriptive ...................................................................................................................................... 9
4.2. Cronbach’s alpha............................................................................................................................ 10
a. Definition ...................................................................................................................................... 10
b. Accreditation standards ............................................................................................................... 11
c. Test Cronbach’s Alpha scale in SPSS............................................................................................. 11
4.3. Pearson correlation ........................................................................................................................ 15
a. Definition ...................................................................................................................................... 15
b. Accreditation standards ............................................................................................................... 15
c. Test Pearson correlation in SPSS .................................................................................................. 15
4.4. Linear regression ............................................................................................................................ 17
a. Definition ...................................................................................................................................... 17
b. Accreditation standards ............................................................................................................... 17
c. Test Regression in SPSS ................................................................................................................ 18
d. Charts ........................................................................................................................................... 20
5. Recommendation & Conclusion ................................................................................................... 21
a. Recommendation ......................................................................................................................... 21
b. Conclusion .................................................................................................................................... 21
References .................................................................................................................................................. 22
Appendix ..................................................................................................................................................... 23
3
Abstract
Study objectives: this research was aimed to evaluate the short-form 35-item questionnaire as an
instrument for measuring how service quality of Passio effect to customer satisfaction. The
results of which would enable the management to improve the quality of service accorded to
clients.
Design: the research is briefly demonstrated by a small survey conducted on a randomly selected
bunch of customers regarding the service quality.
Implication: the findings of this study can be used as a guideline by the management to improve
the quality of Passio in FPT area.
Result: the outcome of multiple regression analysis showed that empathy and tangible variables
reflected a high correlation with customer satisfaction. On the other hand, responsiveness,
reliability and assurance variables recorded an insignificant correlation with customer
satisfaction.
1. Introduction
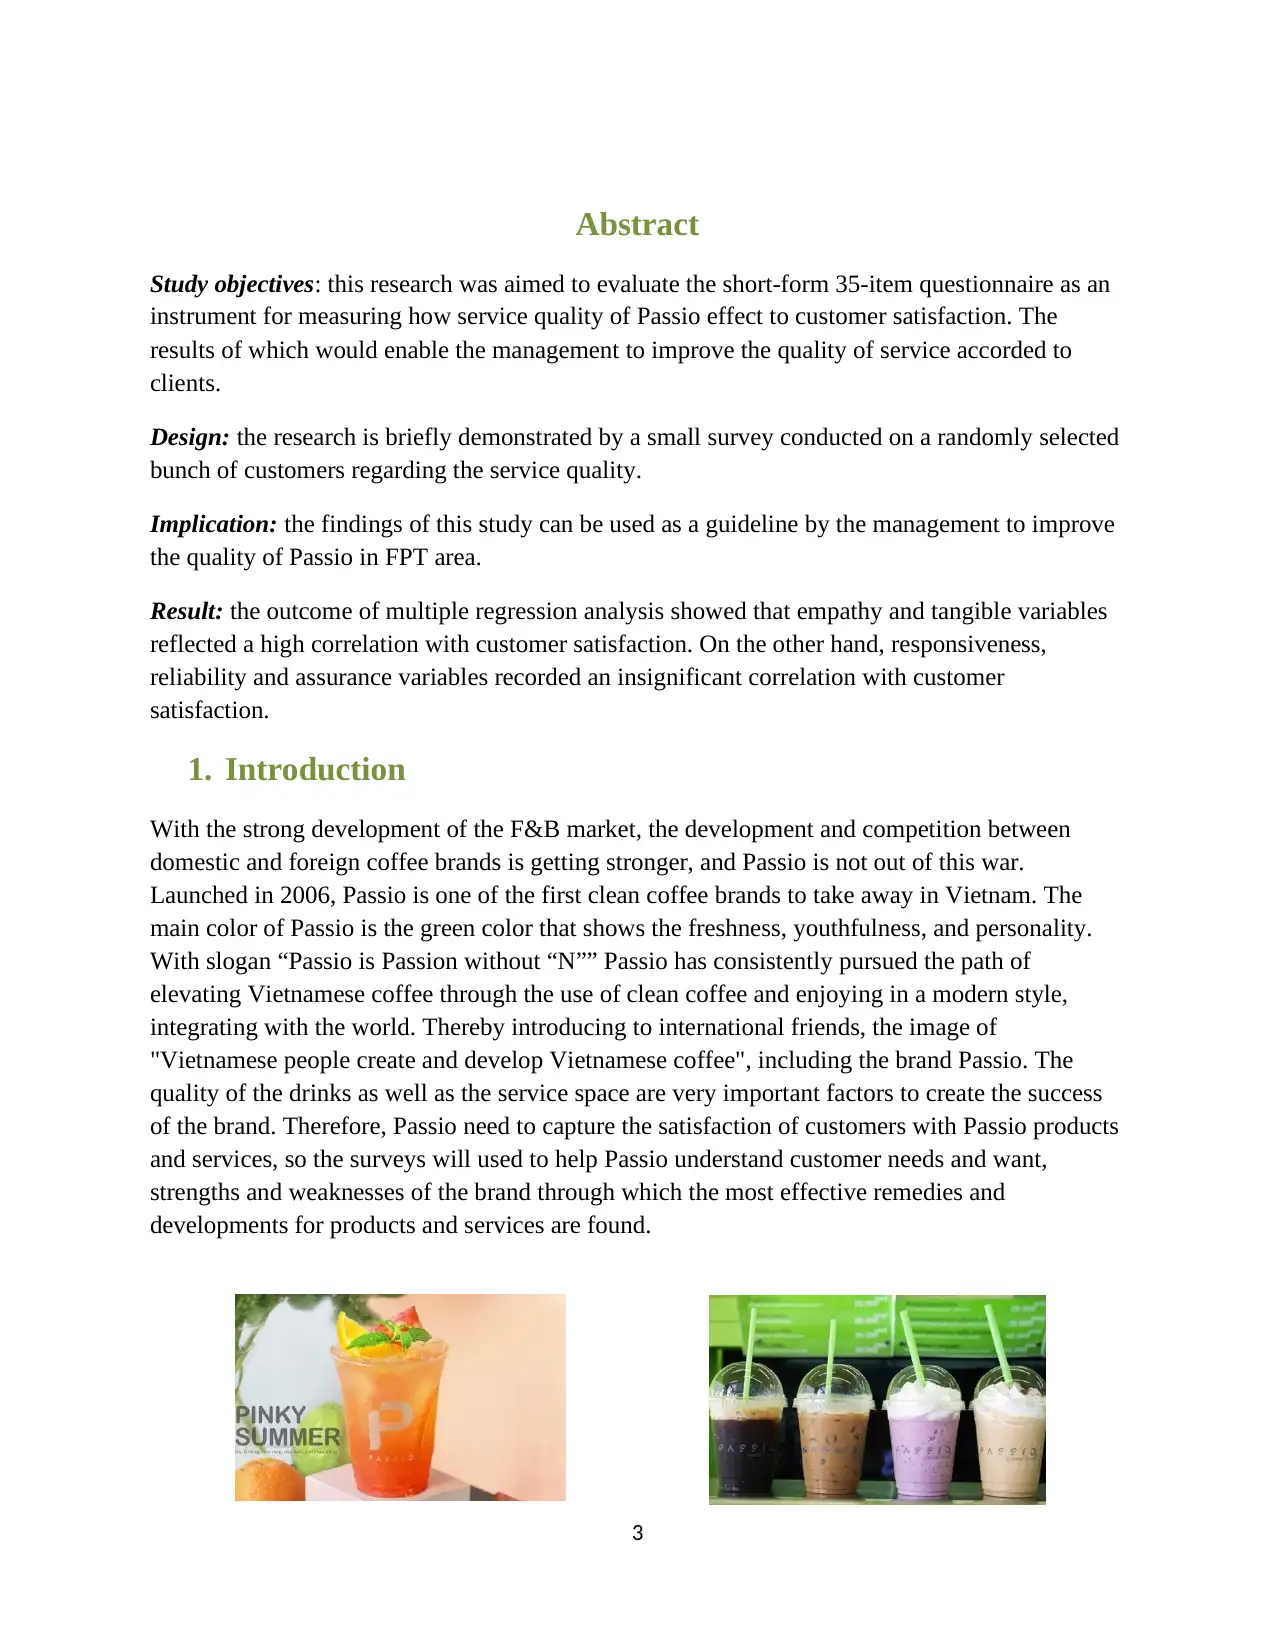
With the strong development of the F&B market, the development and competition between
domestic and foreign coffee brands is getting stronger, and Passio is not out of this war.
Launched in 2006, Passio is one of the first clean coffee brands to take away in Vietnam. The
main color of Passio is the green color that shows the freshness, youthfulness, and personality.
With slogan “Passio is Passion without “N”” Passio has consistently pursued the path of
elevating Vietnamese coffee through the use of clean coffee and enjoying in a modern style,
integrating with the world. Thereby introducing to international friends, the image of
"Vietnamese people create and develop Vietnamese coffee", including the brand Passio. The
quality of the drinks as well as the service space are very important factors to create the success
of the brand. Therefore, Passio need to capture the satisfaction of customers with Passio products
and services, so the surveys will used to help Passio understand customer needs and want,
strengths and weaknesses of the brand through which the most effective remedies and
developments for products and services are found.
Abstract
Study objectives: this research was aimed to evaluate the short-form 35-item questionnaire as an
instrument for measuring how service quality of Passio effect to customer satisfaction. The
results of which would enable the management to improve the quality of service accorded to
clients.
Design: the research is briefly demonstrated by a small survey conducted on a randomly selected
bunch of customers regarding the service quality.
Implication: the findings of this study can be used as a guideline by the management to improve
the quality of Passio in FPT area.
Result: the outcome of multiple regression analysis showed that empathy and tangible variables
reflected a high correlation with customer satisfaction. On the other hand, responsiveness,
reliability and assurance variables recorded an insignificant correlation with customer
satisfaction.
1. Introduction
With the strong development of the F&B market, the development and competition between
domestic and foreign coffee brands is getting stronger, and Passio is not out of this war.
Launched in 2006, Passio is one of the first clean coffee brands to take away in Vietnam. The
main color of Passio is the green color that shows the freshness, youthfulness, and personality.
With slogan “Passio is Passion without “N”” Passio has consistently pursued the path of
elevating Vietnamese coffee through the use of clean coffee and enjoying in a modern style,
integrating with the world. Thereby introducing to international friends, the image of
"Vietnamese people create and develop Vietnamese coffee", including the brand Passio. The
quality of the drinks as well as the service space are very important factors to create the success
of the brand. Therefore, Passio need to capture the satisfaction of customers with Passio products
and services, so the surveys will used to help Passio understand customer needs and want,
strengths and weaknesses of the brand through which the most effective remedies and
developments for products and services are found.
⊘ This is a preview!⊘
Do you want full access?
Subscribe today to unlock all pages.
Trusted by 1+ million students worldwide
4
2. Literature review
A woman walked up to the branch manager of a bank. "Are you hiring any help?" she asked.
"No," he said. "We already have all the staff we need."
"In that case, would you mind trying to find someone to help me in the safe deposit area?" she
asked.
This story is just a comical representation of a customer's dissatisfactory reaction resulted from a
service failure of a bank. The term Customer Satisfaction has become the prime concern of most
of the organizations to be competitive in the industry. Determining and meeting customer
expectation regarding services is the key to make satisfied customers and the best way for
determining customers‟ needs and expectation is the use of surveys and researches- the key
vehicle for understanding customer expectations and perceptions of services.
The survey is based on SERVQUAL model. SERVQUAL is a multidimensional research tool,
designed to capture consumers' expectations and perceptions of a five-dimensional service that is
believed to represent service quality. SERVQUAL is built on the expectation-confirmation
model, in simple terms, service quality is understood as the level of expectation before
consumers' consumption is confirmed or not confirmed by sensors. Get the facts they get after
experiencing the service.
Five-dimensional service quality including:
1. Reliability: The ability to deliver promised services reliably and accurately
2. Assurance: The knowledge and courtesy of employees and their ability to convey trust and
confidence
3. Tangibles: The appearance of physical facilities, equipment, personnel and communication
materials
4. Empathy: The provision of caring, individualized attention to customer
5. Responsiveness: The willingness to help customers and to provide prompt service
The SERVQUAL model has gone through a lot of testing to give the final streamlining result.
The developers of this tool, Parasuraman, Ziethaml and Berry, have stated that this is the tool
that delivers the most reliable and accurate results. SERVQUAL has been widely used in
companies around the world, in a wide range of contexts and cultures, and is considered to be
suitable. It has gradually become a major scale in service quality.
Paraphrase This Document
Need a fresh take? Get an instant paraphrase of this document with our AI Paraphraser
5
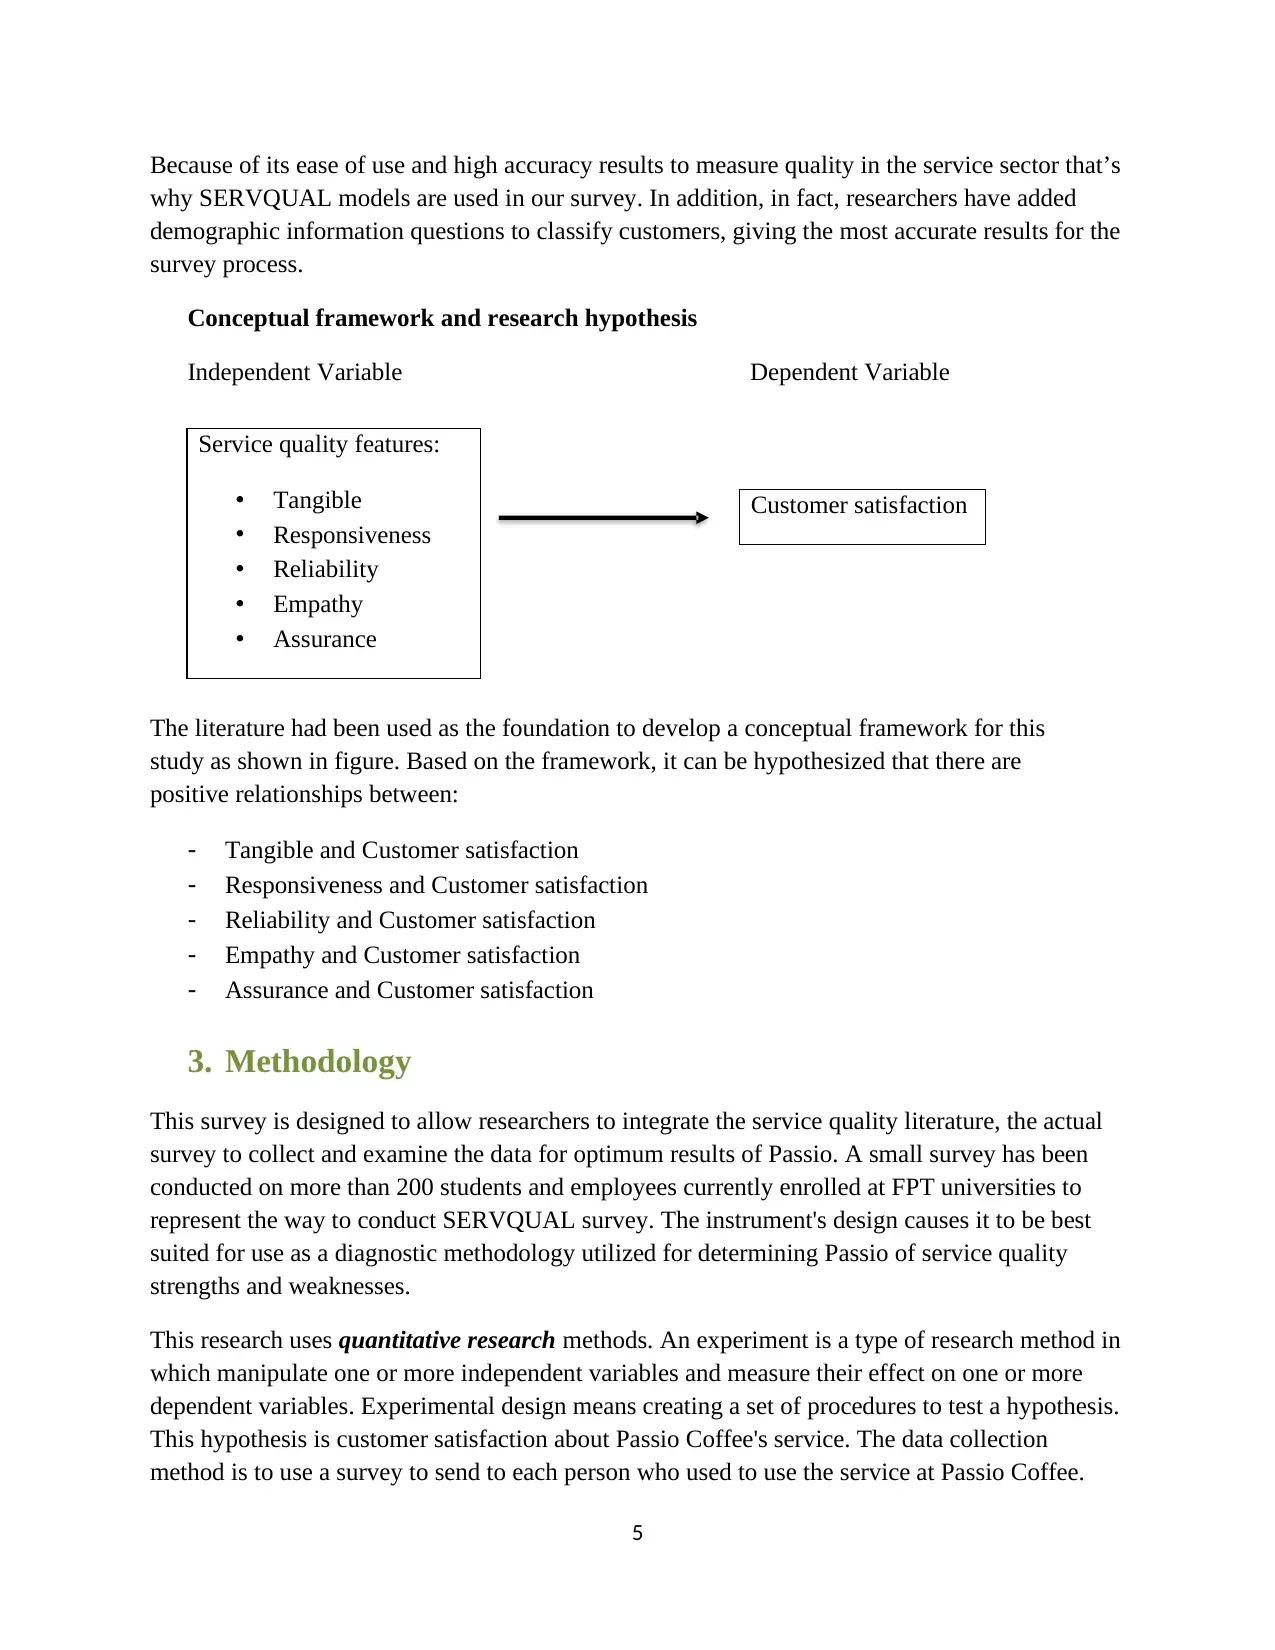
Because of its ease of use and high accuracy results to measure quality in the service sector that’s
why SERVQUAL models are used in our survey. In addition, in fact, researchers have added
demographic information questions to classify customers, giving the most accurate results for the
survey process.
Conceptual framework and research hypothesis
Independent Variable Dependent Variable
The literature had been used as the foundation to develop a conceptual framework for this
study as shown in figure. Based on the framework, it can be hypothesized that there are
positive relationships between:
- Tangible and Customer satisfaction
- Responsiveness and Customer satisfaction
- Reliability and Customer satisfaction
- Empathy and Customer satisfaction
- Assurance and Customer satisfaction
3. Methodology
This survey is designed to allow researchers to integrate the service quality literature, the actual
survey to collect and examine the data for optimum results of Passio. A small survey has been
conducted on more than 200 students and employees currently enrolled at FPT universities to
represent the way to conduct SERVQUAL survey. The instrument's design causes it to be best
suited for use as a diagnostic methodology utilized for determining Passio of service quality
strengths and weaknesses.
This research uses quantitative research methods. An experiment is a type of research method in
which manipulate one or more independent variables and measure their effect on one or more
dependent variables. Experimental design means creating a set of procedures to test a hypothesis.
This hypothesis is customer satisfaction about Passio Coffee's service. The data collection
method is to use a survey to send to each person who used to use the service at Passio Coffee.
Customer satisfaction
Service quality features:
• Tangible
• Responsiveness
• Reliability
• Empathy
• Assurance
6
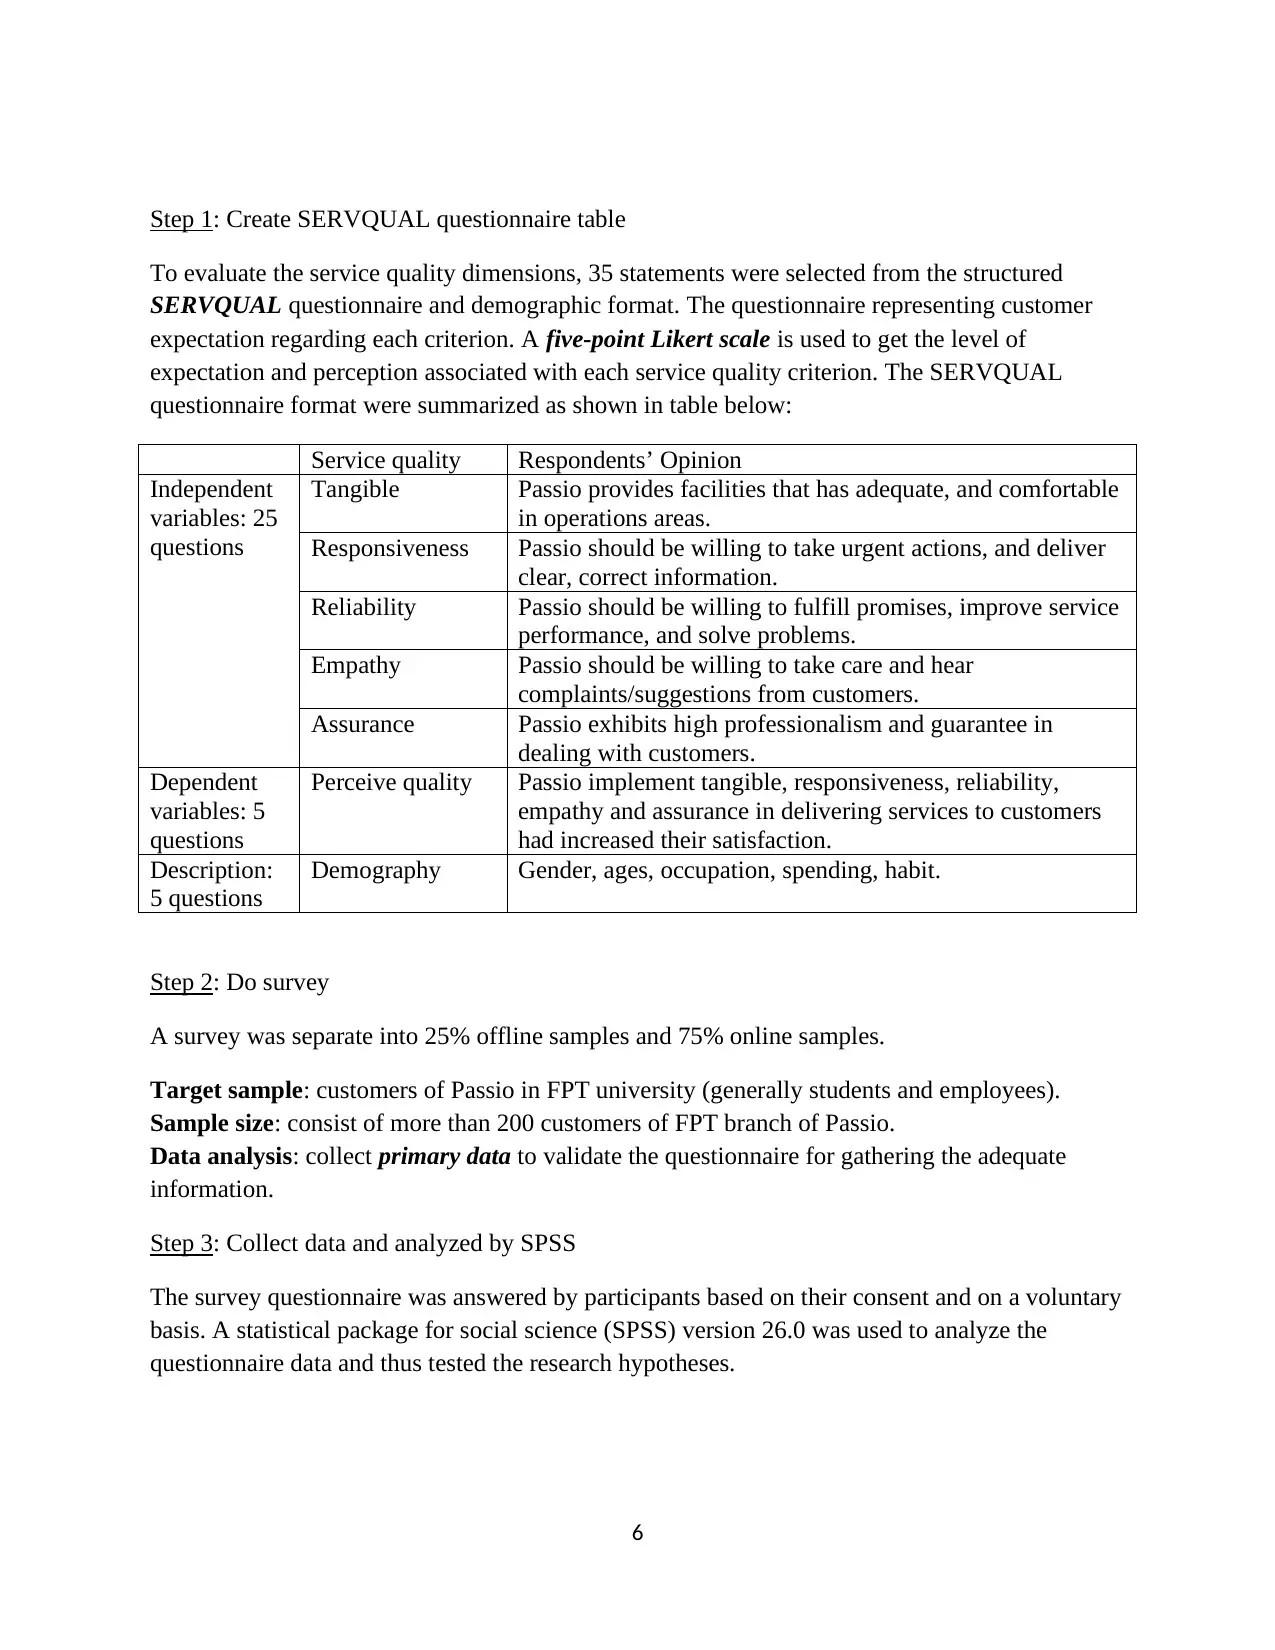
Step 1: Create SERVQUAL questionnaire table
To evaluate the service quality dimensions, 35 statements were selected from the structured
SERVQUAL questionnaire and demographic format. The questionnaire representing customer
expectation regarding each criterion. A five-point Likert scale is used to get the level of
expectation and perception associated with each service quality criterion. The SERVQUAL
questionnaire format were summarized as shown in table below:
Service quality Respondents’ Opinion
Independent
variables: 25
questions
Tangible Passio provides facilities that has adequate, and comfortable
in operations areas.
Responsiveness Passio should be willing to take urgent actions, and deliver
clear, correct information.
Reliability Passio should be willing to fulfill promises, improve service
performance, and solve problems.
Empathy Passio should be willing to take care and hear
complaints/suggestions from customers.
Assurance Passio exhibits high professionalism and guarantee in
dealing with customers.
Dependent
variables: 5
questions
Perceive quality Passio implement tangible, responsiveness, reliability,
empathy and assurance in delivering services to customers
had increased their satisfaction.
Description:
5 questions
Demography Gender, ages, occupation, spending, habit.
Step 2: Do survey
A survey was separate into 25% offline samples and 75% online samples.
Target sample: customers of Passio in FPT university (generally students and employees).
Sample size: consist of more than 200 customers of FPT branch of Passio.
Data analysis: collect primary data to validate the questionnaire for gathering the adequate
information.
Step 3: Collect data and analyzed by SPSS
The survey questionnaire was answered by participants based on their consent and on a voluntary
basis. A statistical package for social science (SPSS) version 26.0 was used to analyze the
questionnaire data and thus tested the research hypotheses.
⊘ This is a preview!⊘
Do you want full access?
Subscribe today to unlock all pages.
Trusted by 1+ million students worldwide
7
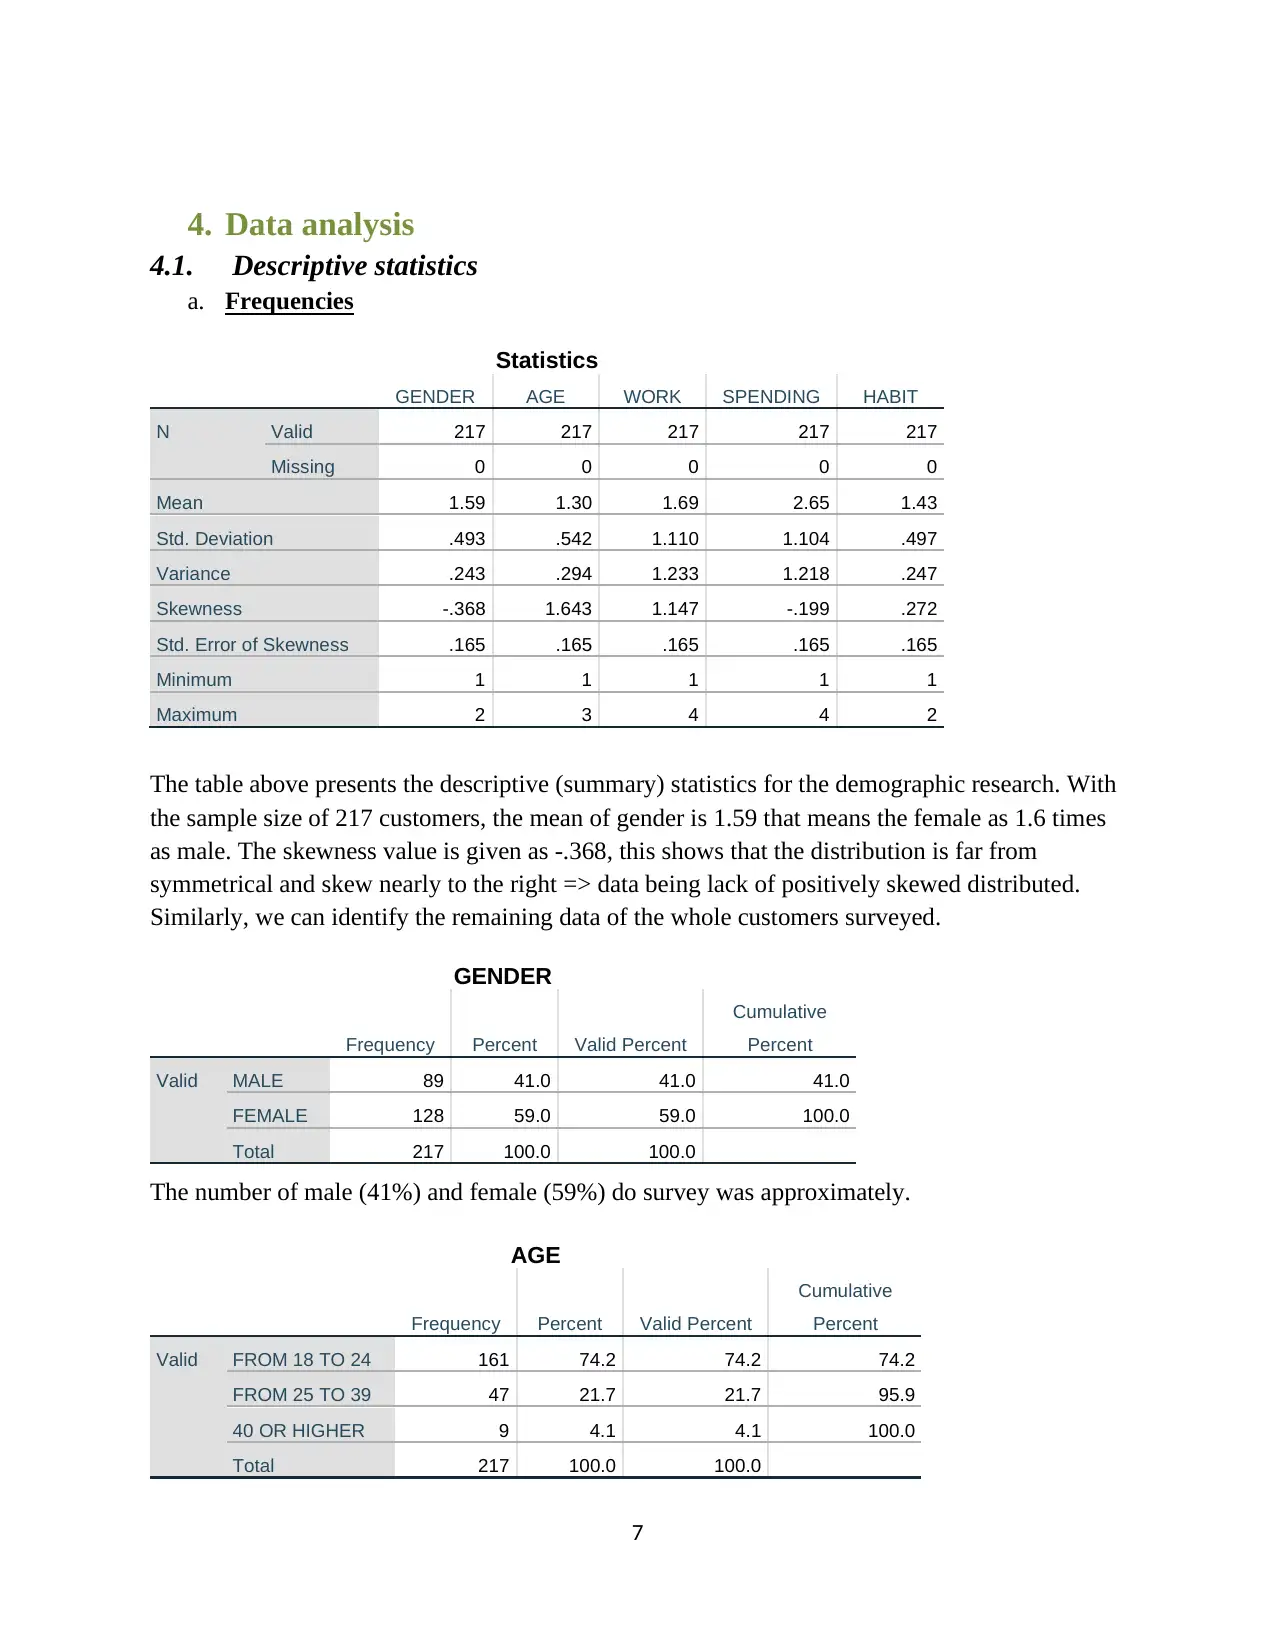
4. Data analysis
4.1. Descriptive statistics
a. Frequencies
Statistics
GENDER AGE WORK SPENDING HABIT
N Valid 217 217 217 217 217
Missing 0 0 0 0 0
Mean 1.59 1.30 1.69 2.65 1.43
Std. Deviation .493 .542 1.110 1.104 .497
Variance .243 .294 1.233 1.218 .247
Skewness -.368 1.643 1.147 -.199 .272
Std. Error of Skewness .165 .165 .165 .165 .165
Minimum 1 1 1 1 1
Maximum 2 3 4 4 2
The table above presents the descriptive (summary) statistics for the demographic research. With
the sample size of 217 customers, the mean of gender is 1.59 that means the female as 1.6 times
as male. The skewness value is given as -.368, this shows that the distribution is far from
symmetrical and skew nearly to the right => data being lack of positively skewed distributed.
Similarly, we can identify the remaining data of the whole customers surveyed.
GENDER
Frequency Percent Valid Percent
Cumulative
Percent
Valid MALE 89 41.0 41.0 41.0
FEMALE 128 59.0 59.0 100.0
Total 217 100.0 100.0
The number of male (41%) and female (59%) do survey was approximately.
AGE
Frequency Percent Valid Percent
Cumulative
Percent
Valid FROM 18 TO 24 161 74.2 74.2 74.2
FROM 25 TO 39 47 21.7 21.7 95.9
40 OR HIGHER 9 4.1 4.1 100.0
Total 217 100.0 100.0
Paraphrase This Document
Need a fresh take? Get an instant paraphrase of this document with our AI Paraphraser
8
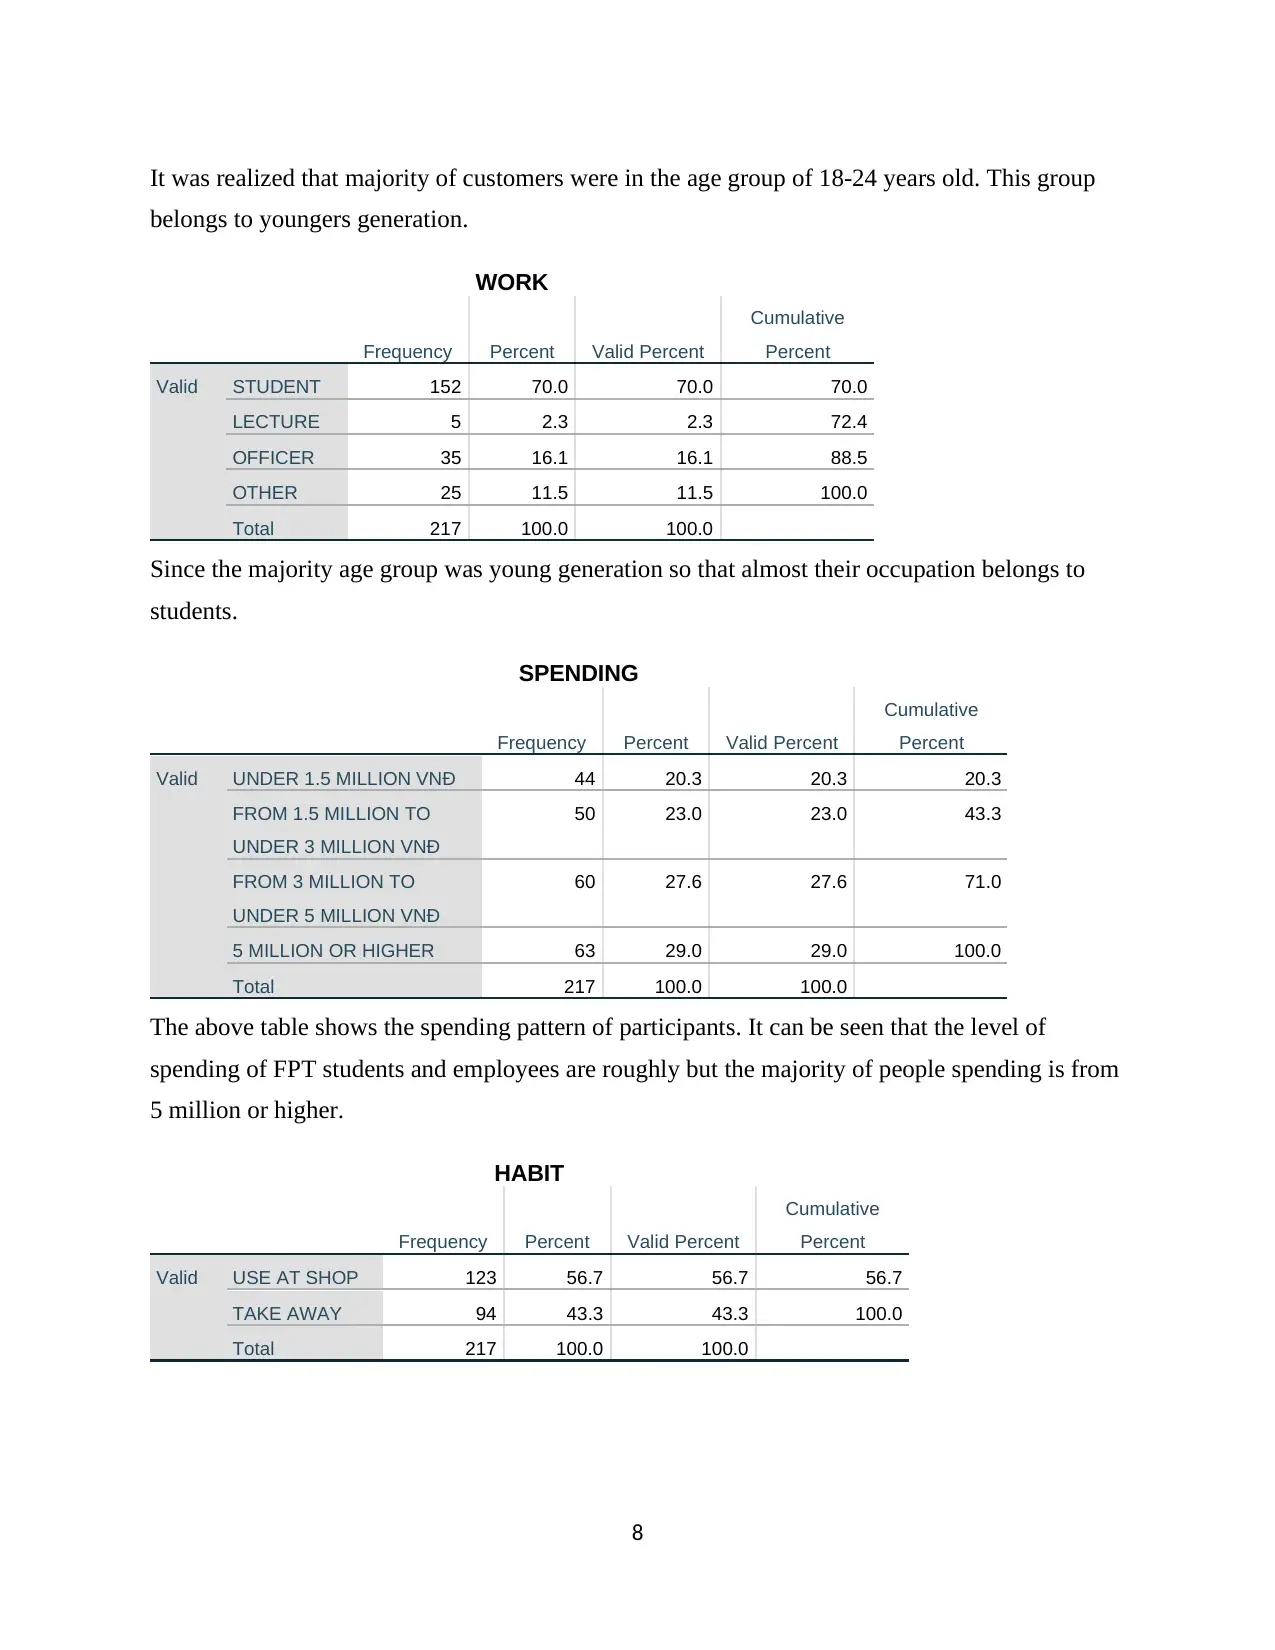
It was realized that majority of customers were in the age group of 18-24 years old. This group
belongs to youngers generation.
WORK
Frequency Percent Valid Percent
Cumulative
Percent
Valid STUDENT 152 70.0 70.0 70.0
LECTURE 5 2.3 2.3 72.4
OFFICER 35 16.1 16.1 88.5
OTHER 25 11.5 11.5 100.0
Total 217 100.0 100.0
Since the majority age group was young generation so that almost their occupation belongs to
students.
SPENDING
Frequency Percent Valid Percent
Cumulative
Percent
Valid UNDER 1.5 MILLION VNĐ 44 20.3 20.3 20.3
FROM 1.5 MILLION TO
UNDER 3 MILLION VNĐ
50 23.0 23.0 43.3
FROM 3 MILLION TO
UNDER 5 MILLION VNĐ
60 27.6 27.6 71.0
5 MILLION OR HIGHER 63 29.0 29.0 100.0
Total 217 100.0 100.0
The above table shows the spending pattern of participants. It can be seen that the level of
spending of FPT students and employees are roughly but the majority of people spending is from
5 million or higher.
HABIT
Frequency Percent Valid Percent
Cumulative
Percent
Valid USE AT SHOP 123 56.7 56.7 56.7
TAKE AWAY 94 43.3 43.3 100.0
Total 217 100.0 100.0
9
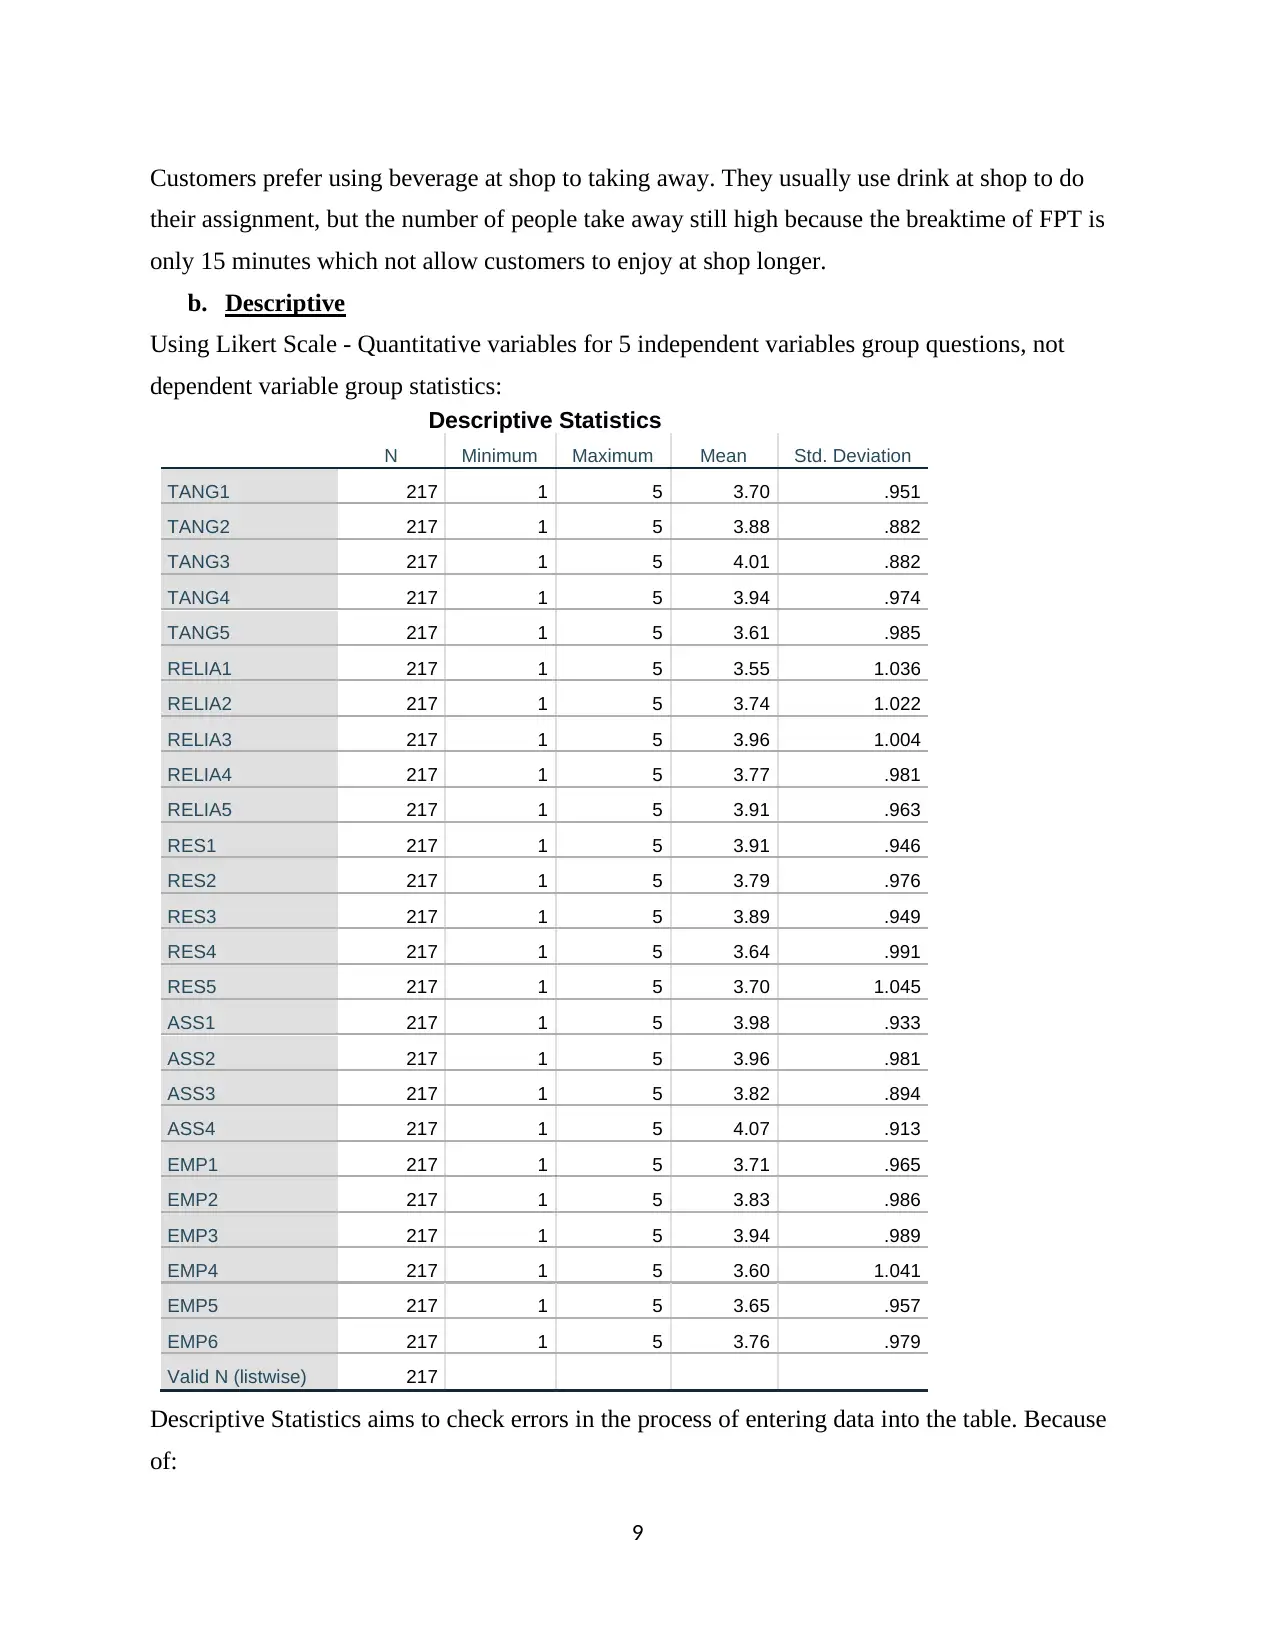
Customers prefer using beverage at shop to taking away. They usually use drink at shop to do
their assignment, but the number of people take away still high because the breaktime of FPT is
only 15 minutes which not allow customers to enjoy at shop longer.
b. Descriptive
Using Likert Scale - Quantitative variables for 5 independent variables group questions, not
dependent variable group statistics:
Descriptive Statistics
N Minimum Maximum Mean Std. Deviation
TANG1 217 1 5 3.70 .951
TANG2 217 1 5 3.88 .882
TANG3 217 1 5 4.01 .882
TANG4 217 1 5 3.94 .974
TANG5 217 1 5 3.61 .985
RELIA1 217 1 5 3.55 1.036
RELIA2 217 1 5 3.74 1.022
RELIA3 217 1 5 3.96 1.004
RELIA4 217 1 5 3.77 .981
RELIA5 217 1 5 3.91 .963
RES1 217 1 5 3.91 .946
RES2 217 1 5 3.79 .976
RES3 217 1 5 3.89 .949
RES4 217 1 5 3.64 .991
RES5 217 1 5 3.70 1.045
ASS1 217 1 5 3.98 .933
ASS2 217 1 5 3.96 .981
ASS3 217 1 5 3.82 .894
ASS4 217 1 5 4.07 .913
EMP1 217 1 5 3.71 .965
EMP2 217 1 5 3.83 .986
EMP3 217 1 5 3.94 .989
EMP4 217 1 5 3.60 1.041
EMP5 217 1 5 3.65 .957
EMP6 217 1 5 3.76 .979
Valid N (listwise) 217
Descriptive Statistics aims to check errors in the process of entering data into the table. Because
of:
⊘ This is a preview!⊘
Do you want full access?
Subscribe today to unlock all pages.
Trusted by 1+ million students worldwide
10
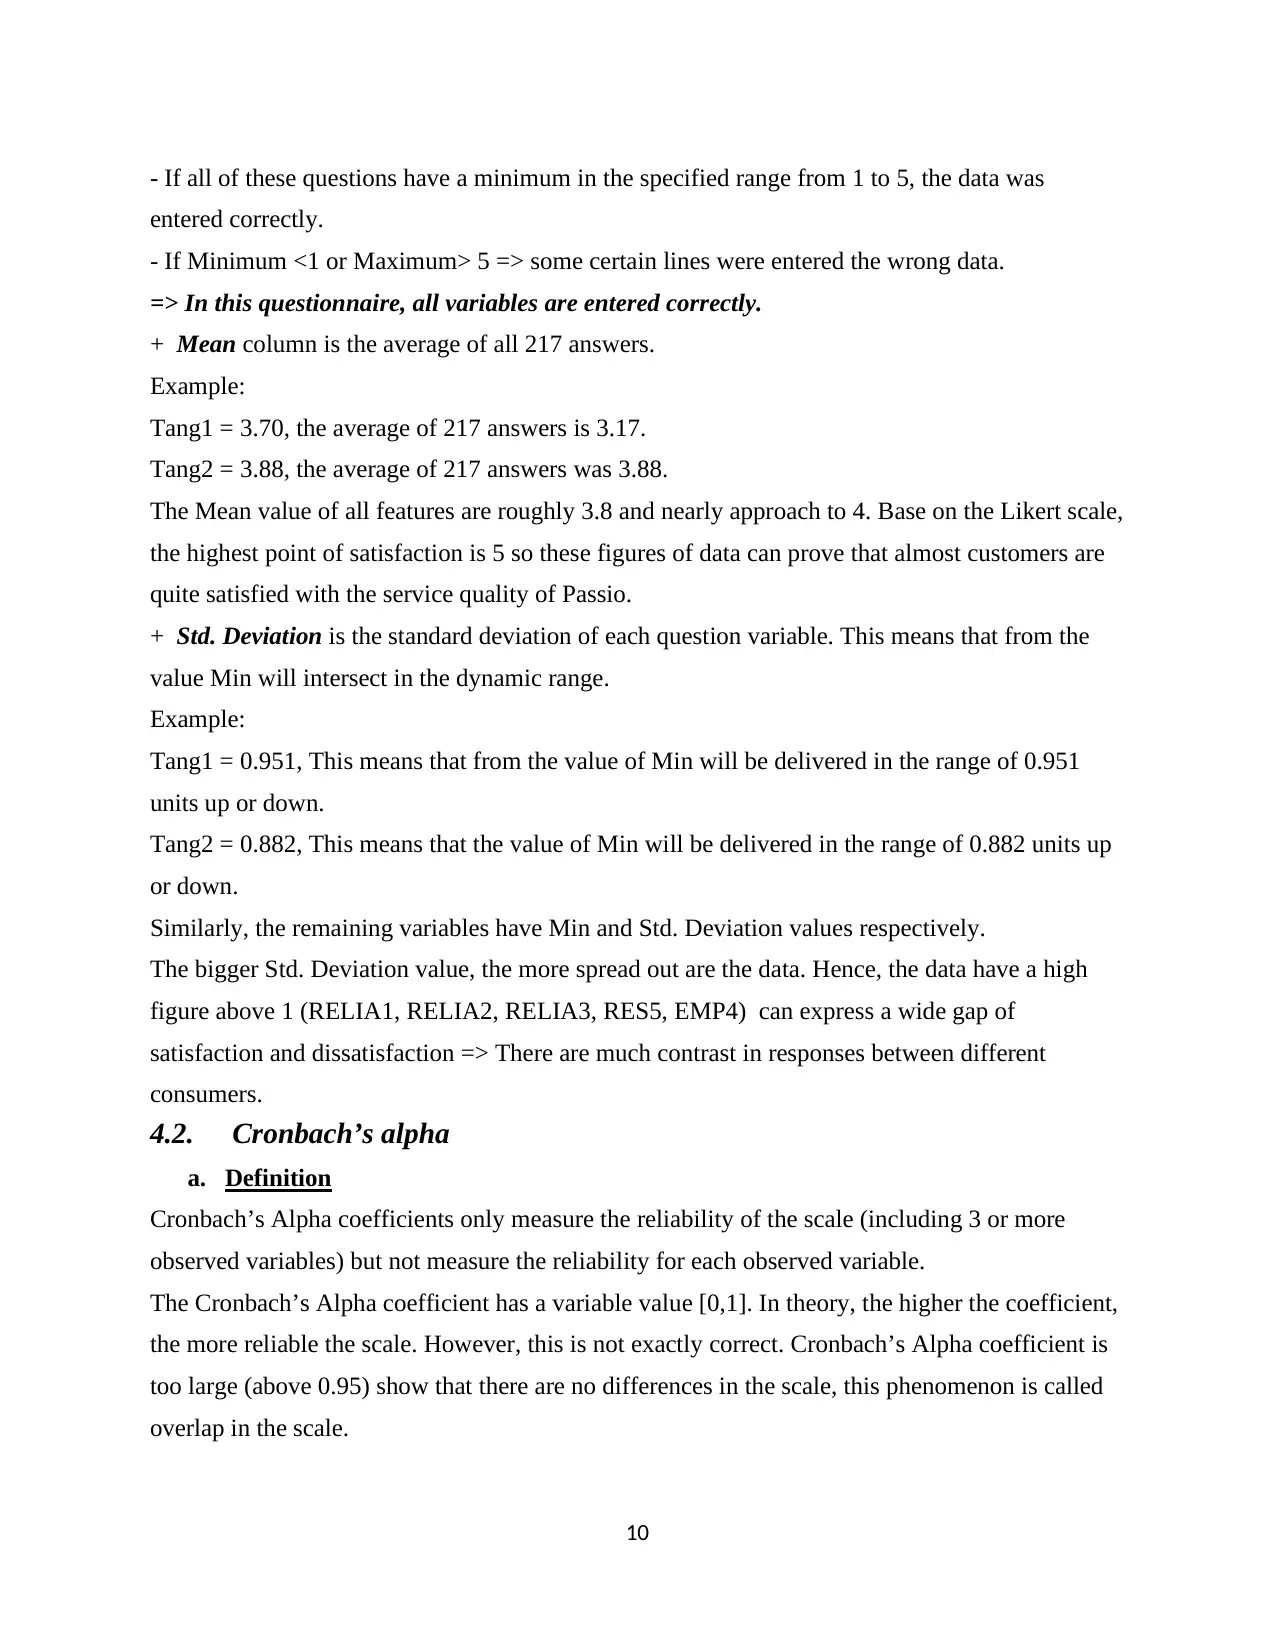
- If all of these questions have a minimum in the specified range from 1 to 5, the data was
entered correctly.
- If Minimum <1 or Maximum> 5 => some certain lines were entered the wrong data.
=> In this questionnaire, all variables are entered correctly.
+ Mean column is the average of all 217 answers.
Example:
Tang1 = 3.70, the average of 217 answers is 3.17.
Tang2 = 3.88, the average of 217 answers was 3.88.
The Mean value of all features are roughly 3.8 and nearly approach to 4. Base on the Likert scale,
the highest point of satisfaction is 5 so these figures of data can prove that almost customers are
quite satisfied with the service quality of Passio.
+ Std. Deviation is the standard deviation of each question variable. This means that from the
value Min will intersect in the dynamic range.
Example:
Tang1 = 0.951, This means that from the value of Min will be delivered in the range of 0.951
units up or down.
Tang2 = 0.882, This means that the value of Min will be delivered in the range of 0.882 units up
or down.
Similarly, the remaining variables have Min and Std. Deviation values respectively.
The bigger Std. Deviation value, the more spread out are the data. Hence, the data have a high
figure above 1 (RELIA1, RELIA2, RELIA3, RES5, EMP4) can express a wide gap of
satisfaction and dissatisfaction => There are much contrast in responses between different
consumers.
4.2. Cronbach’s alpha
a. Definition
Cronbach’s Alpha coefficients only measure the reliability of the scale (including 3 or more
observed variables) but not measure the reliability for each observed variable.
The Cronbach’s Alpha coefficient has a variable value [0,1]. In theory, the higher the coefficient,
the more reliable the scale. However, this is not exactly correct. Cronbach’s Alpha coefficient is
too large (above 0.95) show that there are no differences in the scale, this phenomenon is called
overlap in the scale.
Paraphrase This Document
Need a fresh take? Get an instant paraphrase of this document with our AI Paraphraser
11
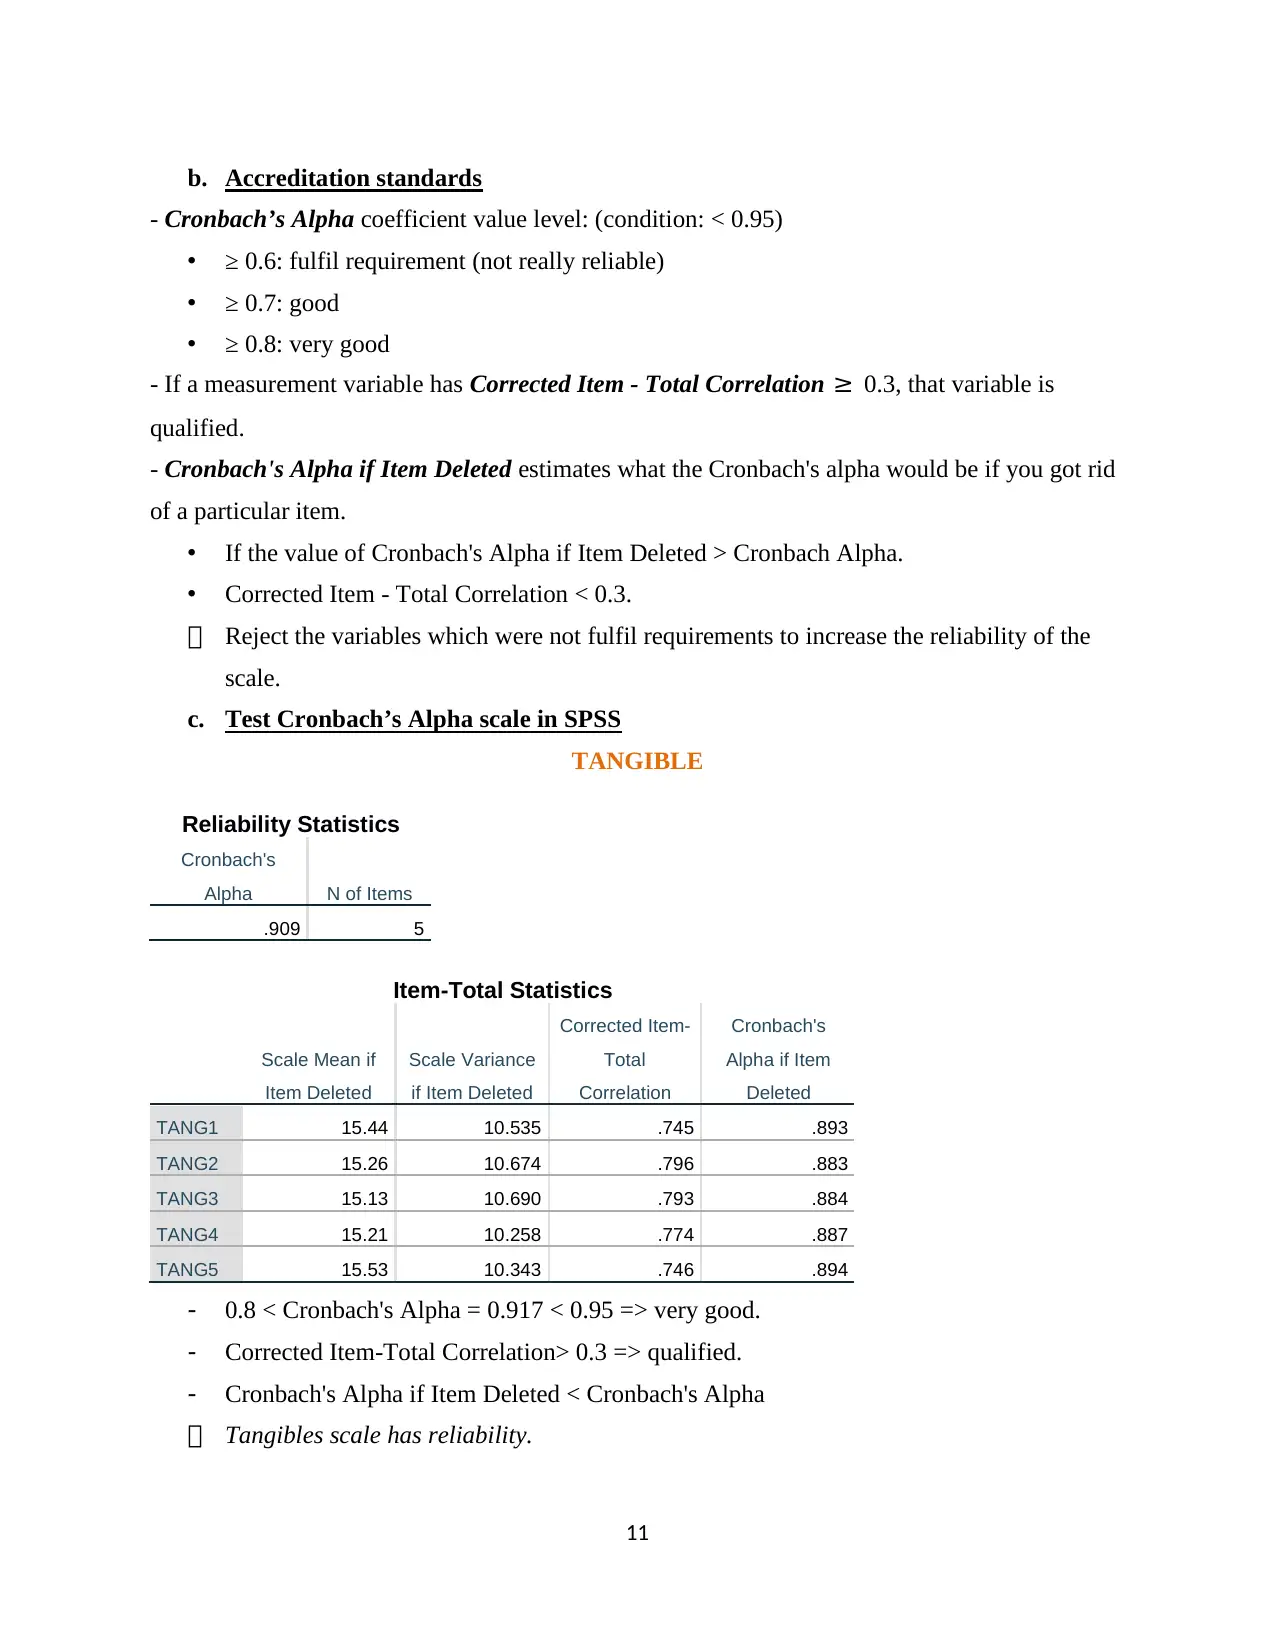
b. Accreditation standards
- Cronbach’s Alpha coefficient value level: (condition: < 0.95)
• ≥ 0.6: fulfil requirement (not really reliable)
• ≥ 0.7: good
• ≥ 0.8: very good
- If a measurement variable has Corrected Item - Total Correlation ≥ 0.3, that variable is
qualified.
- Cronbach's Alpha if Item Deleted estimates what the Cronbach's alpha would be if you got rid
of a particular item.
• If the value of Cronbach's Alpha if Item Deleted > Cronbach Alpha.
• Corrected Item - Total Correlation < 0.3.
Reject the variables which were not fulfil requirements to increase the reliability of the
scale.
c. Test Cronbach’s Alpha scale in SPSS
TANGIBLE
Reliability Statistics
Cronbach's
Alpha N of Items
.909 5
Item-Total Statistics
Scale Mean if
Item Deleted
Scale Variance
if Item Deleted
Corrected Item-
Total
Correlation
Cronbach's
Alpha if Item
Deleted
TANG1 15.44 10.535 .745 .893
TANG2 15.26 10.674 .796 .883
TANG3 15.13 10.690 .793 .884
TANG4 15.21 10.258 .774 .887
TANG5 15.53 10.343 .746 .894
- 0.8 < Cronbach's Alpha = 0.917 < 0.95 => very good.
- Corrected Item-Total Correlation> 0.3 => qualified.
- Cronbach's Alpha if Item Deleted < Cronbach's Alpha
Tangibles scale has reliability.
12
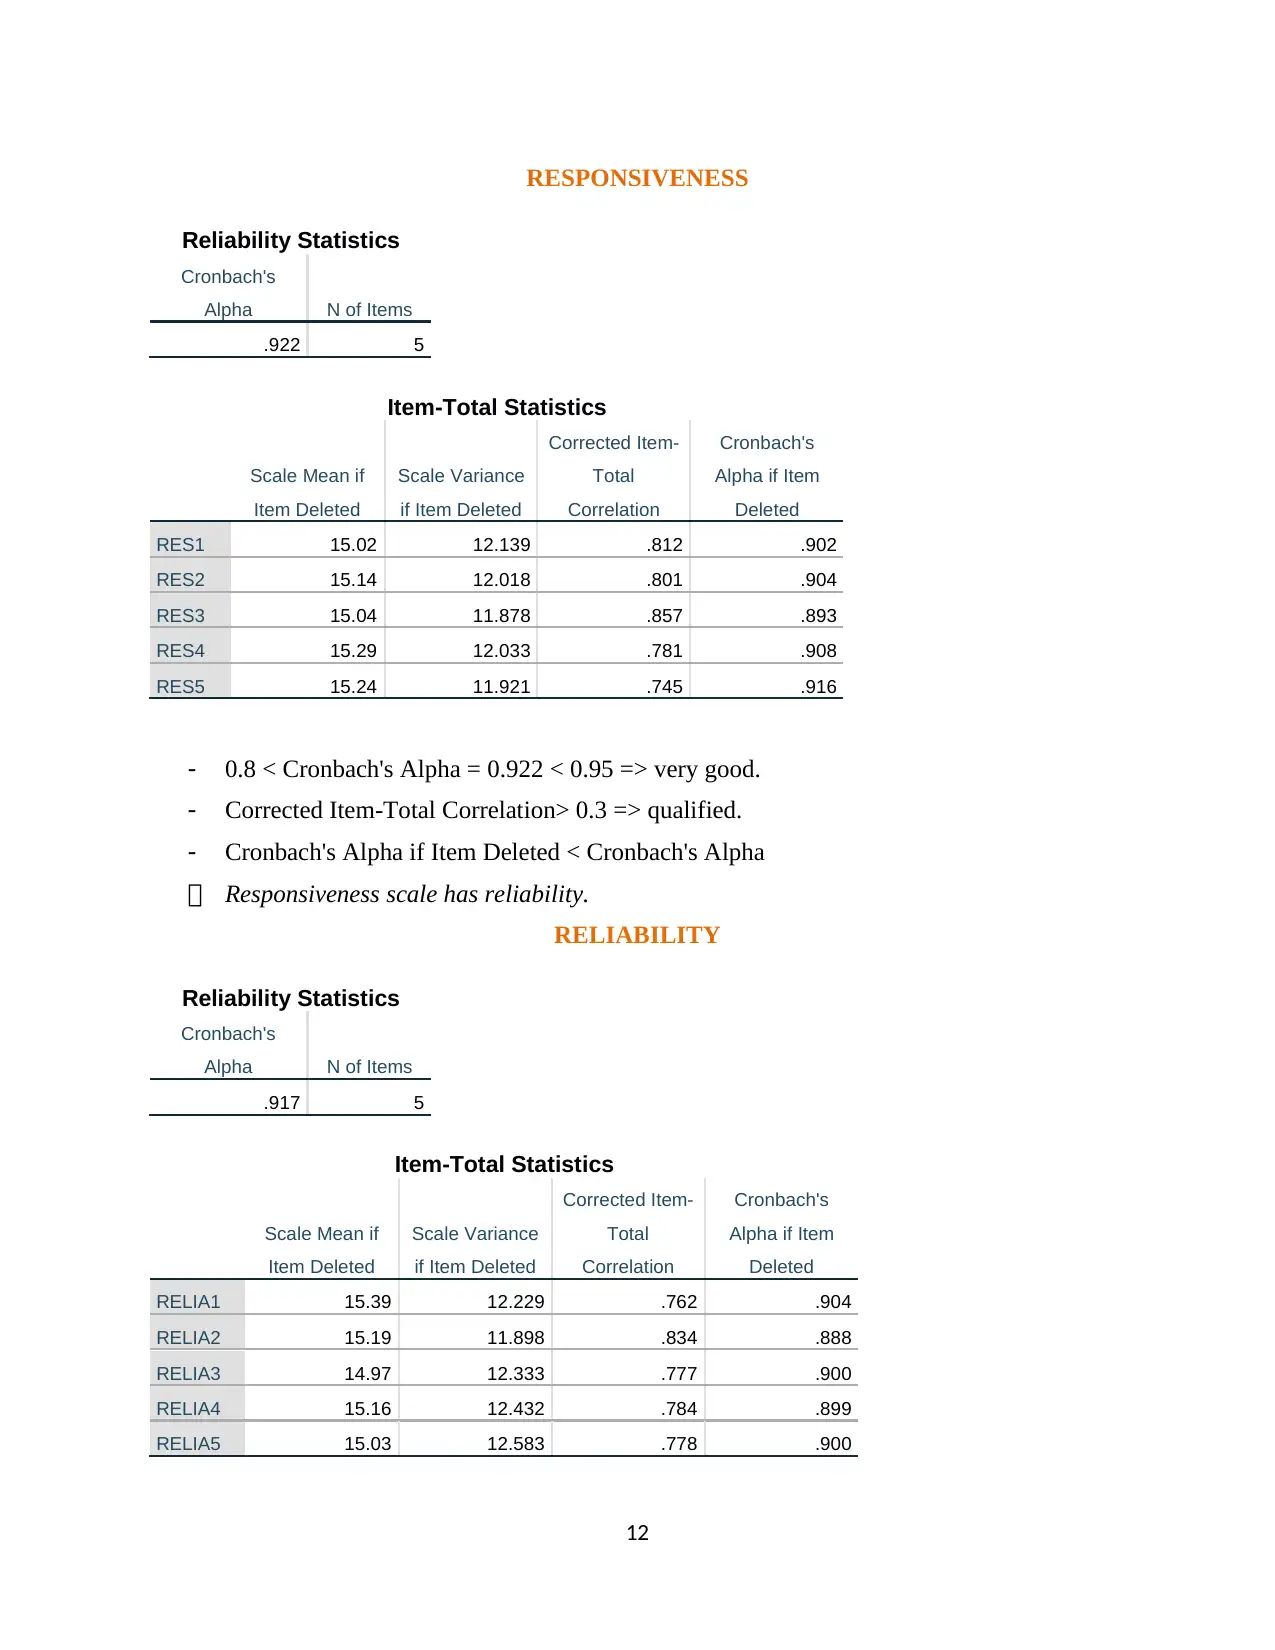
RESPONSIVENESS
Reliability Statistics
Cronbach's
Alpha N of Items
.922 5
Item-Total Statistics
Scale Mean if
Item Deleted
Scale Variance
if Item Deleted
Corrected Item-
Total
Correlation
Cronbach's
Alpha if Item
Deleted
RES1 15.02 12.139 .812 .902
RES2 15.14 12.018 .801 .904
RES3 15.04 11.878 .857 .893
RES4 15.29 12.033 .781 .908
RES5 15.24 11.921 .745 .916
- 0.8 < Cronbach's Alpha = 0.922 < 0.95 => very good.
- Corrected Item-Total Correlation> 0.3 => qualified.
- Cronbach's Alpha if Item Deleted < Cronbach's Alpha
Responsiveness scale has reliability.
RELIABILITY
Reliability Statistics
Cronbach's
Alpha N of Items
.917 5
Item-Total Statistics
Scale Mean if
Item Deleted
Scale Variance
if Item Deleted
Corrected Item-
Total
Correlation
Cronbach's
Alpha if Item
Deleted
RELIA1 15.39 12.229 .762 .904
RELIA2 15.19 11.898 .834 .888
RELIA3 14.97 12.333 .777 .900
RELIA4 15.16 12.432 .784 .899
RELIA5 15.03 12.583 .778 .900
⊘ This is a preview!⊘
Do you want full access?
Subscribe today to unlock all pages.
Trusted by 1+ million students worldwide
1 out of 25
Your All-in-One AI-Powered Toolkit for Academic Success.
+13062052269
info@desklib.com
Available 24*7 on WhatsApp / Email
![[object Object]](/_next/static/media/star-bottom.7253800d.svg)
Unlock your academic potential
Copyright © 2020–2026 A2Z Services. All Rights Reserved. Developed and managed by ZUCOL.