Business Decision Making: Customer Satisfaction & Travel Analysis

Verified

Added on  2023/03/31

|8
|313
|238
Report
AI Summary
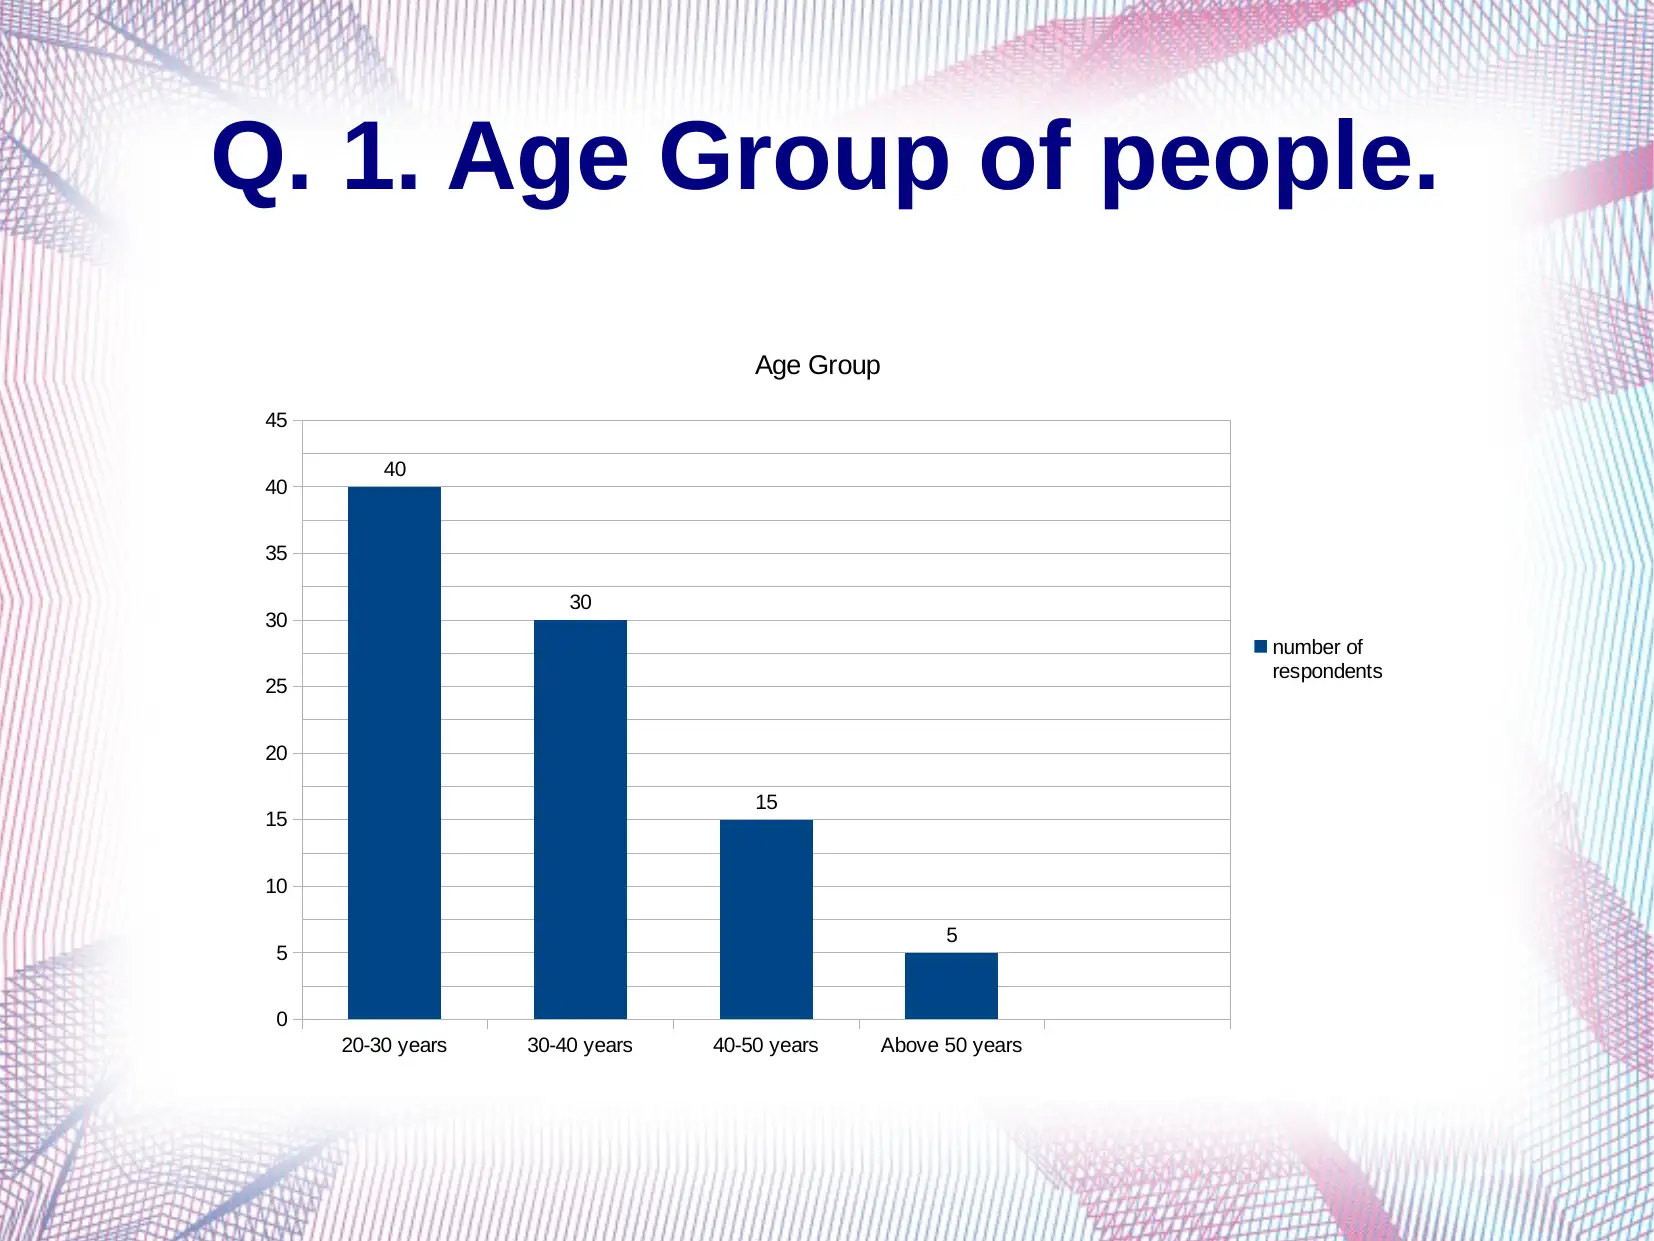
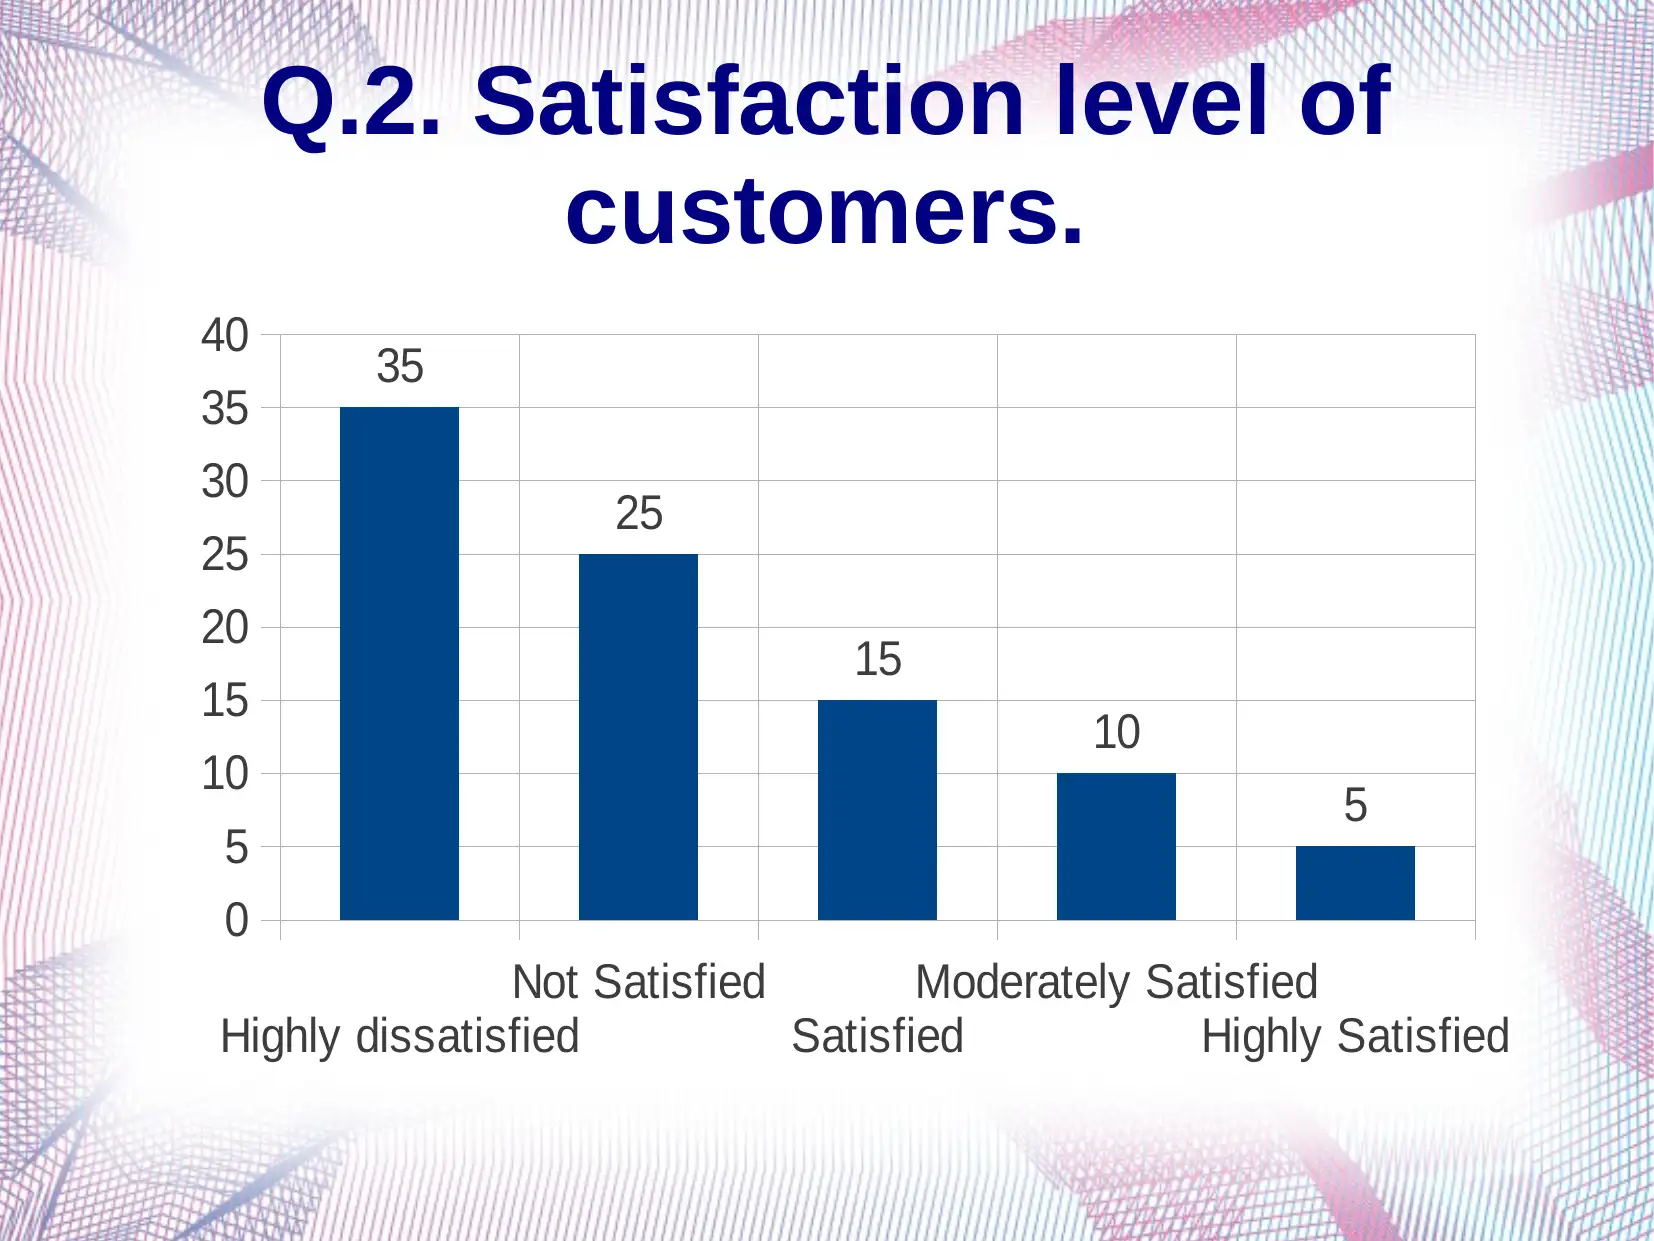
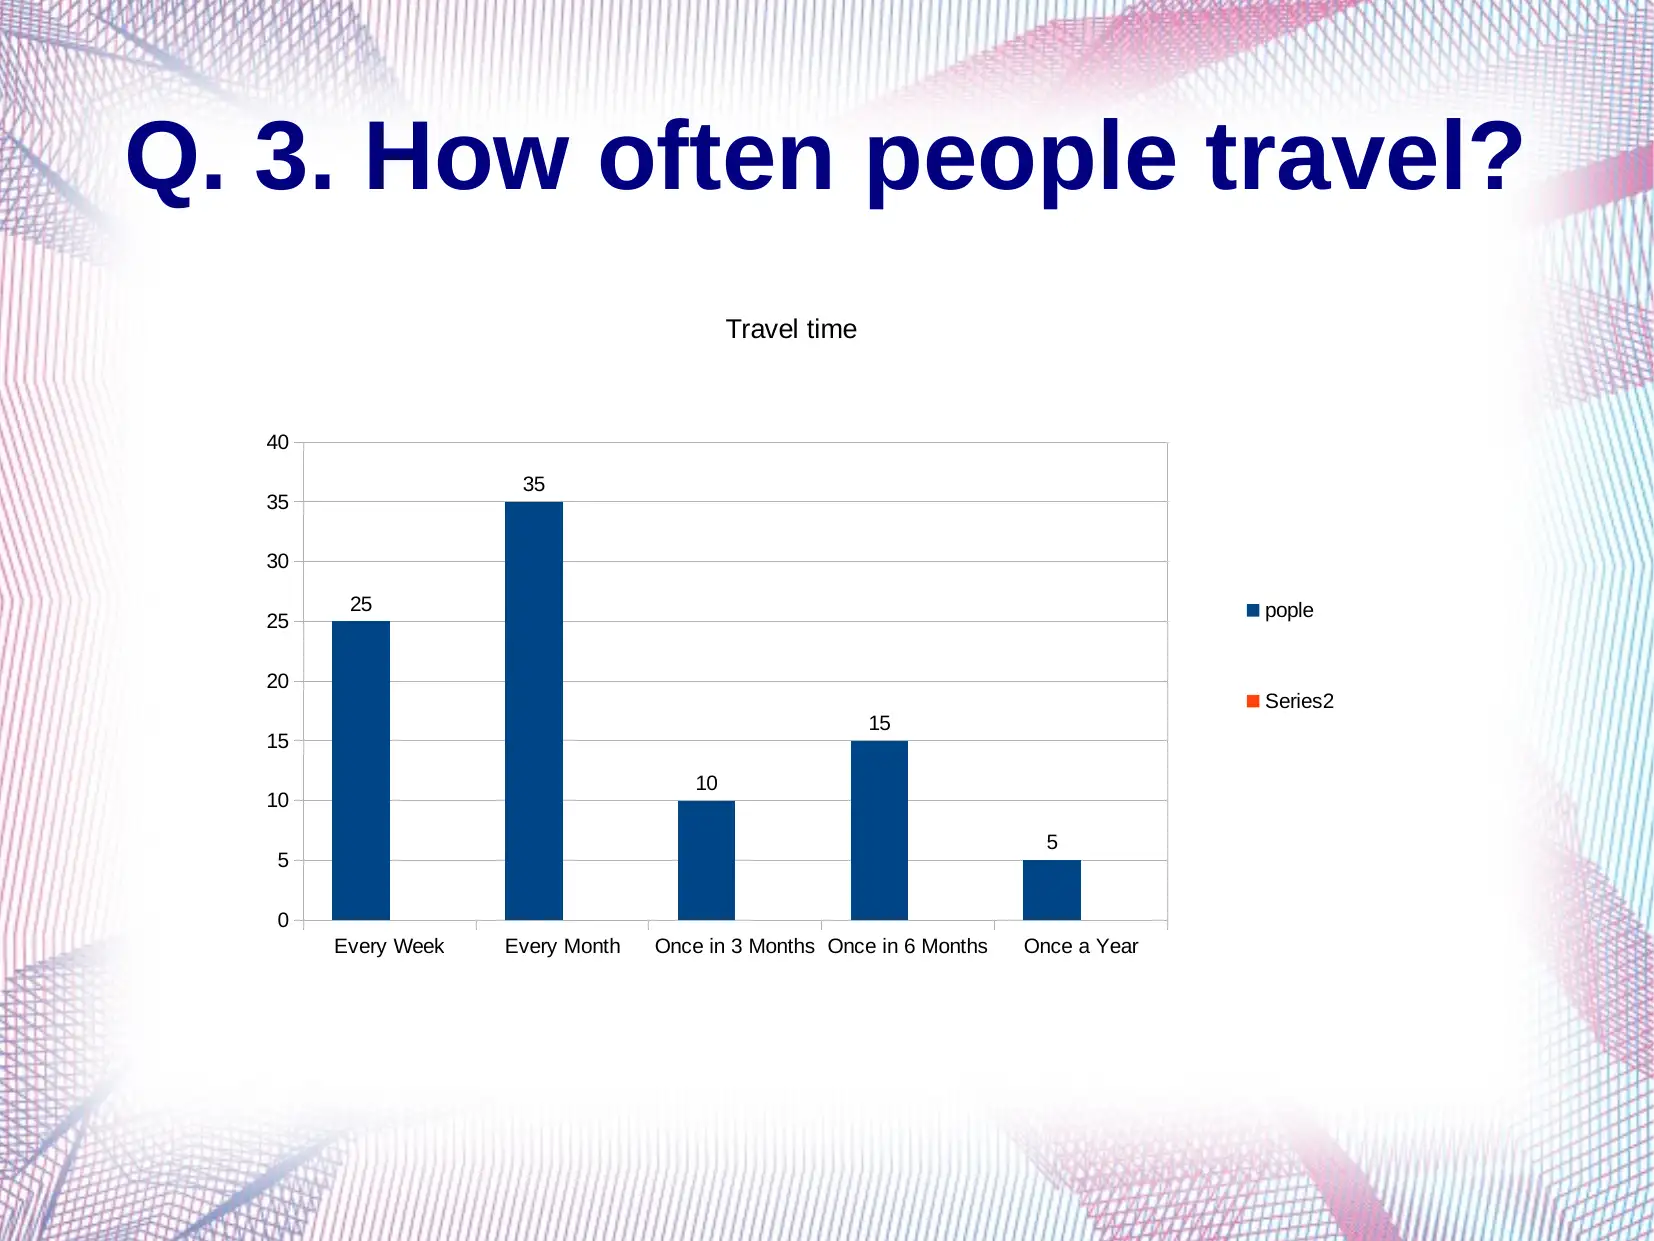
This report analyzes customer data related to travel frequency, age demographics, and satisfaction levels to inform business decision-making. The analysis of age groups reveals that the majority of respondents are in the 20-30 age range, suggesting a focus on this demographic. Satisfaction levels indicate a significant portion of customers are dissatisfied, highlighting the need for service improvements. Travel frequency data shows that most customers travel monthly, indicating a potential for repeat business if service quality is enhanced. The report references studies on extracting knowledge from big data and using informal learning for business decisions, emphasizing the importance of data-driven strategies. Desklib provides access to similar solved assignments and past papers for students.
Document Page
Business Decision
making
tabler-icon-diamond-filled.svg

Paraphrase This Document

Need a fresh take? Get an instant paraphrase of this document with our AI Paraphraser
Document Page
Q. 1. Age Group of people.
20-30 years 30-40 years 40-50 years Above 50 years
0
5
10
15
20
25
30
35
40
45
40
30
15
5
Age Group
number of
respondents
Document Page
Interpretation
From the graph, we can conclude the major respondents are from
the age group of 20-30 years who are fond of traveling. Hence the
focus of the company should shift to this age groups as the major
portion lies with them and they affects the profitability.
Document Page
Q.2. Satisfaction level of
customers.
Highly dissatisfied
Not Satisfied
Satisfied
Moderately Satisfied
Highly Satisfied
0
5
10
15
20
25
30
35
40 35
25
15
10
5
tabler-icon-diamond-filled.svg

Paraphrase This Document

Need a fresh take? Get an instant paraphrase of this document with our AI Paraphraser
Document Page
Interpretation
From the above we can conclude that the major people are
dissatisfied with the service provided by the company. The people
who are highly satisfies are just 5 people which means that the
quality of service should be improved.
Document Page
Q. 3. How often people travel?
Every Week Every Month Once in 3 Months Once in 6 Months Once a Year
0
5
10
15
20
25
30
35
40
25
35
10
15
5
Travel time
pople
Series2
Document Page
Interpretation
Here we can say that maximum people usually prefer to travel
every month. Hence if better services are provided to them they
will continue utilizing the service form the current operator only.
These are created by connecting the actual data points.
tabler-icon-diamond-filled.svg

Paraphrase This Document

Need a fresh take? Get an instant paraphrase of this document with our AI Paraphraser
Document Page
References
Alexakos, C. and et.al., 2016. ERMIS: Extracting Knowledge from
Unstructured Big Data for Supporting Business Decision Making. In IFIP
International Conference on Artificial Intelligence Applications and
Innovations (pp. 611-622). Springer International Publishing.
García-Peñalvo, F.J. and Conde, M.Á., 2014. Using informal learning for
business decision making and knowledge management. Journal of Business
Research. 67(5). pp.686-691.
Sutherland, L.A. and Holstead, K.L., 2014. Future-proofing the farm: On-
farm wind turbine development in farm business decision-making. Land
Use Policy. 36. pp.102-112.
chevron_up_icon
1 out of 8
circle_padding
hide_on_mobile
zoom_out_icon
[object Object]