Customer Satisfaction Analysis and Recommendations for Woolworths
VerifiedAdded on 2020/04/07
|17
|2993
|480
Report
AI Summary
This report presents an analysis of customer satisfaction with Woolworths, based on a survey conducted with 20 customers in Sydney. The study examined customer demographics, spending habits, shopping preferences (online vs. in-store), and opinions on store cleanliness and overall satisfaction. Key findings include average spending per visit, preferred shopping methods, and satisfaction levels. The report also includes hypothesis testing, comparing recommendation ratings and spending between male and female customers. The results indicate no significant difference in recommendation ratings between genders, but a significant difference in average spending, with males spending more. The report concludes with recommendations for Woolworths to improve customer service and business practices, including a focus on online shopping preferences and store cleanliness.
Customers’ satisfaction survey
Name
Institution
Instructor
25th September 2017
1
Name
Institution
Instructor
25th September 2017
1
Paraphrase This Document
Need a fresh take? Get an instant paraphrase of this document with our AI Paraphraser
Executive summary
The main aim of this report was to analyse the customer satisfaction in regard to the Woolworth
services and make recommendations to the Woolworths management on the best practises to
help them improve their business base as well as satisfy their customers more effectively. A
sample of 20 customers was used with 70% (n = 14) being female participants and 30% (n = 6)
being the male participants. The following were the key findings from the study;
On average the participants in the study said to spend $107.75 every time they visit the
store with a median spending being $100.
Male customers spend more on their visit to the store as compared to the female
customers
No difference in terms of recommendation ratings between the male and the female
customers.
Most customers (50%, n = 10) would prefer online shopping, 35% (n = 7) would prefer
walk through to store while only 15% (n = 3)
Majority of the customers (55%, n = 11) visit the stores less than 3 times in a month
while 45% (n = 9) visit more than 3 times a month.
2
Table of Contents
Executive summary.........................................................................................................................2
Introduction......................................................................................................................................4
Method of data collection................................................................................................................5
Introduction..................................................................................................................................5
Subject Selection..........................................................................................................................5
Instrumentation............................................................................................................................5
Data Collection............................................................................................................................5
Data Analysis...............................................................................................................................6
Limitations...................................................................................................................................6
Summary of the data set..................................................................................................................6
Demographic profile of the customers.........................................................................................6
Gender......................................................................................................................................6
Age...........................................................................................................................................7
Income levels............................................................................................................................7
Frequency of visits...................................................................................................................8
Shopping method......................................................................................................................9
Product most spent on..............................................................................................................9
Opinion in regard to cleanliness and organization of stores....................................................9
Overall satisfaction with Woolworth services........................................................................10
Data analysis..................................................................................................................................10
Hypothesis Testing........................................................................................................................11
Conclusion and recommendations.................................................................................................13
Recommendations......................................................................................................................13
References......................................................................................................................................14
Appendixes....................................................................................................................................15
A1: Questionnaire......................................................................................................................15
A2: Computation of the mean and standard deviation...............................................................16
A3: Confidence Interval.............................................................................................................16
3
⊘ This is a preview!⊘
Do you want full access?
Subscribe today to unlock all pages.
Trusted by 1+ million students worldwide
Introduction
This report gives a rundown of the reasons, the procedure and the consequences of the customer
fulfilment review for the Woolworths. Woolworths is Australia's biggest market chain. The chain
operates 995 stores crosswise over Australia and it depends on the 115,000 colleagues in stores,
distribution centres and bolster workplaces to furnish their clients with unrivalled administration,
range, esteem and comfort (Croy, 2015). The review is one means through which Woolworths
can give a voice to their customers. It is a systematic approach to recognize what is working and
what should be enhanced from the customers' vantage point. This particular survey was
performed based on the following reasons which also guided the design and construct of the
survey.
To report where customers are fulfilled alongside where they are disappointed and to
recognize what gaps makes customers to be disappointed.
To discover what changes are imperative to customers.
To utilize this information to organize the continuous change activities that will make it
for the Woolworth customers save on time.
A definitive objective is to give an astounding customer services as well as business needs of the
Woolworths. In the close term the objective is to enhance the customers' capacity to utilize
Woolworth’s items.
4
Paraphrase This Document
Need a fresh take? Get an instant paraphrase of this document with our AI Paraphraser
Method of data collection
Introduction
This section presents the method and procedure utilized in this study, as follows: 1) sample
selection, 2) survey instrument, 3) data collection, 4) data analysis, and 5) limitations.
Subject Selection
The population in this study was customers leaving the Woolworth stores in Sydney. The sample
size of 20 was set for the survey. The researcher administered the questionnaires to the customers
leaving the stores.
Instrumentation
To test the objectives of the study, a survey was used to collect data for the study (Saris &
Gallhofer, 2014). A self-administrated survey was used on a sample of Woolworth customers.
The survey was comprised of 10 close ended questions. The questionnaire has been attached in
appendix A1.
Data Collection
The potential participants were given a set of questionnaire to fill. The questionnaires were
estimated to take not more than 5 minutes to be filled. A participation consent form was attached
to each survey to explain the purpose of the study, that their participation in this research was
voluntary and anonymous, and that there was no risk and harm to completing a survey. To
increase the return rate of the survey, the researcher stayed not far away from where the
participants were filling in the forms.
5
Data Analysis
Data was entered and analysed through the Data Analysis Add in option found in excel. With the
Pivot tables from excel, the frequencies of respondents were tabulated. In this research, Chi-
Square test of association as well as t-test was employed by the researcher to verify the
hypothesis.
Limitations
Two main limitations were identified in this study. These challenges/limitations are:
1. A small sample size that is not representative was used for this study; this means that the
results of this study cannot be generalized for the whole population. In addition, the data
collection was only done in one city only making it hard to understand the felling of
customers from other cities
2. Random sampling was not possible in this case; the researcher mostly relied on
convenience where participants who seemed to be willing to participate were selected to
participate.
Summary of the data set
Demographic profile of the customers
In order to clearly understand and analyze customer’s characteristics, it is recommended that the
researcher gathers basic demographic data such as age, gender as well as income of the
customers (Harry , 2006). It is on this premise that we generated the demographic profile of the
customers interviewed.
6
⊘ This is a preview!⊘
Do you want full access?
Subscribe today to unlock all pages.
Trusted by 1+ million students worldwide
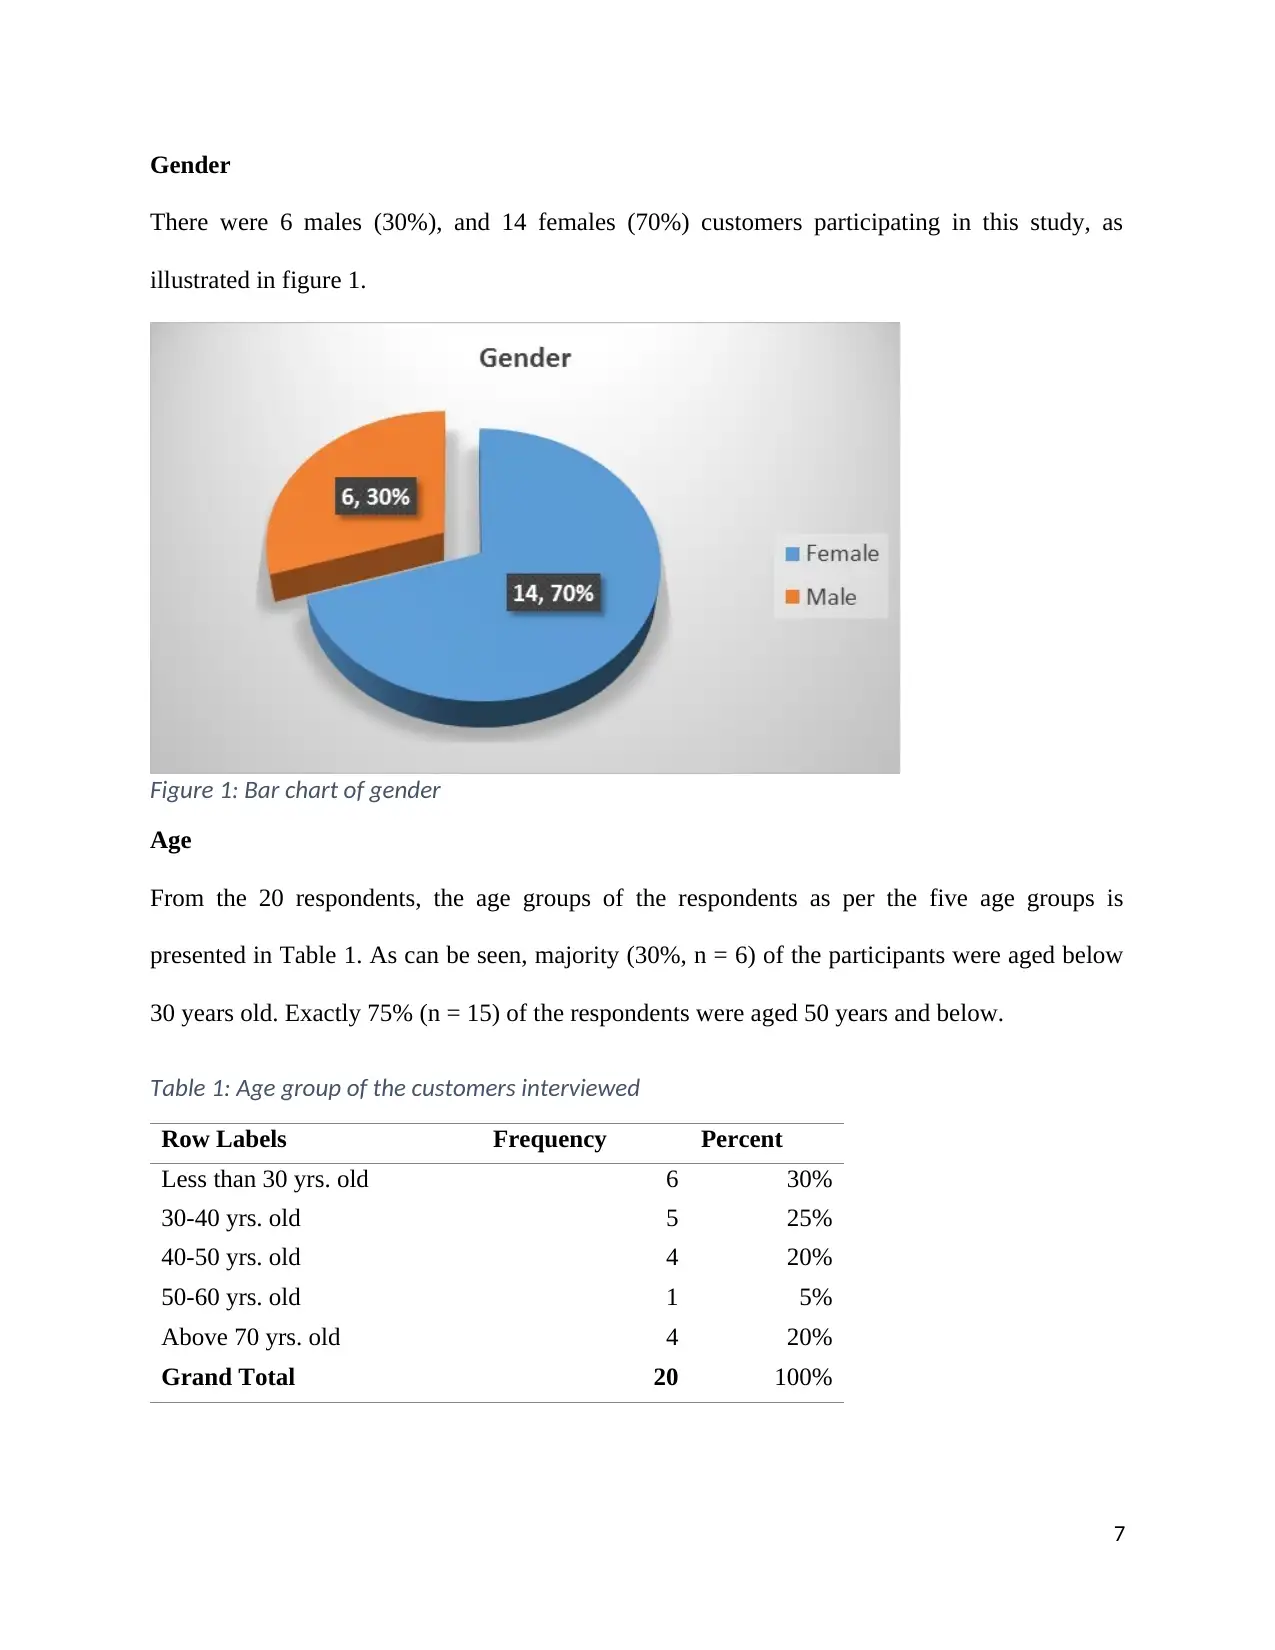
Gender
There were 6 males (30%), and 14 females (70%) customers participating in this study, as
illustrated in figure 1.
Figure 1: Bar chart of gender
Age
From the 20 respondents, the age groups of the respondents as per the five age groups is
presented in Table 1. As can be seen, majority (30%, n = 6) of the participants were aged below
30 years old. Exactly 75% (n = 15) of the respondents were aged 50 years and below.
Table 1: Age group of the customers interviewed
Row Labels Frequency Percent
Less than 30 yrs. old 6 30%
30-40 yrs. old 5 25%
40-50 yrs. old 4 20%
50-60 yrs. old 1 5%
Above 70 yrs. old 4 20%
Grand Total 20 100%
7
Paraphrase This Document
Need a fresh take? Get an instant paraphrase of this document with our AI Paraphraser
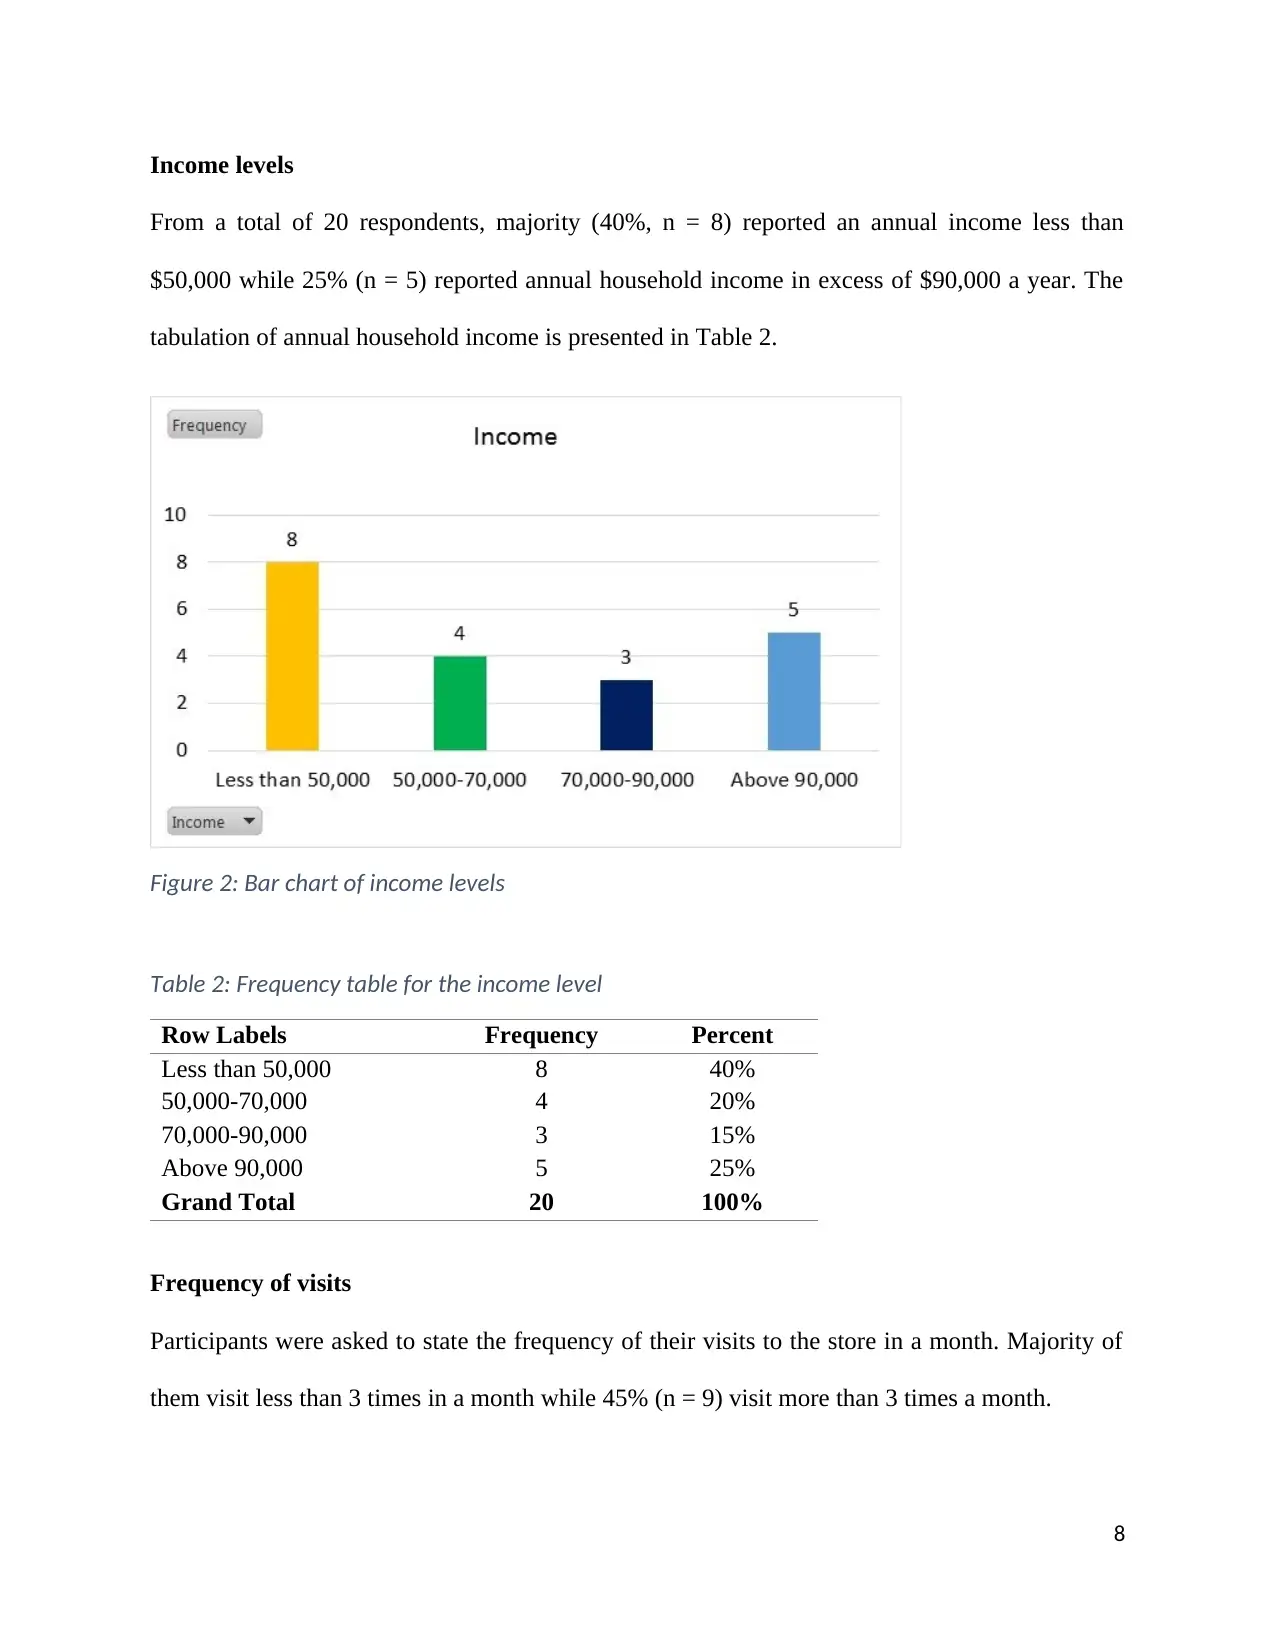
Income levels
From a total of 20 respondents, majority (40%, n = 8) reported an annual income less than
$50,000 while 25% (n = 5) reported annual household income in excess of $90,000 a year. The
tabulation of annual household income is presented in Table 2.
Figure 2: Bar chart of income levels
Table 2: Frequency table for the income level
Row Labels Frequency Percent
Less than 50,000 8 40%
50,000-70,000 4 20%
70,000-90,000 3 15%
Above 90,000 5 25%
Grand Total 20 100%
Frequency of visits
Participants were asked to state the frequency of their visits to the store in a month. Majority of
them visit less than 3 times in a month while 45% (n = 9) visit more than 3 times a month.
8
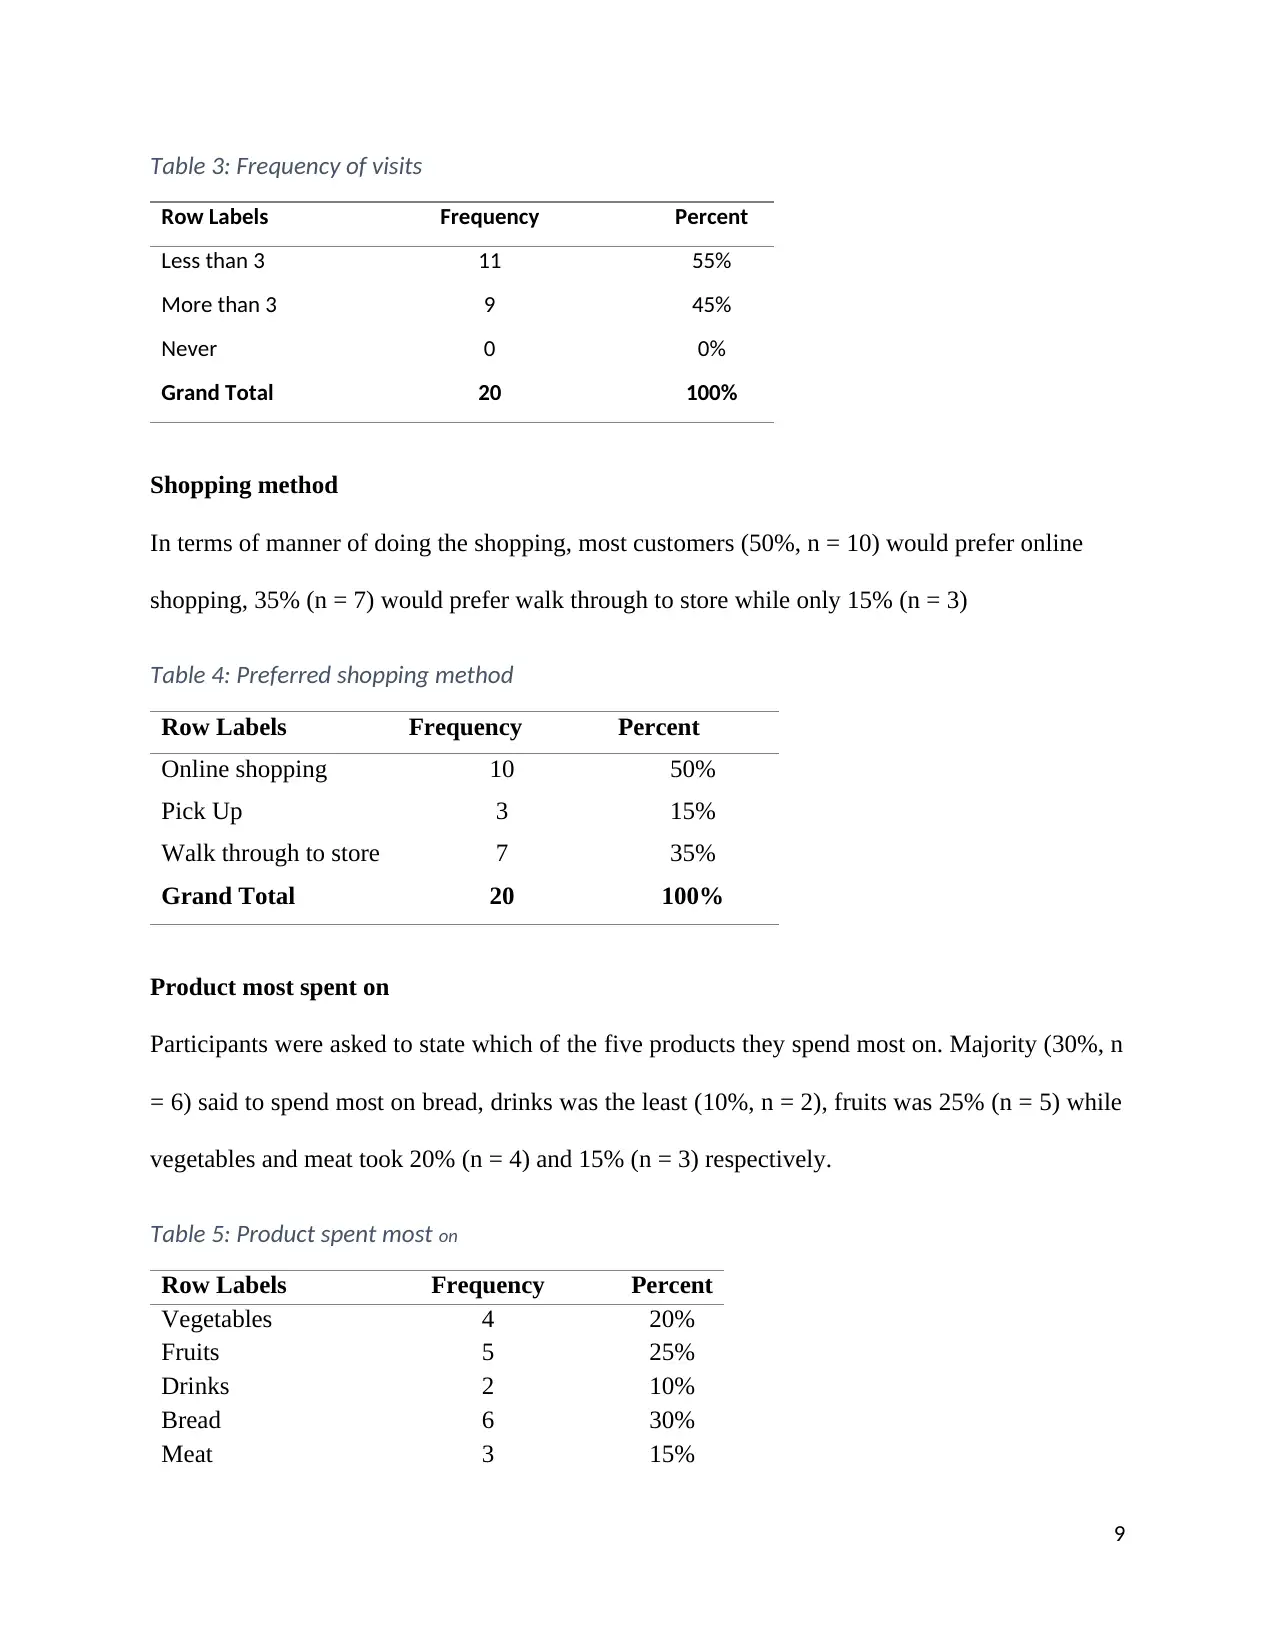
Table 3: Frequency of visits
Row Labels Frequency Percent
Less than 3 11 55%
More than 3 9 45%
Never 0 0%
Grand Total 20 100%
Shopping method
In terms of manner of doing the shopping, most customers (50%, n = 10) would prefer online
shopping, 35% (n = 7) would prefer walk through to store while only 15% (n = 3)
Table 4: Preferred shopping method
Row Labels Frequency Percent
Online shopping 10 50%
Pick Up 3 15%
Walk through to store 7 35%
Grand Total 20 100%
Product most spent on
Participants were asked to state which of the five products they spend most on. Majority (30%, n
= 6) said to spend most on bread, drinks was the least (10%, n = 2), fruits was 25% (n = 5) while
vegetables and meat took 20% (n = 4) and 15% (n = 3) respectively.
Table 5: Product spent most on
Row Labels Frequency Percent
Vegetables 4 20%
Fruits 5 25%
Drinks 2 10%
Bread 6 30%
Meat 3 15%
9
Row Labels Frequency Percent
Less than 3 11 55%
More than 3 9 45%
Never 0 0%
Grand Total 20 100%
Shopping method
In terms of manner of doing the shopping, most customers (50%, n = 10) would prefer online
shopping, 35% (n = 7) would prefer walk through to store while only 15% (n = 3)
Table 4: Preferred shopping method
Row Labels Frequency Percent
Online shopping 10 50%
Pick Up 3 15%
Walk through to store 7 35%
Grand Total 20 100%
Product most spent on
Participants were asked to state which of the five products they spend most on. Majority (30%, n
= 6) said to spend most on bread, drinks was the least (10%, n = 2), fruits was 25% (n = 5) while
vegetables and meat took 20% (n = 4) and 15% (n = 3) respectively.
Table 5: Product spent most on
Row Labels Frequency Percent
Vegetables 4 20%
Fruits 5 25%
Drinks 2 10%
Bread 6 30%
Meat 3 15%
9
⊘ This is a preview!⊘
Do you want full access?
Subscribe today to unlock all pages.
Trusted by 1+ million students worldwide
Grand Total 20 100%
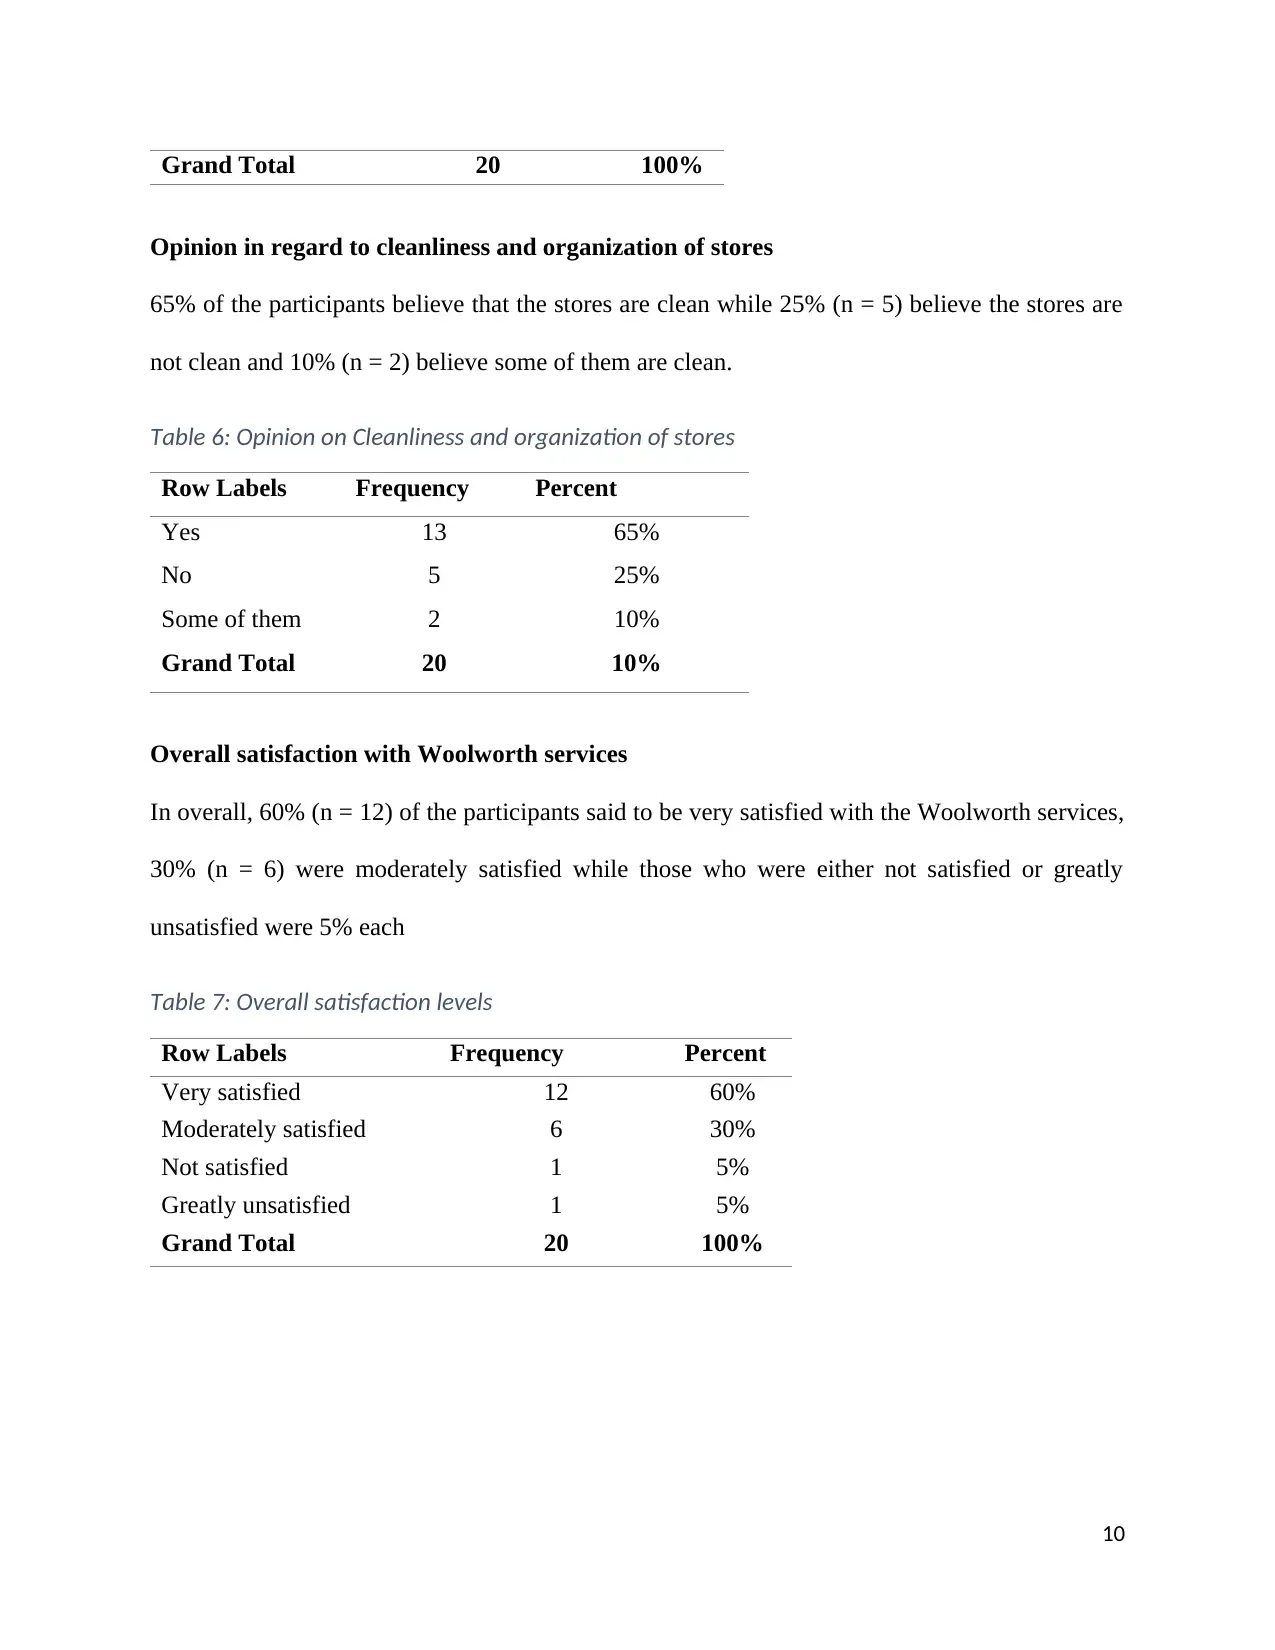
Opinion in regard to cleanliness and organization of stores
65% of the participants believe that the stores are clean while 25% (n = 5) believe the stores are
not clean and 10% (n = 2) believe some of them are clean.
Table 6: Opinion on Cleanliness and organization of stores
Row Labels Frequency Percent
Yes 13 65%
No 5 25%
Some of them 2 10%
Grand Total 20 10%
Overall satisfaction with Woolworth services
In overall, 60% (n = 12) of the participants said to be very satisfied with the Woolworth services,
30% (n = 6) were moderately satisfied while those who were either not satisfied or greatly
unsatisfied were 5% each
Table 7: Overall satisfaction levels
Row Labels Frequency Percent
Very satisfied 12 60%
Moderately satisfied 6 30%
Not satisfied 1 5%
Greatly unsatisfied 1 5%
Grand Total 20 100%
10
Paraphrase This Document
Need a fresh take? Get an instant paraphrase of this document with our AI Paraphraser
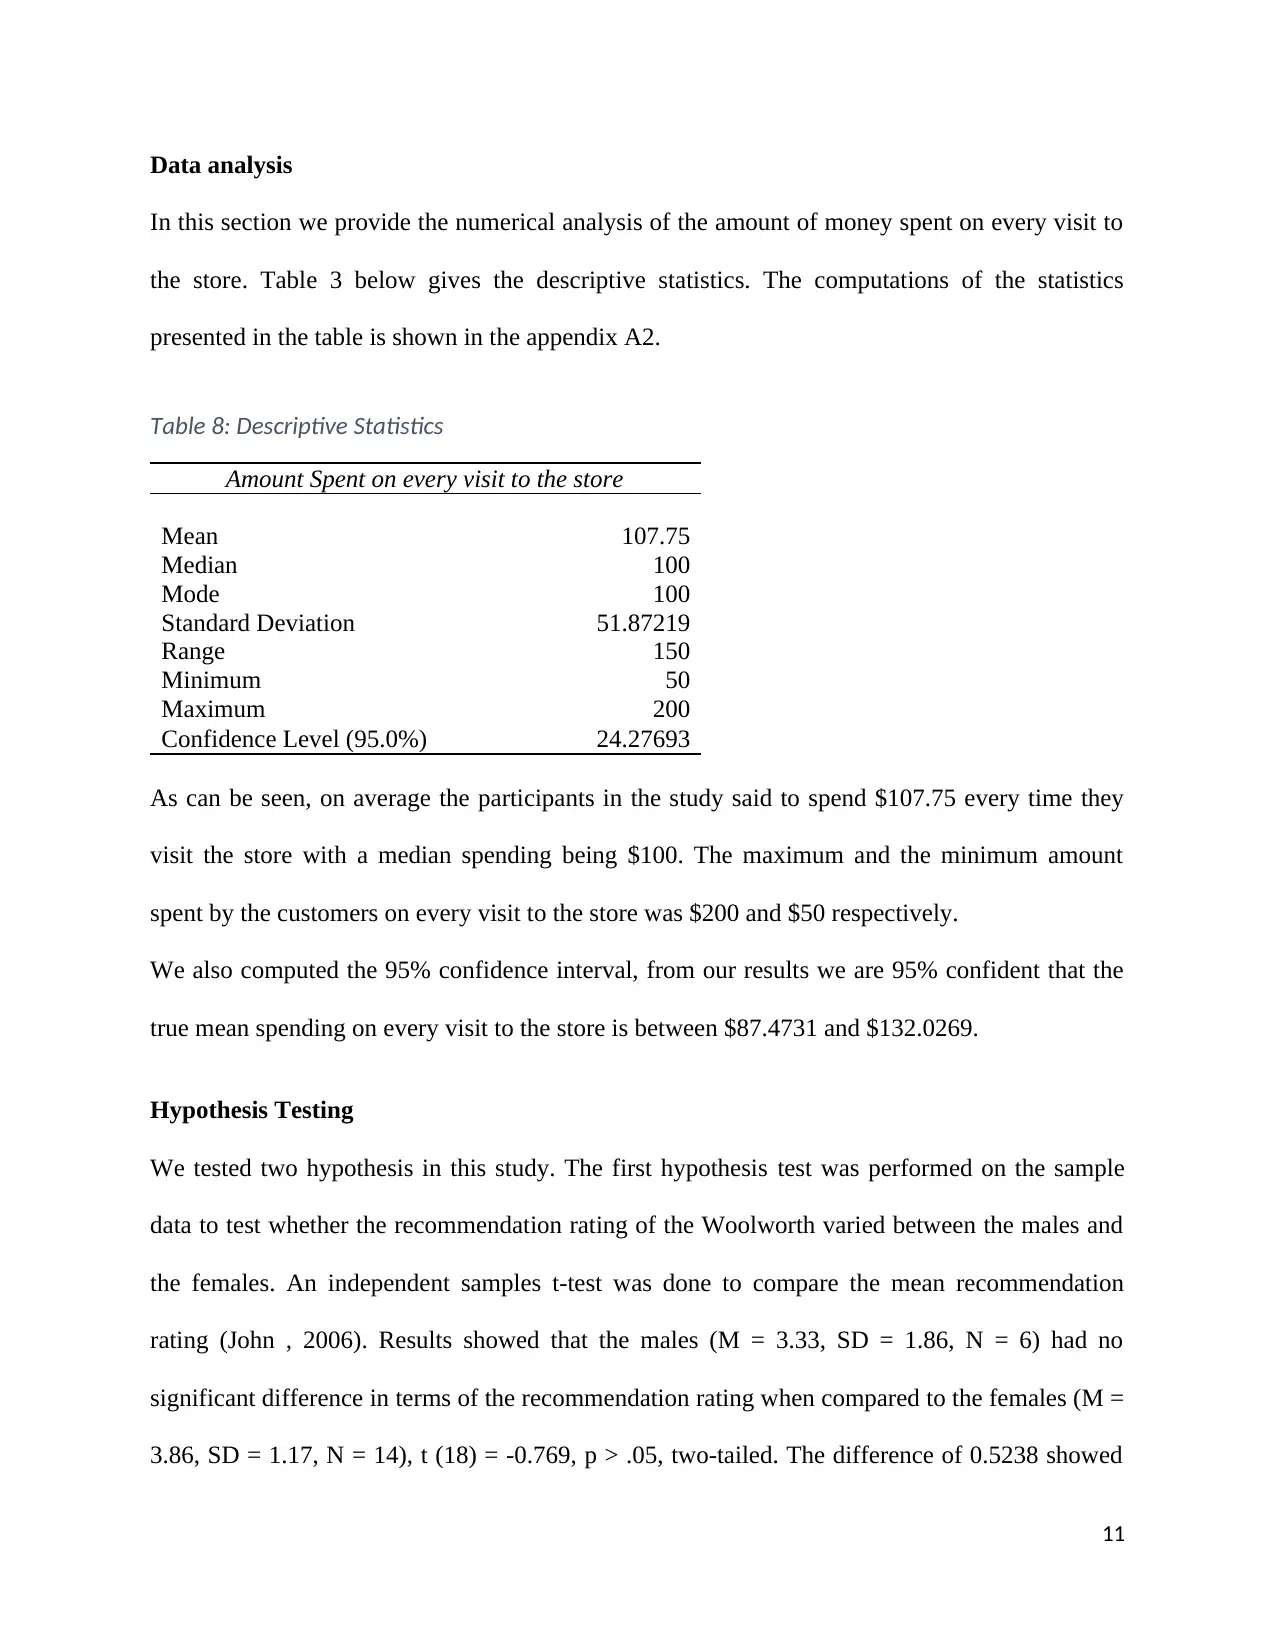
Data analysis
In this section we provide the numerical analysis of the amount of money spent on every visit to
the store. Table 3 below gives the descriptive statistics. The computations of the statistics
presented in the table is shown in the appendix A2.
Table 8: Descriptive Statistics
Amount Spent on every visit to the store
Mean 107.75
Median 100
Mode 100
Standard Deviation 51.87219
Range 150
Minimum 50
Maximum 200
Confidence Level (95.0%) 24.27693
As can be seen, on average the participants in the study said to spend $107.75 every time they
visit the store with a median spending being $100. The maximum and the minimum amount
spent by the customers on every visit to the store was $200 and $50 respectively.
We also computed the 95% confidence interval, from our results we are 95% confident that the
true mean spending on every visit to the store is between $87.4731 and $132.0269.
Hypothesis Testing
We tested two hypothesis in this study. The first hypothesis test was performed on the sample
data to test whether the recommendation rating of the Woolworth varied between the males and
the females. An independent samples t-test was done to compare the mean recommendation
rating (John , 2006). Results showed that the males (M = 3.33, SD = 1.86, N = 6) had no
significant difference in terms of the recommendation rating when compared to the females (M =
3.86, SD = 1.17, N = 14), t (18) = -0.769, p > .05, two-tailed. The difference of 0.5238 showed
11
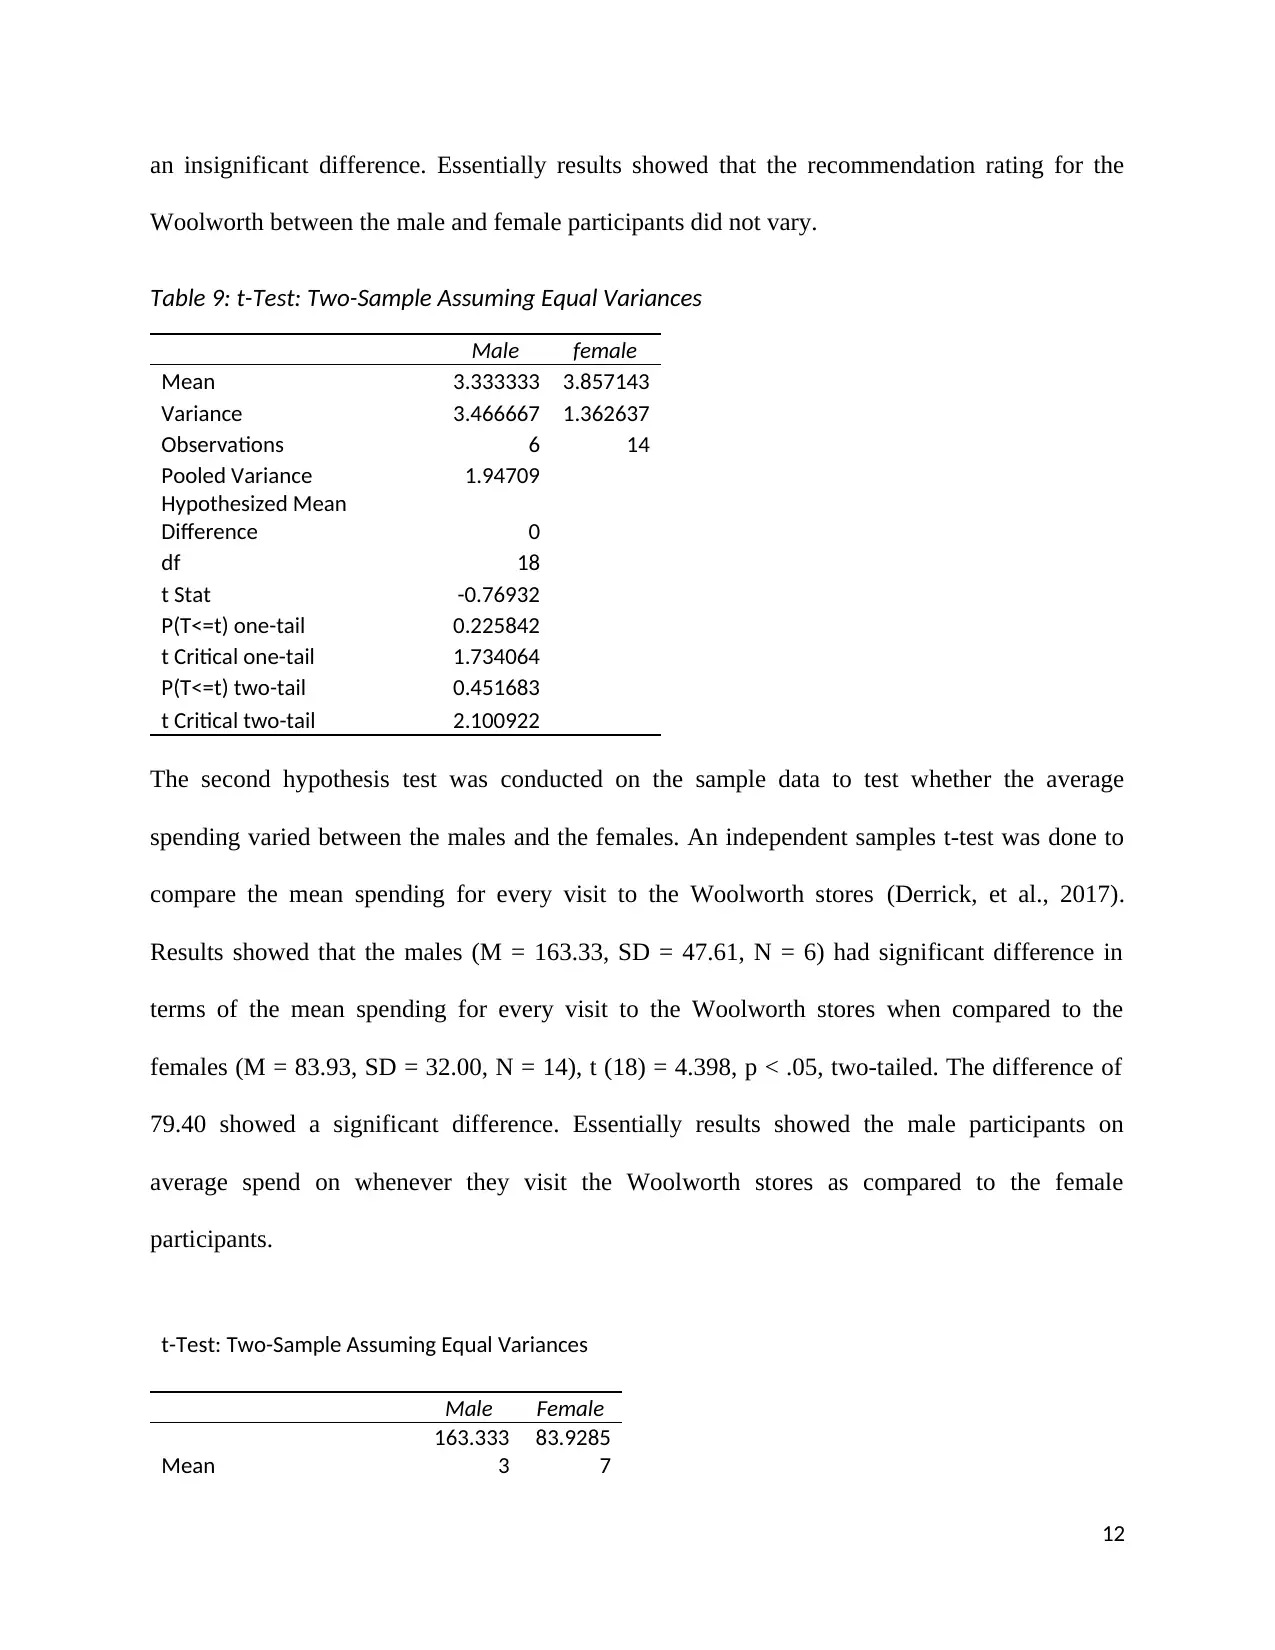
an insignificant difference. Essentially results showed that the recommendation rating for the
Woolworth between the male and female participants did not vary.
Table 9: t-Test: Two-Sample Assuming Equal Variances
Male female
Mean 3.333333 3.857143
Variance 3.466667 1.362637
Observations 6 14
Pooled Variance 1.94709
Hypothesized Mean
Difference 0
df 18
t Stat -0.76932
P(T<=t) one-tail 0.225842
t Critical one-tail 1.734064
P(T<=t) two-tail 0.451683
t Critical two-tail 2.100922
The second hypothesis test was conducted on the sample data to test whether the average
spending varied between the males and the females. An independent samples t-test was done to
compare the mean spending for every visit to the Woolworth stores (Derrick, et al., 2017).
Results showed that the males (M = 163.33, SD = 47.61, N = 6) had significant difference in
terms of the mean spending for every visit to the Woolworth stores when compared to the
females (M = 83.93, SD = 32.00, N = 14), t (18) = 4.398, p < .05, two-tailed. The difference of
79.40 showed a significant difference. Essentially results showed the male participants on
average spend on whenever they visit the Woolworth stores as compared to the female
participants.
t-Test: Two-Sample Assuming Equal Variances
Male Female
Mean
163.333
3
83.9285
7
12
⊘ This is a preview!⊘
Do you want full access?
Subscribe today to unlock all pages.
Trusted by 1+ million students worldwide
1 out of 17
Related Documents


Your All-in-One AI-Powered Toolkit for Academic Success.
+13062052269
info@desklib.com
Available 24*7 on WhatsApp / Email
![[object Object]](/_next/static/media/star-bottom.7253800d.svg)
Unlock your academic potential
Copyright © 2020–2026 A2Z Services. All Rights Reserved. Developed and managed by ZUCOL.