Customer Analytics and Social Media: Case Study Analysis Report

Verified

Added on  2022/12/27

|10
|728
|1
Report
AI Summary
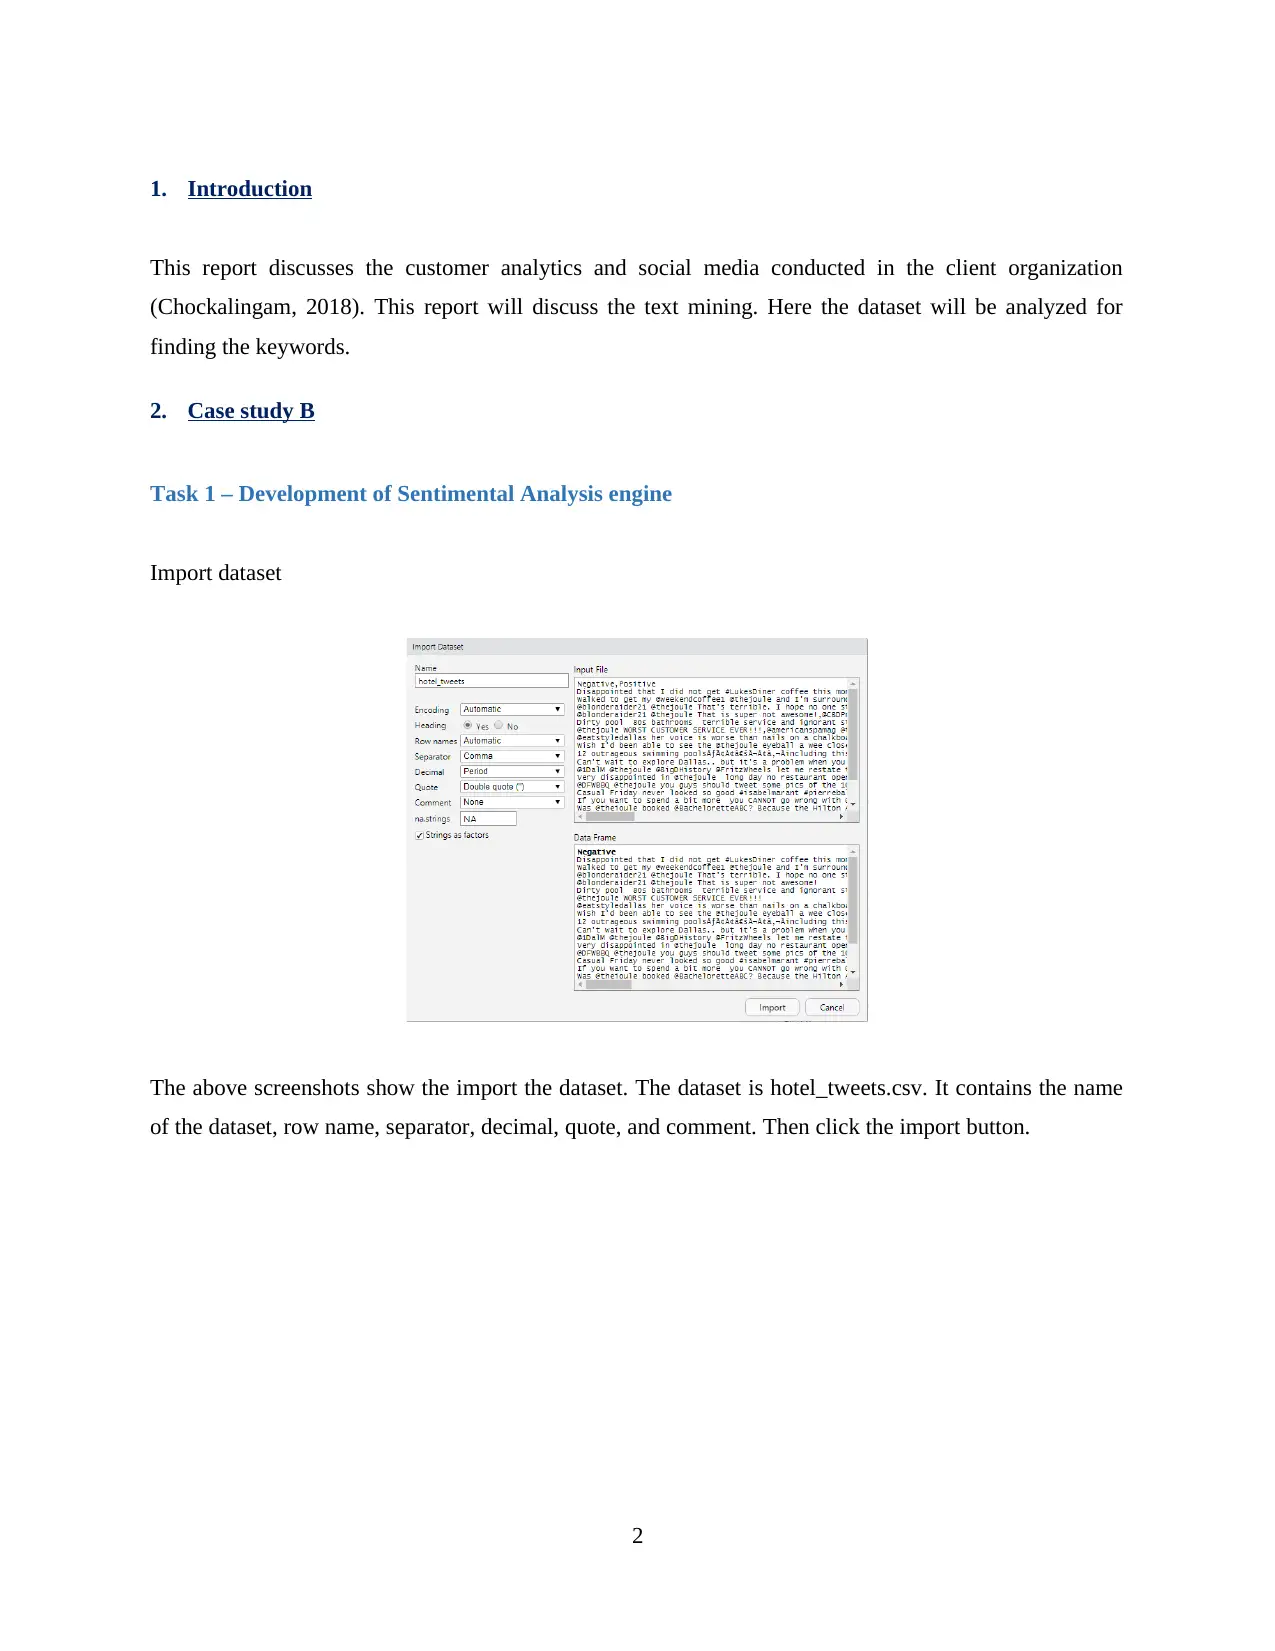
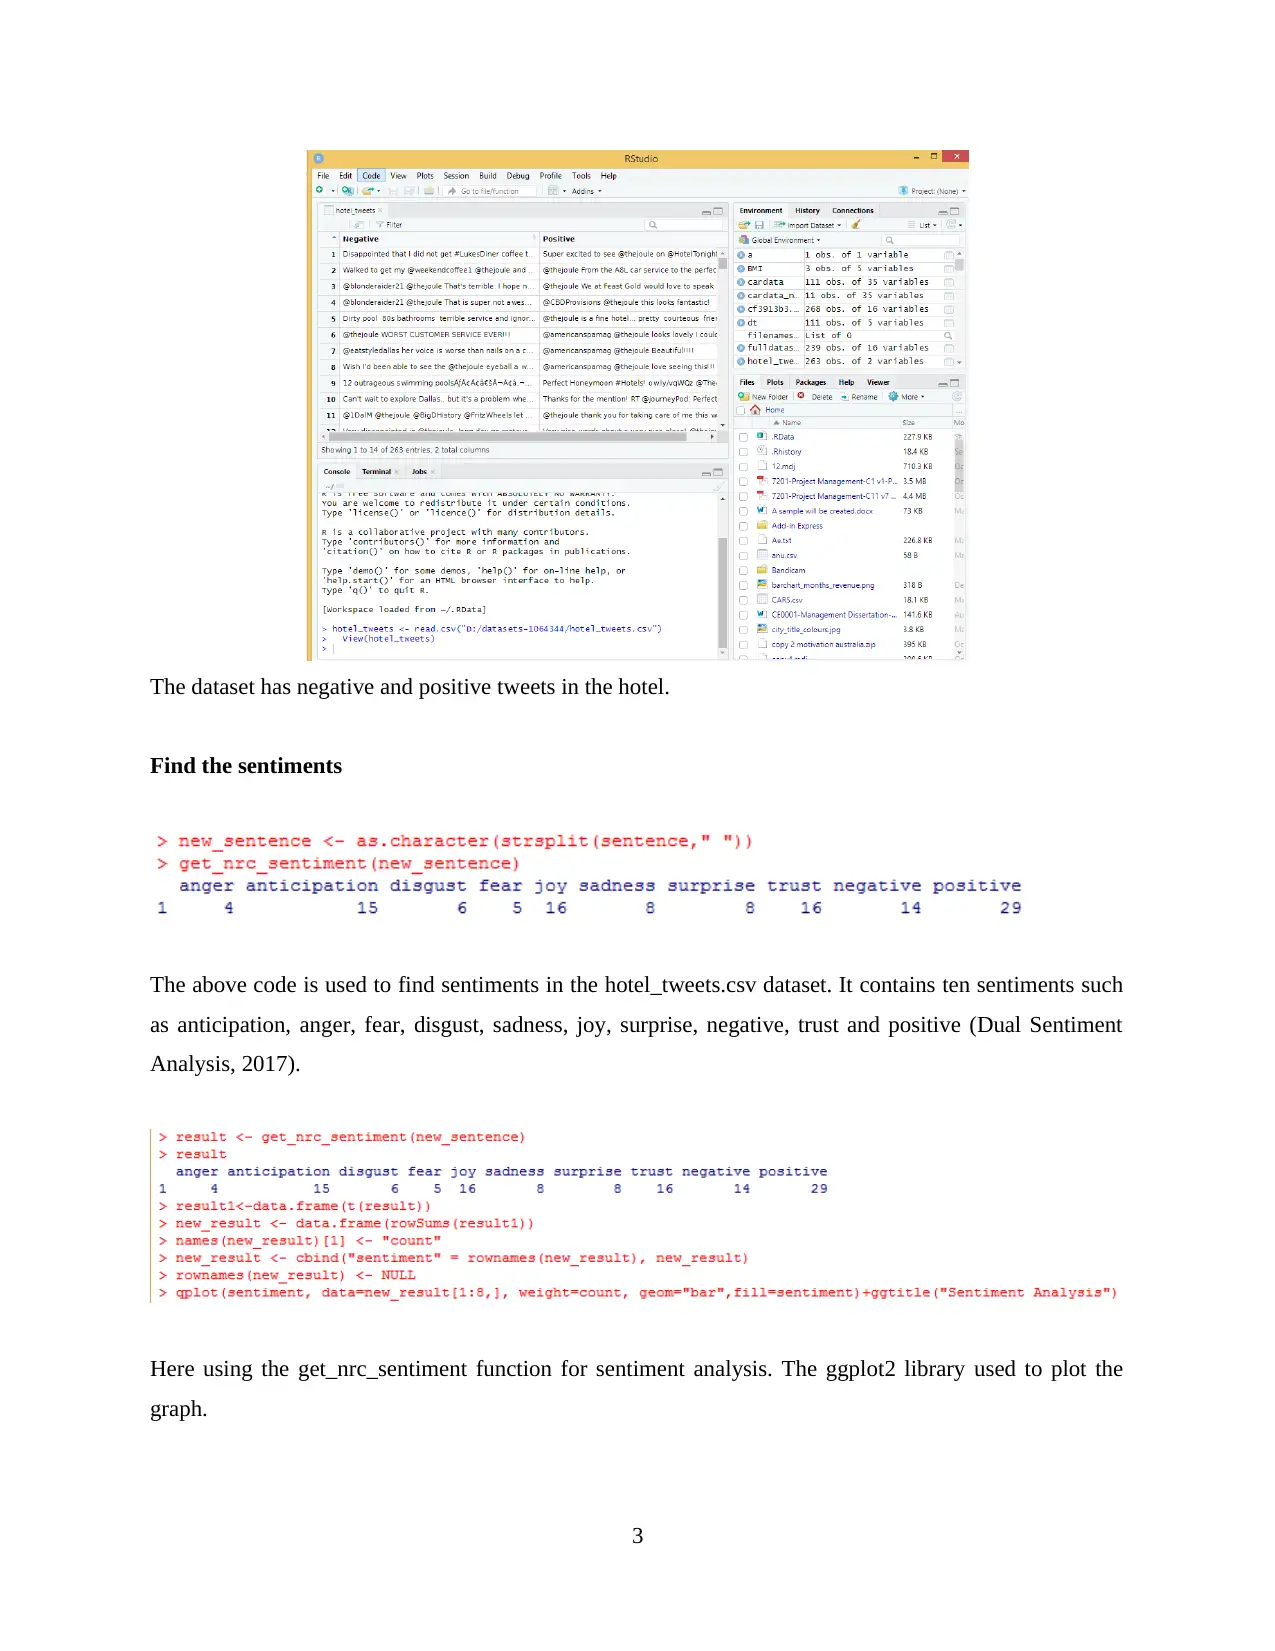
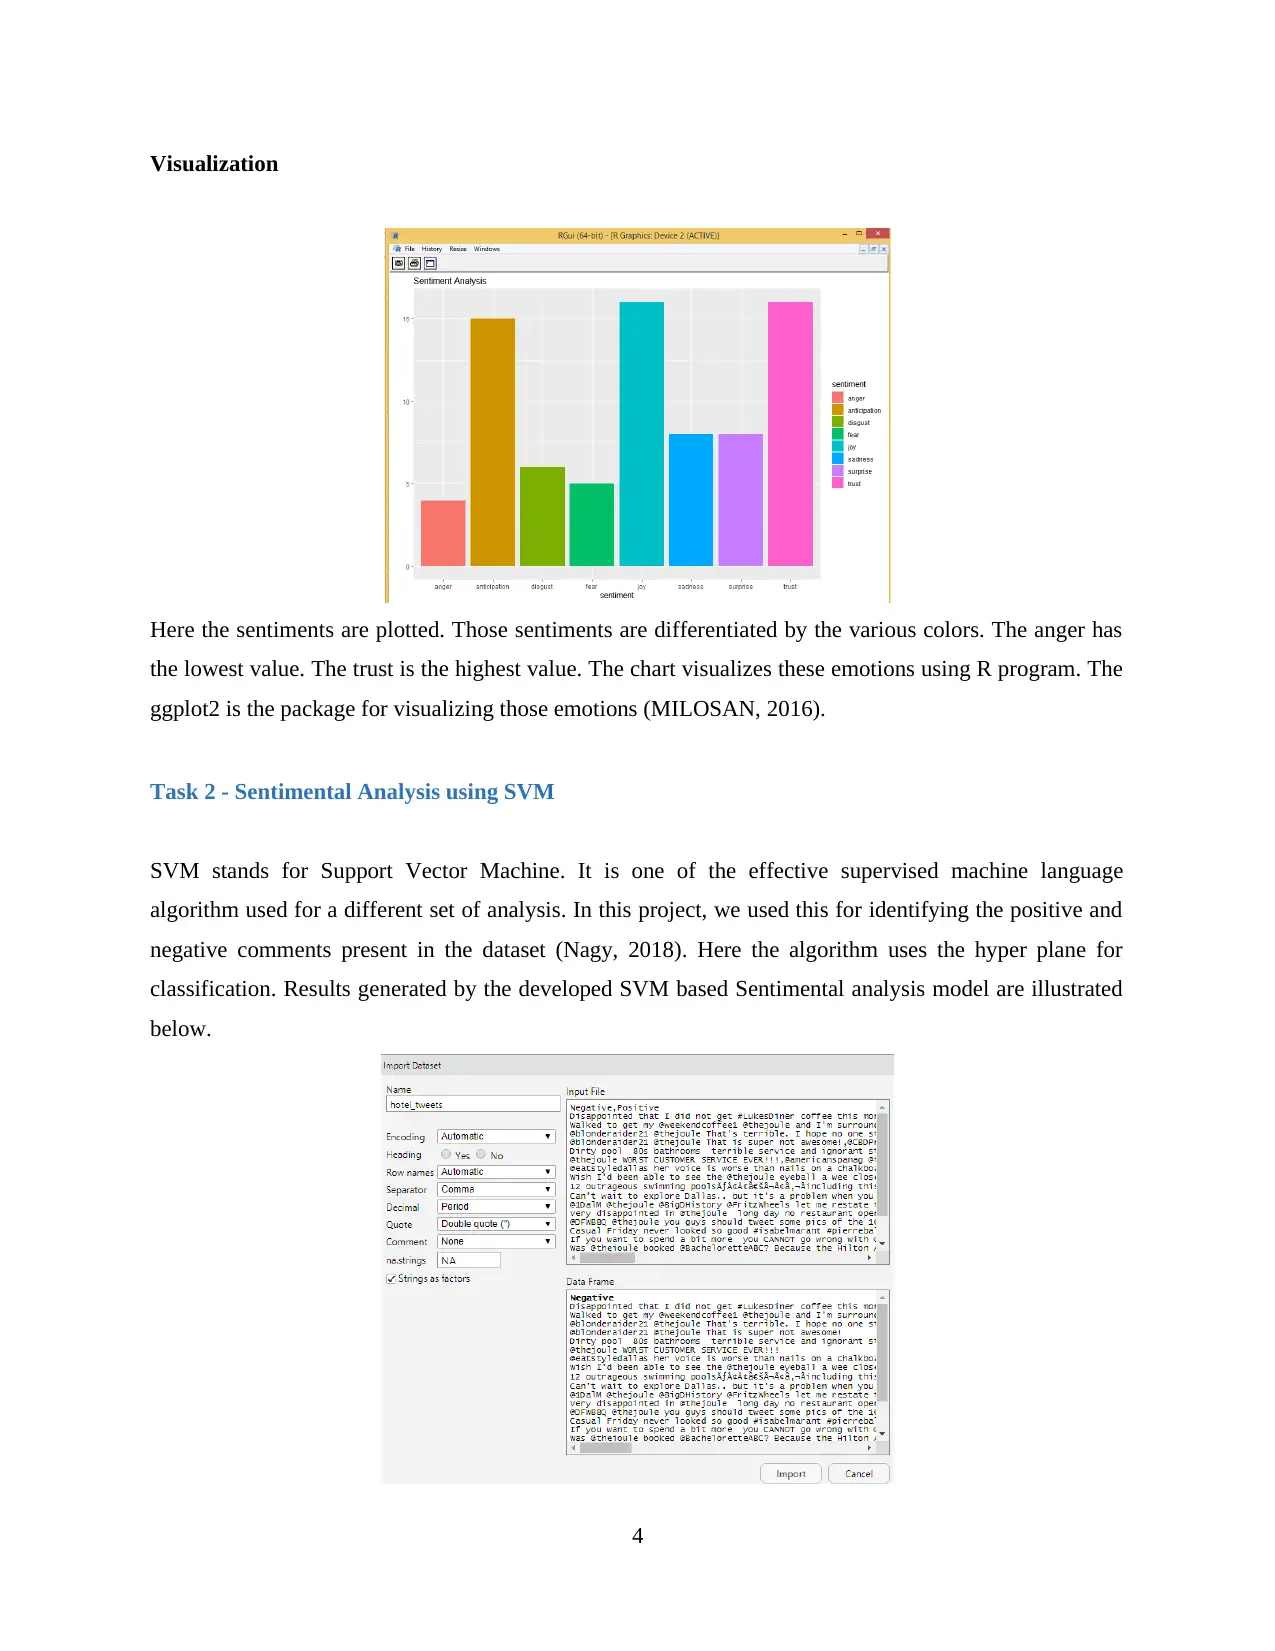
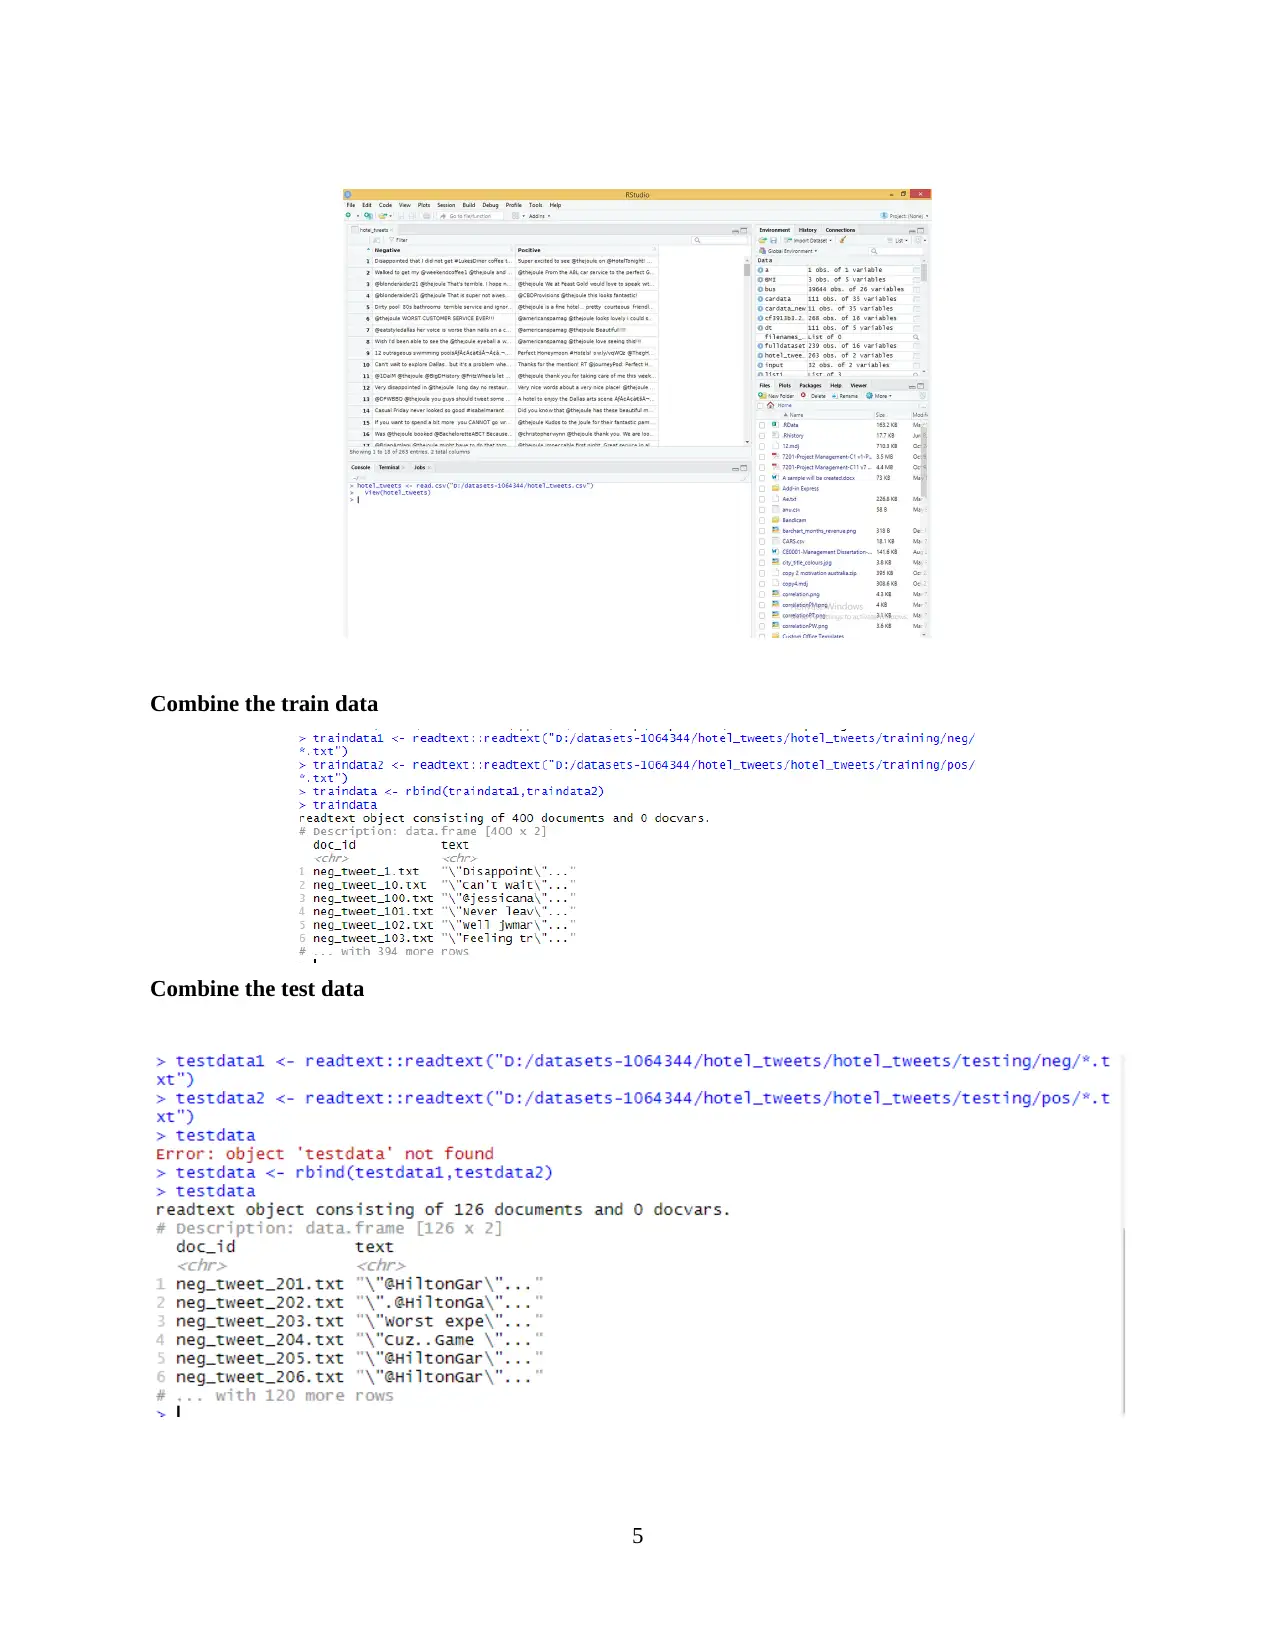
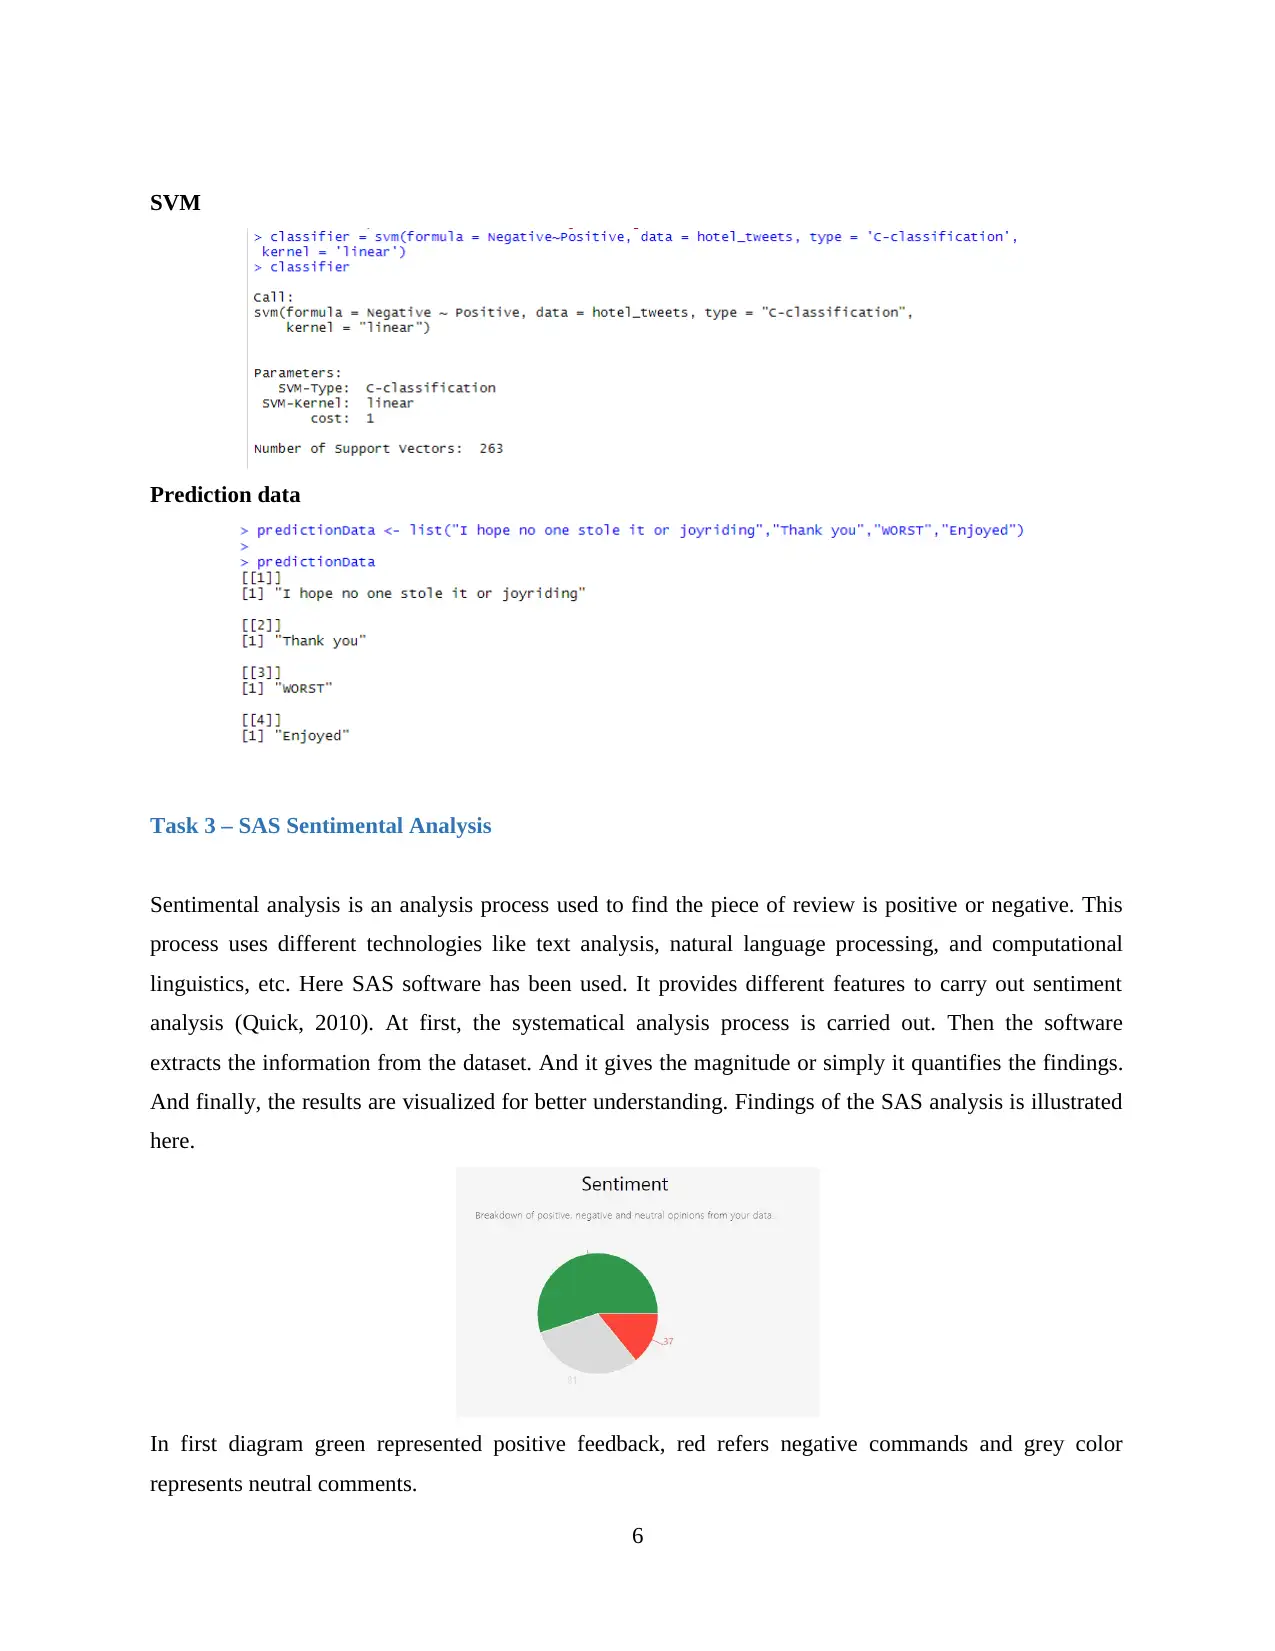
This report presents an analysis of customer analytics and social media, focusing on Case Study B. It details the development of a sentiment analysis engine using R, including importing the dataset, finding sentiments with the get_nrc_sentiment function, and visualizing emotions using ggplot2. The report further explores sentiment analysis using Support Vector Machines (SVM), outlining the process of combining training and testing data and generating SVM prediction data. Additionally, the report includes a section on SAS sentiment analysis, explaining the process of extracting and quantifying information from the dataset and visualizing the results. The conclusion summarizes the findings, emphasizing the successful completion of the analysis and the use of text mining with SAS text miner. References to relevant literature are also provided.
tabler-icon-diamond-filled.svg

Contribute Materials

Your contribution can guide someone’s learning journey. Share your documents today.
Document Page
Customer Analytics and Social Media
tabler-icon-diamond-filled.svg

Secure Best Marks with AI Grader

Need help grading? Try our AI Grader for instant feedback on your assignments.
Document Page
Table of Contents
1. Introduction.........................................................................................................................................2
2. Case study B........................................................................................................................................2
Task 1 – Development of Sentimental Analysis engine...........................................................................2
Task 2 - Sentimental Analysis using SVM..............................................................................................4
Task 3 – SAS Sentimental Analysis........................................................................................................6
3. Conclusion...........................................................................................................................................7
4. References...........................................................................................................................................8
1
Document Page
1. Introduction
This report discusses the customer analytics and social media conducted in the client organization
(Chockalingam, 2018). This report will discuss the text mining. Here the dataset will be analyzed for
finding the keywords.
2. Case study B
Task 1 – Development of Sentimental Analysis engine
Import dataset
The above screenshots show the import the dataset. The dataset is hotel_tweets.csv. It contains the name
of the dataset, row name, separator, decimal, quote, and comment. Then click the import button.
2
Document Page
The dataset has negative and positive tweets in the hotel.
Find the sentiments
The above code is used to find sentiments in the hotel_tweets.csv dataset. It contains ten sentiments such
as anticipation, anger, fear, disgust, sadness, joy, surprise, negative, trust and positive (Dual Sentiment
Analysis, 2017).
Here using the get_nrc_sentiment function for sentiment analysis. The ggplot2 library used to plot the
graph.
3
tabler-icon-diamond-filled.svg

Secure Best Marks with AI Grader

Need help grading? Try our AI Grader for instant feedback on your assignments.
Document Page
Visualization
Here the sentiments are plotted. Those sentiments are differentiated by the various colors. The anger has
the lowest value. The trust is the highest value. The chart visualizes these emotions using R program. The
ggplot2 is the package for visualizing those emotions (MILOSAN, 2016).
Task 2 - Sentimental Analysis using SVM
SVM stands for Support Vector Machine. It is one of the effective supervised machine language
algorithm used for a different set of analysis. In this project, we used this for identifying the positive and
negative comments present in the dataset (Nagy, 2018). Here the algorithm uses the hyper plane for
classification. Results generated by the developed SVM based Sentimental analysis model are illustrated
below.
4
Document Page
Combine the train data
Combine the test data
5
Document Page
SVM
Prediction data
Task 3 – SAS Sentimental Analysis
Sentimental analysis is an analysis process used to find the piece of review is positive or negative. This
process uses different technologies like text analysis, natural language processing, and computational
linguistics, etc. Here SAS software has been used. It provides different features to carry out sentiment
analysis (Quick, 2010). At first, the systematical analysis process is carried out. Then the software
extracts the information from the dataset. And it gives the magnitude or simply it quantifies the findings.
And finally, the results are visualized for better understanding. Findings of the SAS analysis is illustrated
here.
In first diagram green represented positive feedback, red refers negative commands and grey color
represents neutral comments.
6
tabler-icon-diamond-filled.svg

Paraphrase This Document

Need a fresh take? Get an instant paraphrase of this document with our AI Paraphraser
Document Page
7
Document Page
3. Conclusion
Customer analytics and social media analysis in the client organization has completed successfully. From
the conducted analysis we findings of the conducted analysis has explained in this report. The results
visualizations are given for better understanding. And then the text mining process has been done using
SAS text miner. And the results are explained in this report.
8
Document Page
4. References
Chockalingam, N. (2018). Simple and Effective Feature Based Sentiment Analysis on Product
Reviews using Domain Specific Sentiment Scores. Polibits, 57, pp.39-43.
Dual Sentiment Analysis. (2017). International Journal of Modern Trends in Engineering &
Research, 4(3), pp.136-142.
MILOSAN, I. (2016). STATISTICAL PROCESSING OF EXPERIMENTAL DATA USING
ANALYSIS OF VARIANCE. SCIENTIFIC RESEARCH AND EDUCATION IN THE AIR
FORCE, 18(1), pp.489-496.
Nagy, G. (2018). Sector Based Linear Regression, a New Robust Method for the Multiple Linear
Regression. Acta Cybernetica, 23(4), pp.1017-1038.
Quick, J. (2010). Statistical Analysis with R. Birmingham: Packt Pub.
9
chevron_up_icon
1 out of 10
circle_padding
hide_on_mobile
zoom_out_icon
logo.png

Your All-in-One AI-Powered Toolkit for Academic Success.

Available 24*7 on WhatsApp / Email

[object Object]