Statistical Report: Analysis of Gym Customer Survey for Business XYZ

Verified

Added on  2023/06/07

|12
|2071
|338
Report
AI Summary
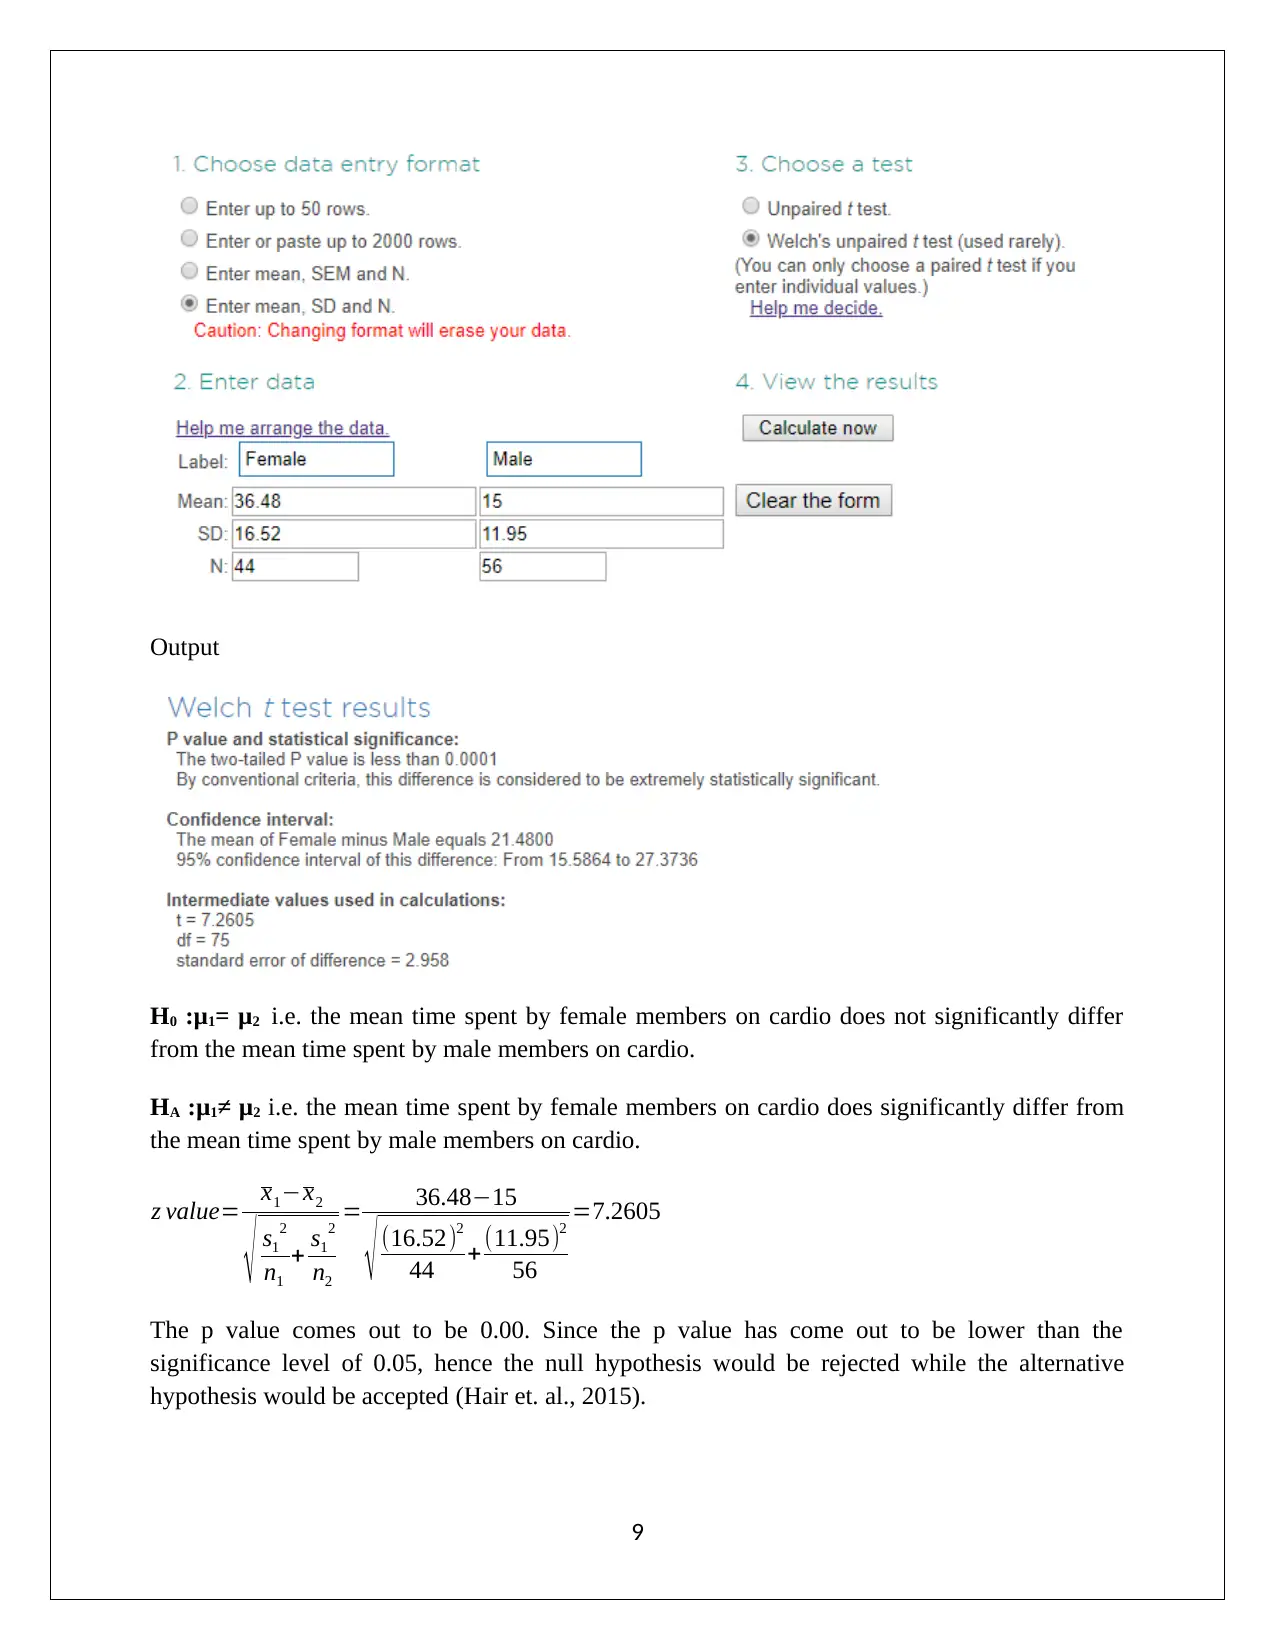
This report presents a comprehensive statistical analysis of a gym customer survey conducted to understand preferences for a unisex gym, exercise habits, and gender-based differences. The analysis includes pivot tables, scatter plots, confidence intervals, and hypothesis testing to draw conclusions about customer preferences and behaviors. The report examines the relationship between time spent on cardio and weight machines, preferences for unisex gyms based on gender, and the proportion of customers favoring a unisex gym. It utilizes statistical methods like z-tests to assess claims about customer preferences, comparing proportions and means. The report concludes with recommendations for the gym business based on the statistical findings, considering the implications of the data on potential expansion and service offerings. The report also includes a discussion of the methodologies used, including the types of data summaries and hypothesis tests that were most appropriate for the data.
tabler-icon-diamond-filled.svg

Contribute Materials

Your contribution can guide someone’s learning journey. Share your documents today.
Document Page
S A S CST TI TI
Student ameN
[Pick the date]
tabler-icon-diamond-filled.svg

Secure Best Marks with AI Grader

Need help grading? Try our AI Grader for instant feedback on your assignments.
Document Page
Section 1
(a) Pivot table to represent the female customers that want unisex gym is highlighted below.
(b) Relationship between the minutes on cardio and minutes on weight machine is
represented through scatter plot.
The scatter plot represent negative slope which indicates that higher spending on cardio by
male/female would decrease the time spent on the weight machine. This is because the total time
of exercise is usually fixed and it is divided between weight training and cardio. Therefore, if a
higher time is spent on cardio, then lower time is spent on weight machine and vice versa (Flick,
2015).
1
Document Page
(c) Pivot table to represent the customers that want or do not want unisex gym is highlighted
below.
It can be said based on the above that 64.86% of female prefer unisex gym while 35.14% male
prefer unisex gym. Further, 64.86% - 35.14 % = 29.72% more female would prefer to go unisex
gym.
(d) Pivot table to represent the relationship between the time spent on cardio machine with
the gender of customer.
2
Document Page
Females are spending a mean of 36.48 minutes ion cardio while males are spending only 15
minutes on cardio. Hence, females would spend 36.48 minutes – 15 minutes = 21.48 minutes
more on an average on cardio machine.
Section 2
(a) 90% confidence interval for the sample proportion of female who will say yes to Unisex
gym
For female customers
Total female customers in sample n=44
Number of female who would prefer unisex gym = 24
Sample proportion of female who would prefer unisex gym ^p= 24
44 =0.545
Standard error of sample proportion ¿ ^p ¿ ¿ ¿
The z value of 90% confidence interval = 1.645
Lower limit 90% confidence
¿ Sample proportion ( z valued error ) =0.545 ( 1.6450.075 ) =0.4220
Upper limit 90% confidence
¿ Sample proportion+ ( z valued error )=0.545+ ( 1.6450.075 )=0.6689
Thus, 90% confidence interval would be [0.4220 0.6689]
(b) 90% confidence interval for the sample proportion of male who will say yes to Unisex
gym
3
tabler-icon-diamond-filled.svg

Secure Best Marks with AI Grader

Need help grading? Try our AI Grader for instant feedback on your assignments.
Document Page
For male customers
Total male customers in sample n=56
Number of male who would prefer unisex gym = 13
Sample proportion of male who would prefer unisex gym ^p= 13
56 =0.2321
Standard error of sample proportion ¿ ^p ¿ ¿ ¿
The z value of 90% confidence interval = 1.645
Lower limit 90% confidence
¿ Sample proportion ( z valued error )=0.2321 ( 1.6450.0564 )=0.1393
Upper limit 90% confidence
¿ Sample proportion+ ( z valued error )=0.2321+ ( 1.6450.0564 )=0.3249
Thus, 90% confidence interval would be [0.1393 0.3249]
(c) Test statistics needs to be determined if the case when number of females going to the
unisex gym is higher than 50%.
H0 : p <¿ 0.5
H1 : p>0.5
Total female customers in sample n=44
Number of female who would prefer unisex gym = 24
4
Document Page
Sample proportion of male who would prefer unisex gym ^p= 24
44 =0.545
Number of females going to the unisex gym p=0.5
z stat = ^p p
p (1 p)
n
= 0.5450.5
0.5 (10.5)
44
=0.5969
z stat =0.5969
The p value for the z stat is 0.2752
Assume level of significance = 5%
It can be said that p value is higher than level of significance and hence, null hypothesis would
not be rejected. Therefore, it can be concluded that proportion of female prefer unisex gym is not
higher than 50% (Hair et. al., 2015).
(d) Test statistics needs to be determined if the case when number of males going to the
unisex gym is higher than 50%.
H0 : p <¿ 0.5
H1 : p>0.5
Total male customers in sample n=56
Number of male who would prefer unisex gym ¿ 13
Sample proportion of male who would prefer unisex gym ^p= 13
56 =0.2321
Number of males going to the unisex gym p=0.5
z stat = ^p p
p (1 p)
n
= 0.23210.5
0.5 (10.5)
56
=4.009
z stat =4.009
5
Document Page
The p value for the z stat is 1
Assume level of significance = 5%
It can be said that p value is higher than level of significance and hence, null hypothesis would
not be rejected. Therefore, it can be concluded that proportion of male prefer unisex gym is not
higher than 50% (Hillier, 2016).
Section 3
(a) With regards to data summary, it is essential to note that the techniques used would suitably
vary. For instance, if the relationship between two variables needs to be summarised when atleast
one of them is categorical, then the same would be achieved through cross tabulation table which
was apparent when the preferences of male and female were summarised. However, when both
the given variables are numerical in nature, then the summary of the relationship can be better
represented through the use of scatter plot which is quite informative. This has been exhibited in
this report when summary of the relationship between weight machine time and cardio time had
to be presented. As a result, the suitable mechanism for summary tends to vary in accordance
with the underlying data type (Eriksson and Kovalainen, 2015).
(b) The given article tends to highlight the significant differences in preferences when it comes
to males and female gym members. Males tend to have a specific agenda and prefer to choose
athletic activities which do not require much dance or coordination. The social aspect at gyms is
not very significant as it is a competitive activity for them. In contrast, females tend to focus less
on weight training and more on aerobics and yoga which require coordination. Also, the
associated social aspects for them are very critical. Further, the article also highlights how the
preferences of the two genders tend to be driven by two factors namely their physical attributes
and social norms (Sorgen, nd).
The above difference is captured in the cross tabulation summary of reason to go to gym.
6
tabler-icon-diamond-filled.svg

Paraphrase This Document

Need a fresh take? Get an instant paraphrase of this document with our AI Paraphraser
Document Page
Section 4
(a) Hypothesis testing
7
Document Page
H0 :p1= p2 i.e. the proportion of female members who prefer unisex gym and the proportion of
male members who prefer unisex gym does not exhibit any significant difference.
HA :p1≠ p2 i.e. the proportion of female members who prefer unisex gym and the proportion of
male members who prefer unisex gym does exhibit significant difference.
z value= ^p1 ^p2
^p1 (1 ^p1)
n1
+ ^p2 (1 ^p2)
n2
z value= 0.5450.2321
0.545(10.545)
44 + 0.2321(10.2321)
56
z value=3.332
The p value comes out to be 0.00. Since the p value has come out to be lower than the
significance level of 0.05, hence the null hypothesis would be rejected while the alternative
hypothesis would be accepted (Flick, 2015).
(b) Hypothesis testing
Input
8
Document Page
Output
H0 1= μ2 i.e. the mean time spent by female members on cardio does not significantly differ
from the mean time spent by male members on cardio.
HA 1≠ μ2 i.e. the mean time spent by female members on cardio does significantly differ from
the mean time spent by male members on cardio.
z value= x1x2
s1
2
n1
+ s1
2
n2
= 36.4815
(16.52)2
44 + (11.95)2
56
=7.2605
The p value comes out to be 0.00. Since the p value has come out to be lower than the
significance level of 0.05, hence the null hypothesis would be rejected while the alternative
hypothesis would be accepted (Hair et. al., 2015).
9
tabler-icon-diamond-filled.svg

Secure Best Marks with AI Grader

Need help grading? Try our AI Grader for instant feedback on your assignments.
Document Page
Section 5
Based on the hypothesis testing conducted in the previous section, it may be concluded that there
is a higher preference of unisex gym from females as compared to males. This is not surprising
considering that females tend to be usually more comfortable in unisex gyms. Additionally, it
can also be also be concluded that the mean times spent on cardio by both sexes tend to differ.
This is also not surprising since the males typically tend to devote more time towards weight
machines unlike females who are more inclined to cardio. This arises owing to the different
expectations from a male and female with regards to key physical attributes.
Section 6
The given report has a logical structure which is apparent from the flow that is visible across the
various sections. In section 1, the focus is on highlighting the summary of the provided sample
data while in section 2, the focus is on deriving estimates about the population with regards to
the preferences of the two sexes. In section 3, a particular article regarding the given research has
been chosen and suitable summary is present of the attached data. Further, in section 4,
hypothesis testing has been used to draw conclusion about key research questions which is
presented in section 5. The only aspect which seems missing is the lack of an introduction which
would have provided a background context to the reader and would have therefore enhanced the
overall utility in this case.
Section 7
The hypothesis tests are not very easy to understand owing to the underlying statistical nature of
these tests where a host of computations may be involved. However, with practice, these tests
tend to become quite understandable especially if one can understand the basic steps of
hypothesis testing. These include defining the hypothesis, level of significance, conducting the
test, analysing the result and reaching the conclusion (Eriksson and Kovalainen, 2015).
The use of computers is highly recommended for conducting hypothesis tests as the datasets are
usually quite large and the statistical computations of these datasets can be cumbersome for the
user besides being prone to human errors. In this light, it is advisable that the hypothesis test
must be performed with the help of computer and similar technology aids. However, it is
noteworthy that even while using computer, it is essential that the user must have awareness
about the various tests so that suitable test can be chosen which requires thorough understanding
of the underlying assumptions with regards to data distribution. Thus, it may be concluded that
computers should be used only as a calculation aid and not a substitute for understanding of this
vital statistical tool (Hillier, 2016).
10
Document Page
References
Eriksson, P. and Kovalainen, A. (2015) Quantitative methods in business research 3rd ed.
London: Sage Publications.
Flick, U. (2015) Introducing research methodology: A beginner's guide to doing a research
project. 4th ed. New York: Sage Publications.
Hair, J. F., Wolfinbarger, M., Money, A. H., Samouel, P., and Page, M. J. (2015) Essentials of
business research methods. 2nd ed. New York: Routledge.
Hillier, F. (2016) Introduction to Operations Research 6th ed. New York: McGraw Hill
Publications.
Sorgen, C. (n.d.) When it comes to working out, men and women are from different planets,
[Online] Available at https://www.webmd.com/fitness-exercise/features/his-hers-fitness#1
[Assessed September 16, 2018]
11
chevron_up_icon
1 out of 12
circle_padding
hide_on_mobile
zoom_out_icon
logo.png

Your All-in-One AI-Powered Toolkit for Academic Success.

Available 24*7 on WhatsApp / Email

[object Object]