Hampshire Company Case Study: A Detailed CVP Analysis - ACC 550

Verified

Added on  2023/04/19

|10
|1760
|416
Case Study
AI Summary
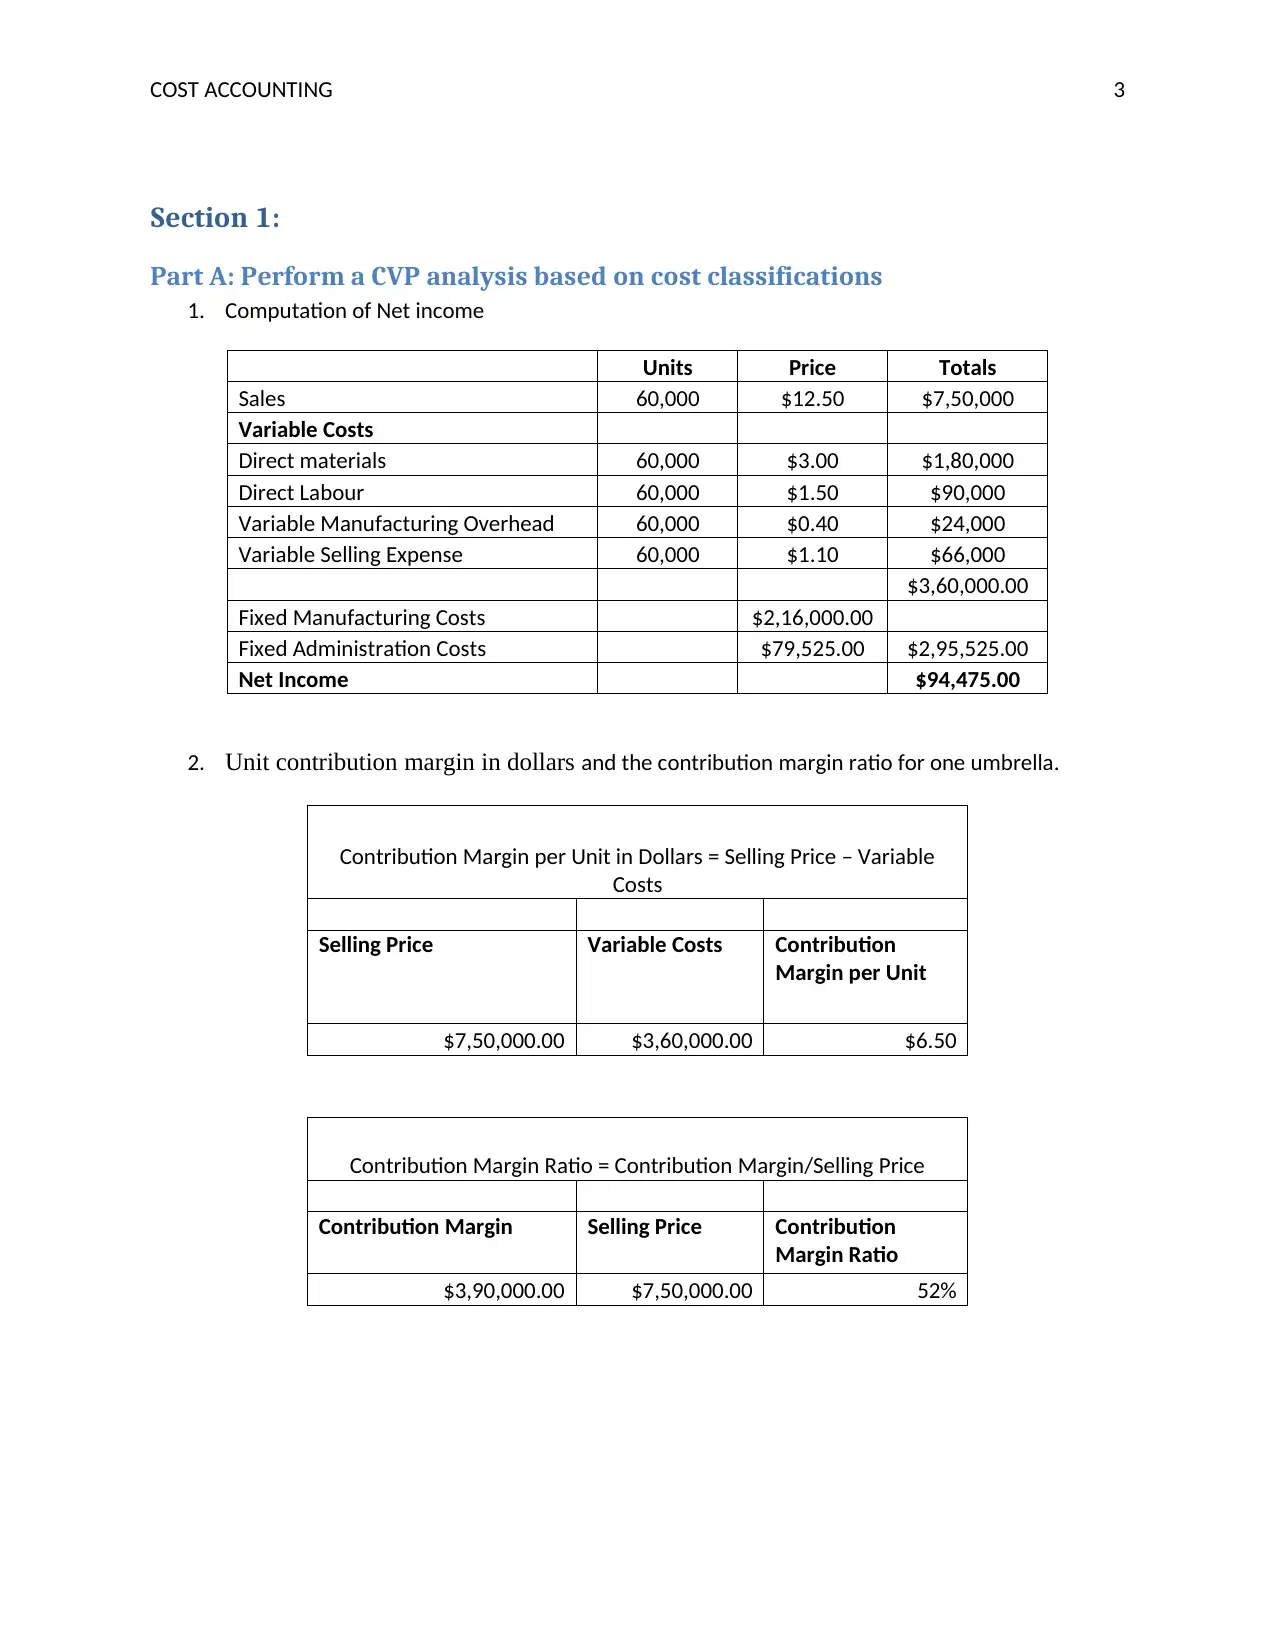
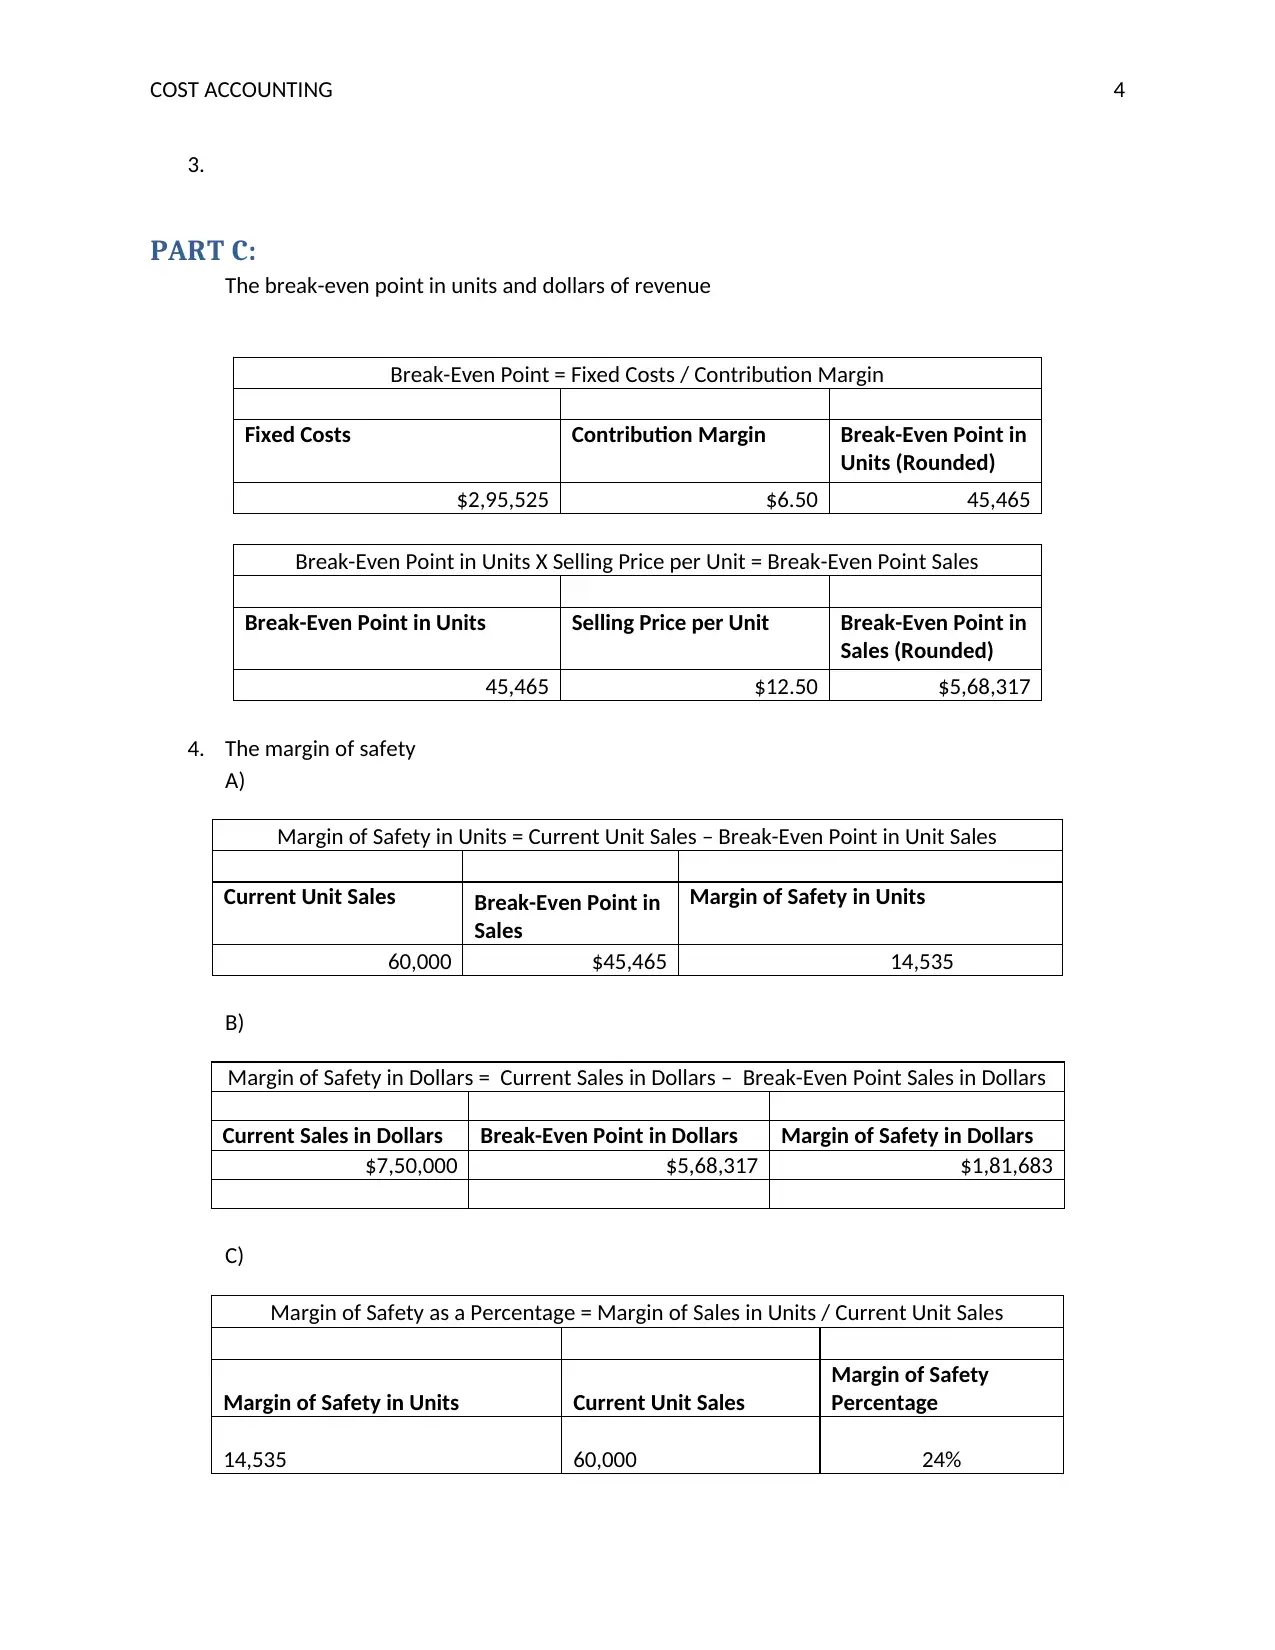
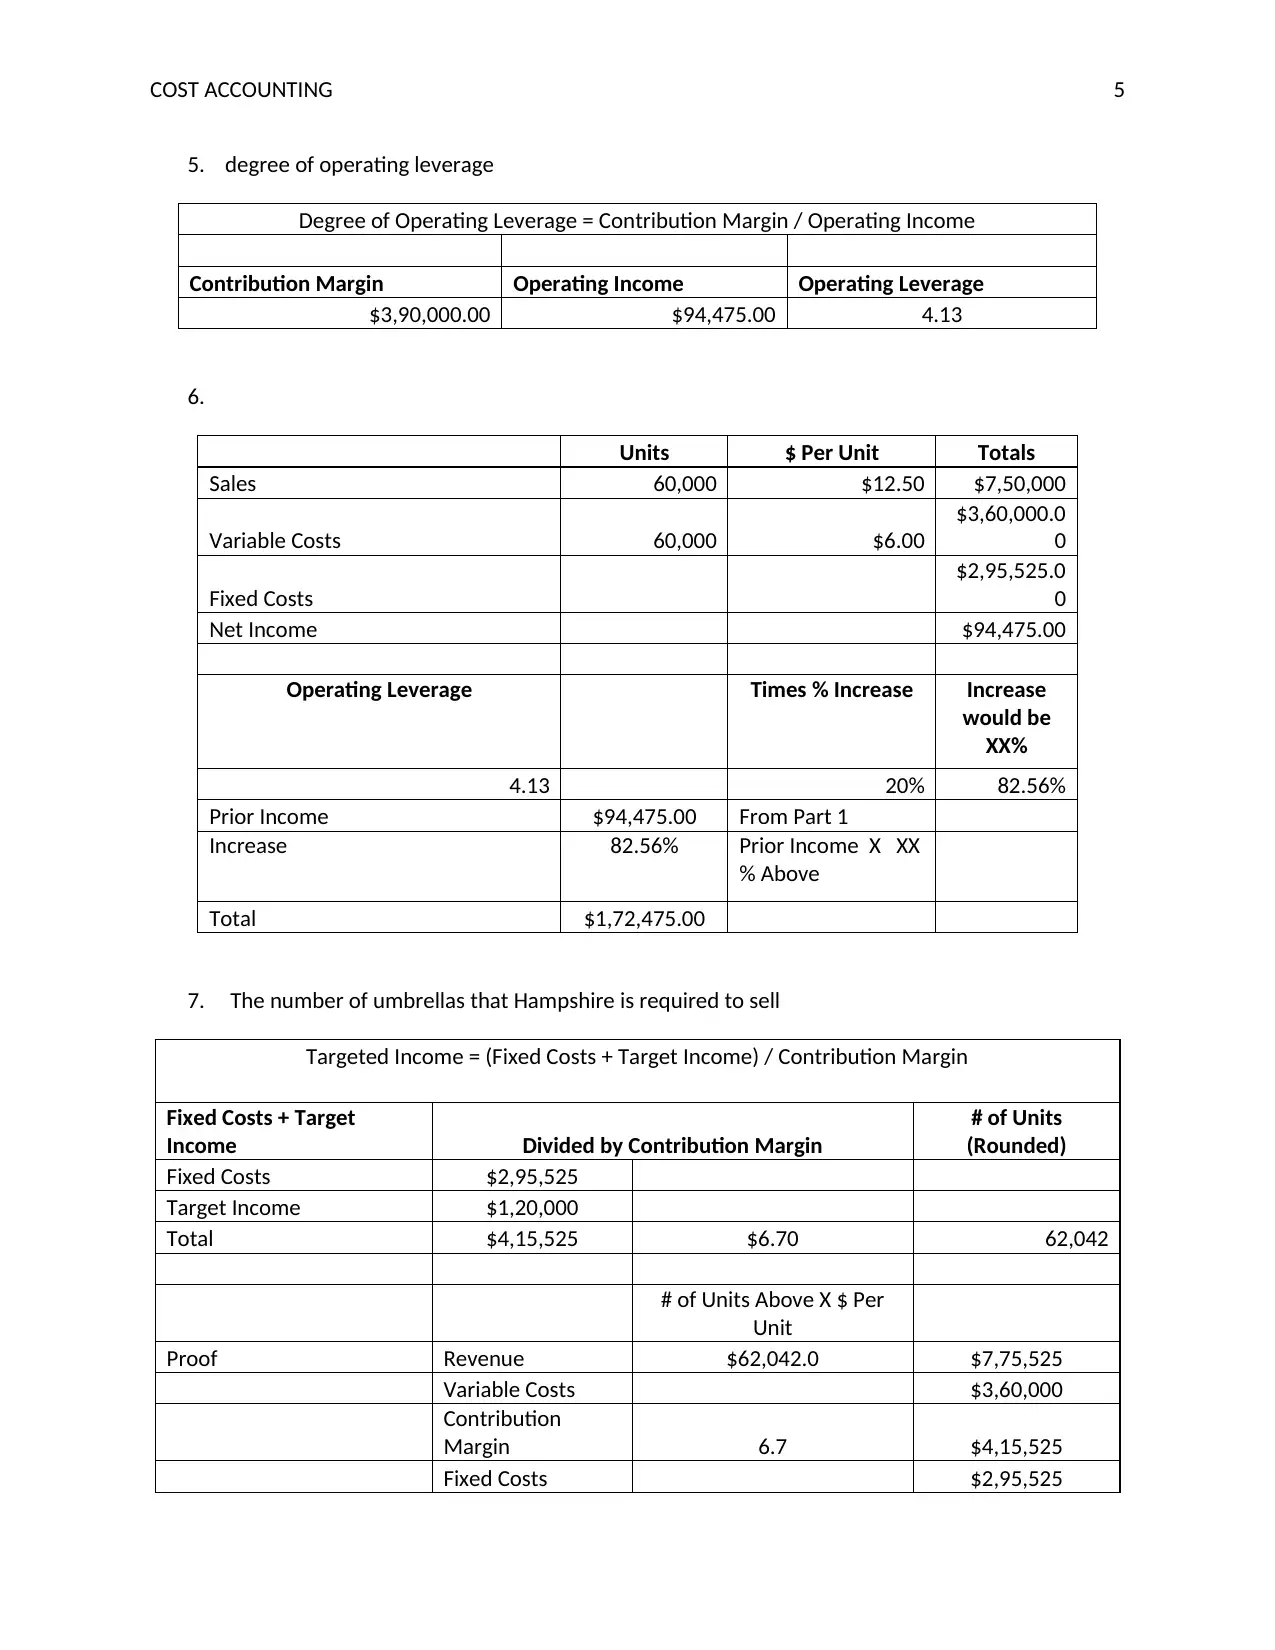
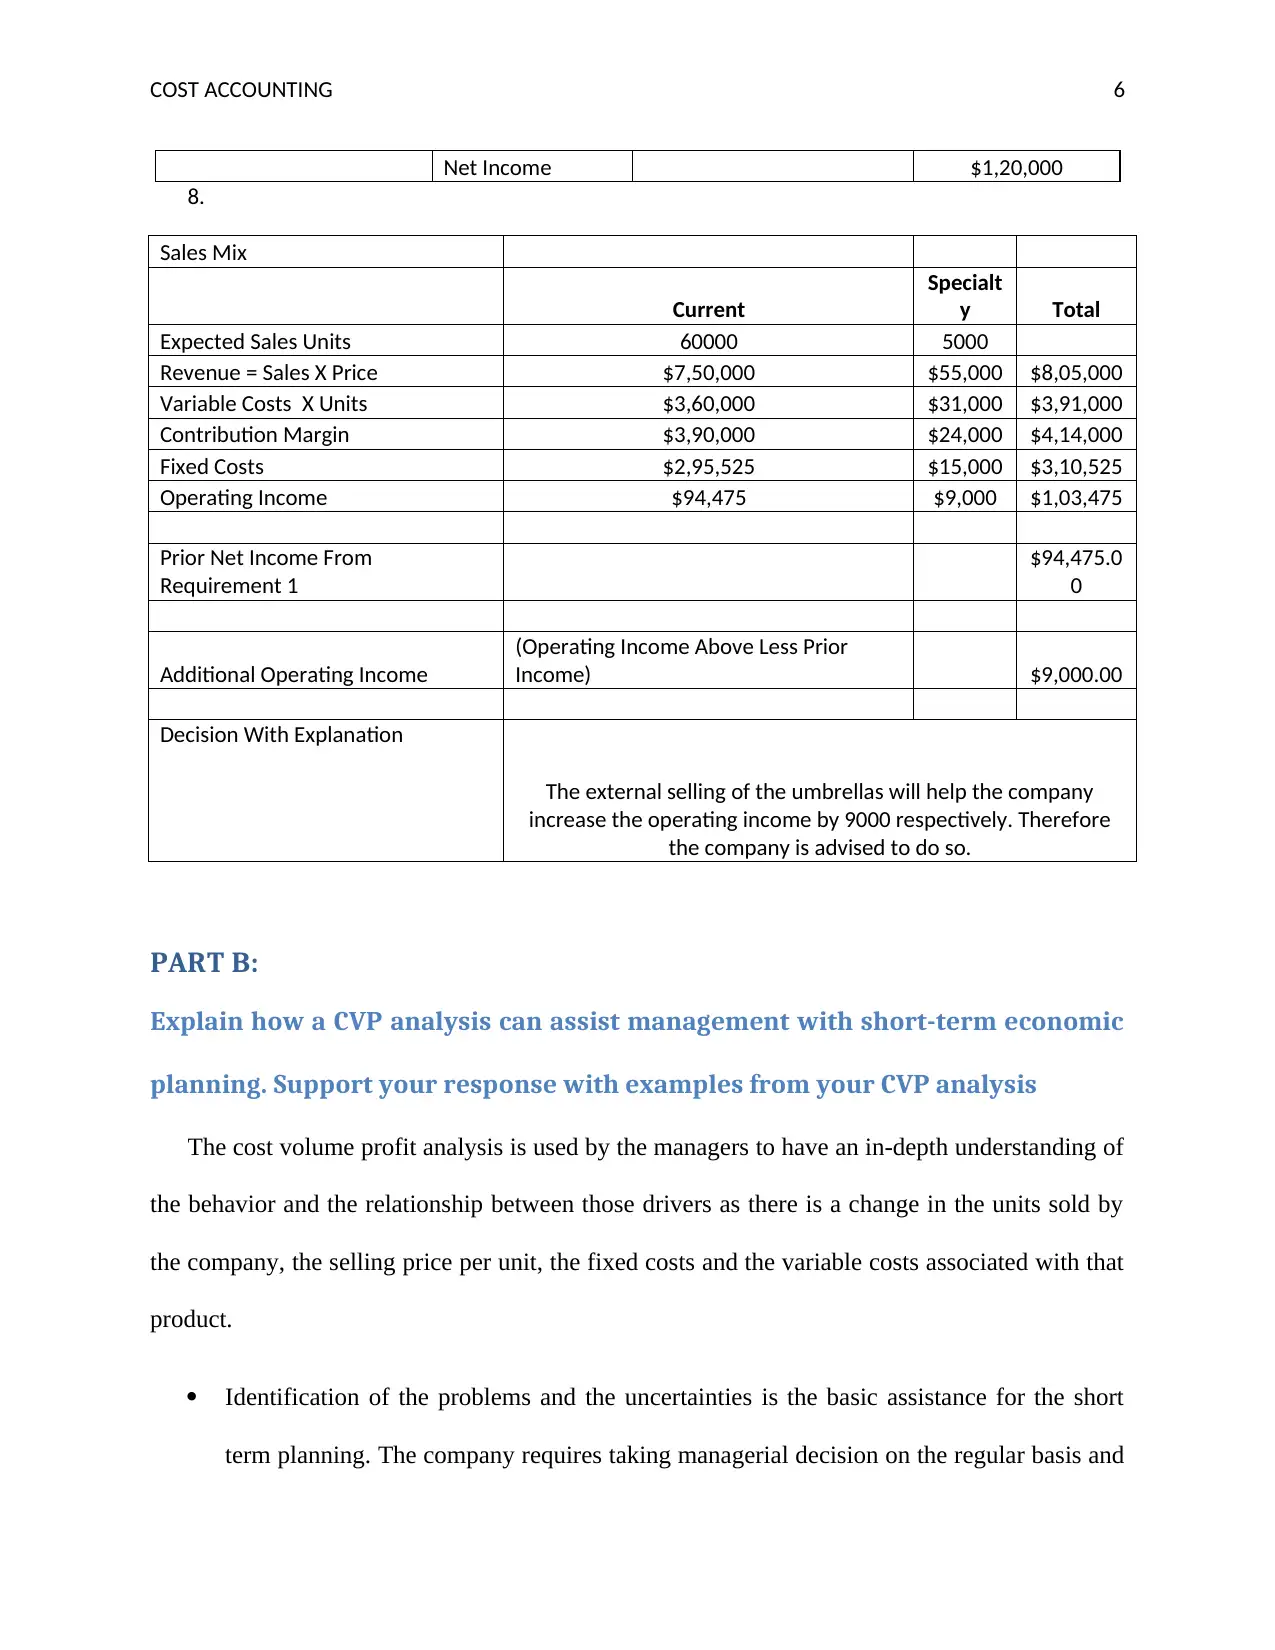
This assignment presents a comprehensive cost-volume-profit (CVP) analysis of the Hampshire Company, focusing on key financial metrics and decision-making implications. The analysis includes the computation of net income, unit contribution margin, contribution margin ratio, break-even points (in units and dollars), margin of safety (in units, dollars, and percentage), and the degree of operating leverage. It also explores the impact of a 20% increase in sales on before-tax income and evaluates the profitability of selling additional units to a touring company. The report further discusses how CVP analysis assists management with short-term economic planning by identifying problems, providing relevant information, and facilitating profit planning. Finally, it determines the company's break-even status and discusses CVP analysis implications on planning, emphasizing its role in cost control and sensitivity analysis.
Document Page
Running Head: COST ACCOUNTING 1
CVP ANALYSIS
tabler-icon-diamond-filled.svg

Paraphrase This Document

Need a fresh take? Get an instant paraphrase of this document with our AI Paraphraser
Document Page
COST ACCOUNTING 2
Table of Contents
Section 1:.....................................................................................................................................................3
Part A: Perform a CVP analysis based on cost classifications...................................................................3
PART C:........................................................................................................................................................4
PART B:........................................................................................................................................................7
Explain how a CVP analysis can assist management with short-term economic planning. Support your
response with examples from your CVP analysis.....................................................................................7
PART D:........................................................................................................................................................9
Determine whether the company is breaking even. What are the CVP analysis implications on
planning?.................................................................................................................................................9
CVP Analysis Implications......................................................................................................................10
References.................................................................................................................................................11
Document Page
COST ACCOUNTING 3
Section 1:
Part A: Perform a CVP analysis based on cost classifications
1. Computation of Net income
Units Price Totals
Sales 60,000 $12.50 $7,50,000
Variable Costs
Direct materials 60,000 $3.00 $1,80,000
Direct Labour 60,000 $1.50 $90,000
Variable Manufacturing Overhead 60,000 $0.40 $24,000
Variable Selling Expense 60,000 $1.10 $66,000
$3,60,000.00
Fixed Manufacturing Costs $2,16,000.00
Fixed Administration Costs $79,525.00 $2,95,525.00
Net Income $94,475.00
2. Unit contribution margin in dollars and the contribution margin ratio for one umbrella.
Contribution Margin per Unit in Dollars = Selling Price – Variable
Costs
Selling Price Variable Costs Contribution
Margin per Unit
$7,50,000.00 $3,60,000.00 $6.50
Contribution Margin Ratio = Contribution Margin/Selling Price
Contribution Margin Selling Price Contribution
Margin Ratio
$3,90,000.00 $7,50,000.00 52%
Document Page
COST ACCOUNTING 4
3.
PART C:
The break-even point in units and dollars of revenue
Break-Even Point = Fixed Costs / Contribution Margin
Fixed Costs Contribution Margin Break-Even Point in
Units (Rounded)
$2,95,525 $6.50 45,465
Break-Even Point in Units X Selling Price per Unit = Break-Even Point Sales
Break-Even Point in Units Selling Price per Unit Break-Even Point in
Sales (Rounded)
45,465 $12.50 $5,68,317
4. The margin of safety
A)
Margin of Safety in Units = Current Unit Sales – Break-Even Point in Unit Sales
Current Unit Sales Break-Even Point in
Sales
Margin of Safety in Units
60,000 $45,465 14,535
B)
Margin of Safety in Dollars = Current Sales in Dollars – Break-Even Point Sales in Dollars
Current Sales in Dollars Break-Even Point in Dollars Margin of Safety in Dollars
$7,50,000 $5,68,317 $1,81,683
C)
Margin of Safety as a Percentage = Margin of Sales in Units / Current Unit Sales
Margin of Safety in Units Current Unit Sales
Margin of Safety
Percentage
14,535 60,000 24%
tabler-icon-diamond-filled.svg

Paraphrase This Document

Need a fresh take? Get an instant paraphrase of this document with our AI Paraphraser
Document Page
COST ACCOUNTING 5
5. degree of operating leverage
Degree of Operating Leverage = Contribution Margin / Operating Income
Contribution Margin Operating Income Operating Leverage
$3,90,000.00 $94,475.00 4.13
6.
Units $ Per Unit Totals
Sales 60,000 $12.50 $7,50,000
Variable Costs 60,000 $6.00
$3,60,000.0
0
Fixed Costs
$2,95,525.0
0
Net Income $94,475.00
Operating Leverage Times % Increase Increase
would be
XX%
4.13 20% 82.56%
Prior Income $94,475.00 From Part 1
Increase 82.56% Prior Income X XX
% Above
Total $1,72,475.00
7. The number of umbrellas that Hampshire is required to sell
Targeted Income = (Fixed Costs + Target Income) / Contribution Margin
Fixed Costs + Target
Income Divided by Contribution Margin
# of Units
(Rounded)
Fixed Costs $2,95,525
Target Income $1,20,000
Total $4,15,525 $6.70 62,042
# of Units Above X $ Per
Unit
Proof Revenue $62,042.0 $7,75,525
Variable Costs $3,60,000
Contribution
Margin 6.7 $4,15,525
Fixed Costs $2,95,525
Document Page
COST ACCOUNTING 6
Net Income $1,20,000
8.
Sales Mix
Current
Specialt
y Total
Expected Sales Units 60000 5000
Revenue = Sales X Price $7,50,000 $55,000 $8,05,000
Variable Costs X Units $3,60,000 $31,000 $3,91,000
Contribution Margin $3,90,000 $24,000 $4,14,000
Fixed Costs $2,95,525 $15,000 $3,10,525
Operating Income $94,475 $9,000 $1,03,475
Prior Net Income From
Requirement 1
$94,475.0
0
Additional Operating Income
(Operating Income Above Less Prior
Income) $9,000.00
Decision With Explanation
The external selling of the umbrellas will help the company
increase the operating income by 9000 respectively. Therefore
the company is advised to do so.
PART B:
Explain how a CVP analysis can assist management with short-term economic
planning. Support your response with examples from your CVP analysis
The cost volume profit analysis is used by the managers to have an in-depth understanding of
the behavior and the relationship between those drivers as there is a change in the units sold by
the company, the selling price per unit, the fixed costs and the variable costs associated with that
product.
Identification of the problems and the uncertainties is the basic assistance for the short
term planning. The company requires taking managerial decision on the regular basis and
Document Page
COST ACCOUNTING 7
for the managerial decision a proper course of action is required by the company. There
are two major factors that will play the major role in determining the decision to sell to
the touring company. These two major categories are the price and the number of the
umbrellas the Hampshire Company can sell at that particular price (Said, 2016).
Obtaining of the relevant information is the criteria that can assist in the short term
planning. Under this scenario the company might take help from the information to
understand about the uncertainties. For example the Hampshire Company is likely keen
to know the type of the individuals that are more interested in buying the umbrellas.
Another advantage of CVP analysis is the detailed blueprint provided by the CVP of each
activity of the company. This includes everything from the costs needed to produce a
product to the amount of the product produced. This assists the managers to determine,
very particularly, what the future holds for the company if the variable costs are altered
time to time.
CVP Analysis also helps in planning of the short term profit with the help of the detailed
plan. Every company has a plan on how to reach the specific target, and without the
planning of the profits, these profits are left for chance and that’s definitely not called
managing the business. Therefore CVP analysis also caters the company in making the
strategic map towards reaching the specific targets and customers.
The CVP analysis allowed the Hampshire Company to take two different approaches at
the same time. The approach one where the company is selling 60000 umbrellas and the
second approach is where the company is selling the additional 5000 units. By selling the
additional 5000 units the company is able to earn 9000 profit. The CVP analysis therefore
also gives the two perspectives to the company (Anderson & Leese, 2016).
tabler-icon-diamond-filled.svg

Paraphrase This Document

Need a fresh take? Get an instant paraphrase of this document with our AI Paraphraser
Document Page
COST ACCOUNTING 8
Hence these are some of the reasons that can help the management of Hampshire in utilizing
the CVP analysis for understanding the short term goals and decisions.
PART D:
Determine whether the company is breaking even. What are the CVP analysis
implications on planning?
Cost volume profit analysis generally employs the same behavior as in the case of the
breakeven analysis. The assumptions that are underlying in the CVP analysis is same for the
breakeven analysis as well.
The costs can be bifurcated as the fixed or the variable costs
The costs are affected only if there is a change in the activity
The units that have been manufactured are sold in full and no finished goods are lying
down
When a company sells more than one type of the product will than the ratio of the
product to the sales will remain constant for all the products individually as well.
The cots behavior and the revenue behavior is liner in nature throughout the process of
the activity.
The breakeven point on 60000 umbrellas sold by the Hampshire Company is 45465 units. In
the second scenario when the company is dealing with the tour company, the additional costs of
the $15000 of the fixed nature is required in the calculation of the breakeven. The company is
achieving the breakeven, therefore the Hampshire Company can make a deal with the tour
company. Also to guide the pricing and the cost management decisions the Hampshire Company
can assign both the nature of the costs to the umbrellas (Kresta & Lisztwanová, 2017).
Document Page
COST ACCOUNTING 9
CVP Analysis Implications
CVP Analysis is a useful tool that helps the managers to take the decisions and check the
needs and the wants of the company at various stages. For the purpose of planning the CVP
analysis will tell how the company is performing and what changes can be undertaken to
improve the productivity. The CVP analysis will also determine the methods of the cost control.
It allows the managers to plug in costs of the variable nature to establish an idea of the future
performance.
A company shall be aware of the different event and the relevant strategies that might be
used while dealing with it. Either way the CVP analysis will help the management in achieving
their goals. The other way could be the sensitivity analysis (Jiang & Shen, 2017).
Document Page
COST ACCOUNTING 10
References
Anderson, J. A., & Leese, W. R. (2016). A Formula for the Units to Satisfy an Operation's
Desired Rate of Return in CVP Analysis--A Conceptual Approach. American Journal of
Business Education, 9(2), 87-100.
Jiang, Y., & Shen, Z. (2017, June). Study on the Application of CVP Analysis in Catering
Industry. In 2nd International Conference on Contemporary Education, Social Sciences
and Humanities (ICCESSH 2017). Atlantis Press.
Kresta, A., & Lisztwanová, K. (2017). Break-even analysis under randomness with heavy-tailed
distribution.
Said, H. A. (2016). Using Different Probability Distributions for Managerial Accounting
Technique: The Cost-Volume-Profit Analysis. Journal of Business and Accounting, 9(1),
3.
chevron_up_icon
1 out of 10
circle_padding
hide_on_mobile
zoom_out_icon
[object Object]