Homework: Analyzing Cyberbullying Data Using SPSS Statistics

Verified

Added on  2023/06/15

|19
|1773
|198
Homework Assignment
AI Summary
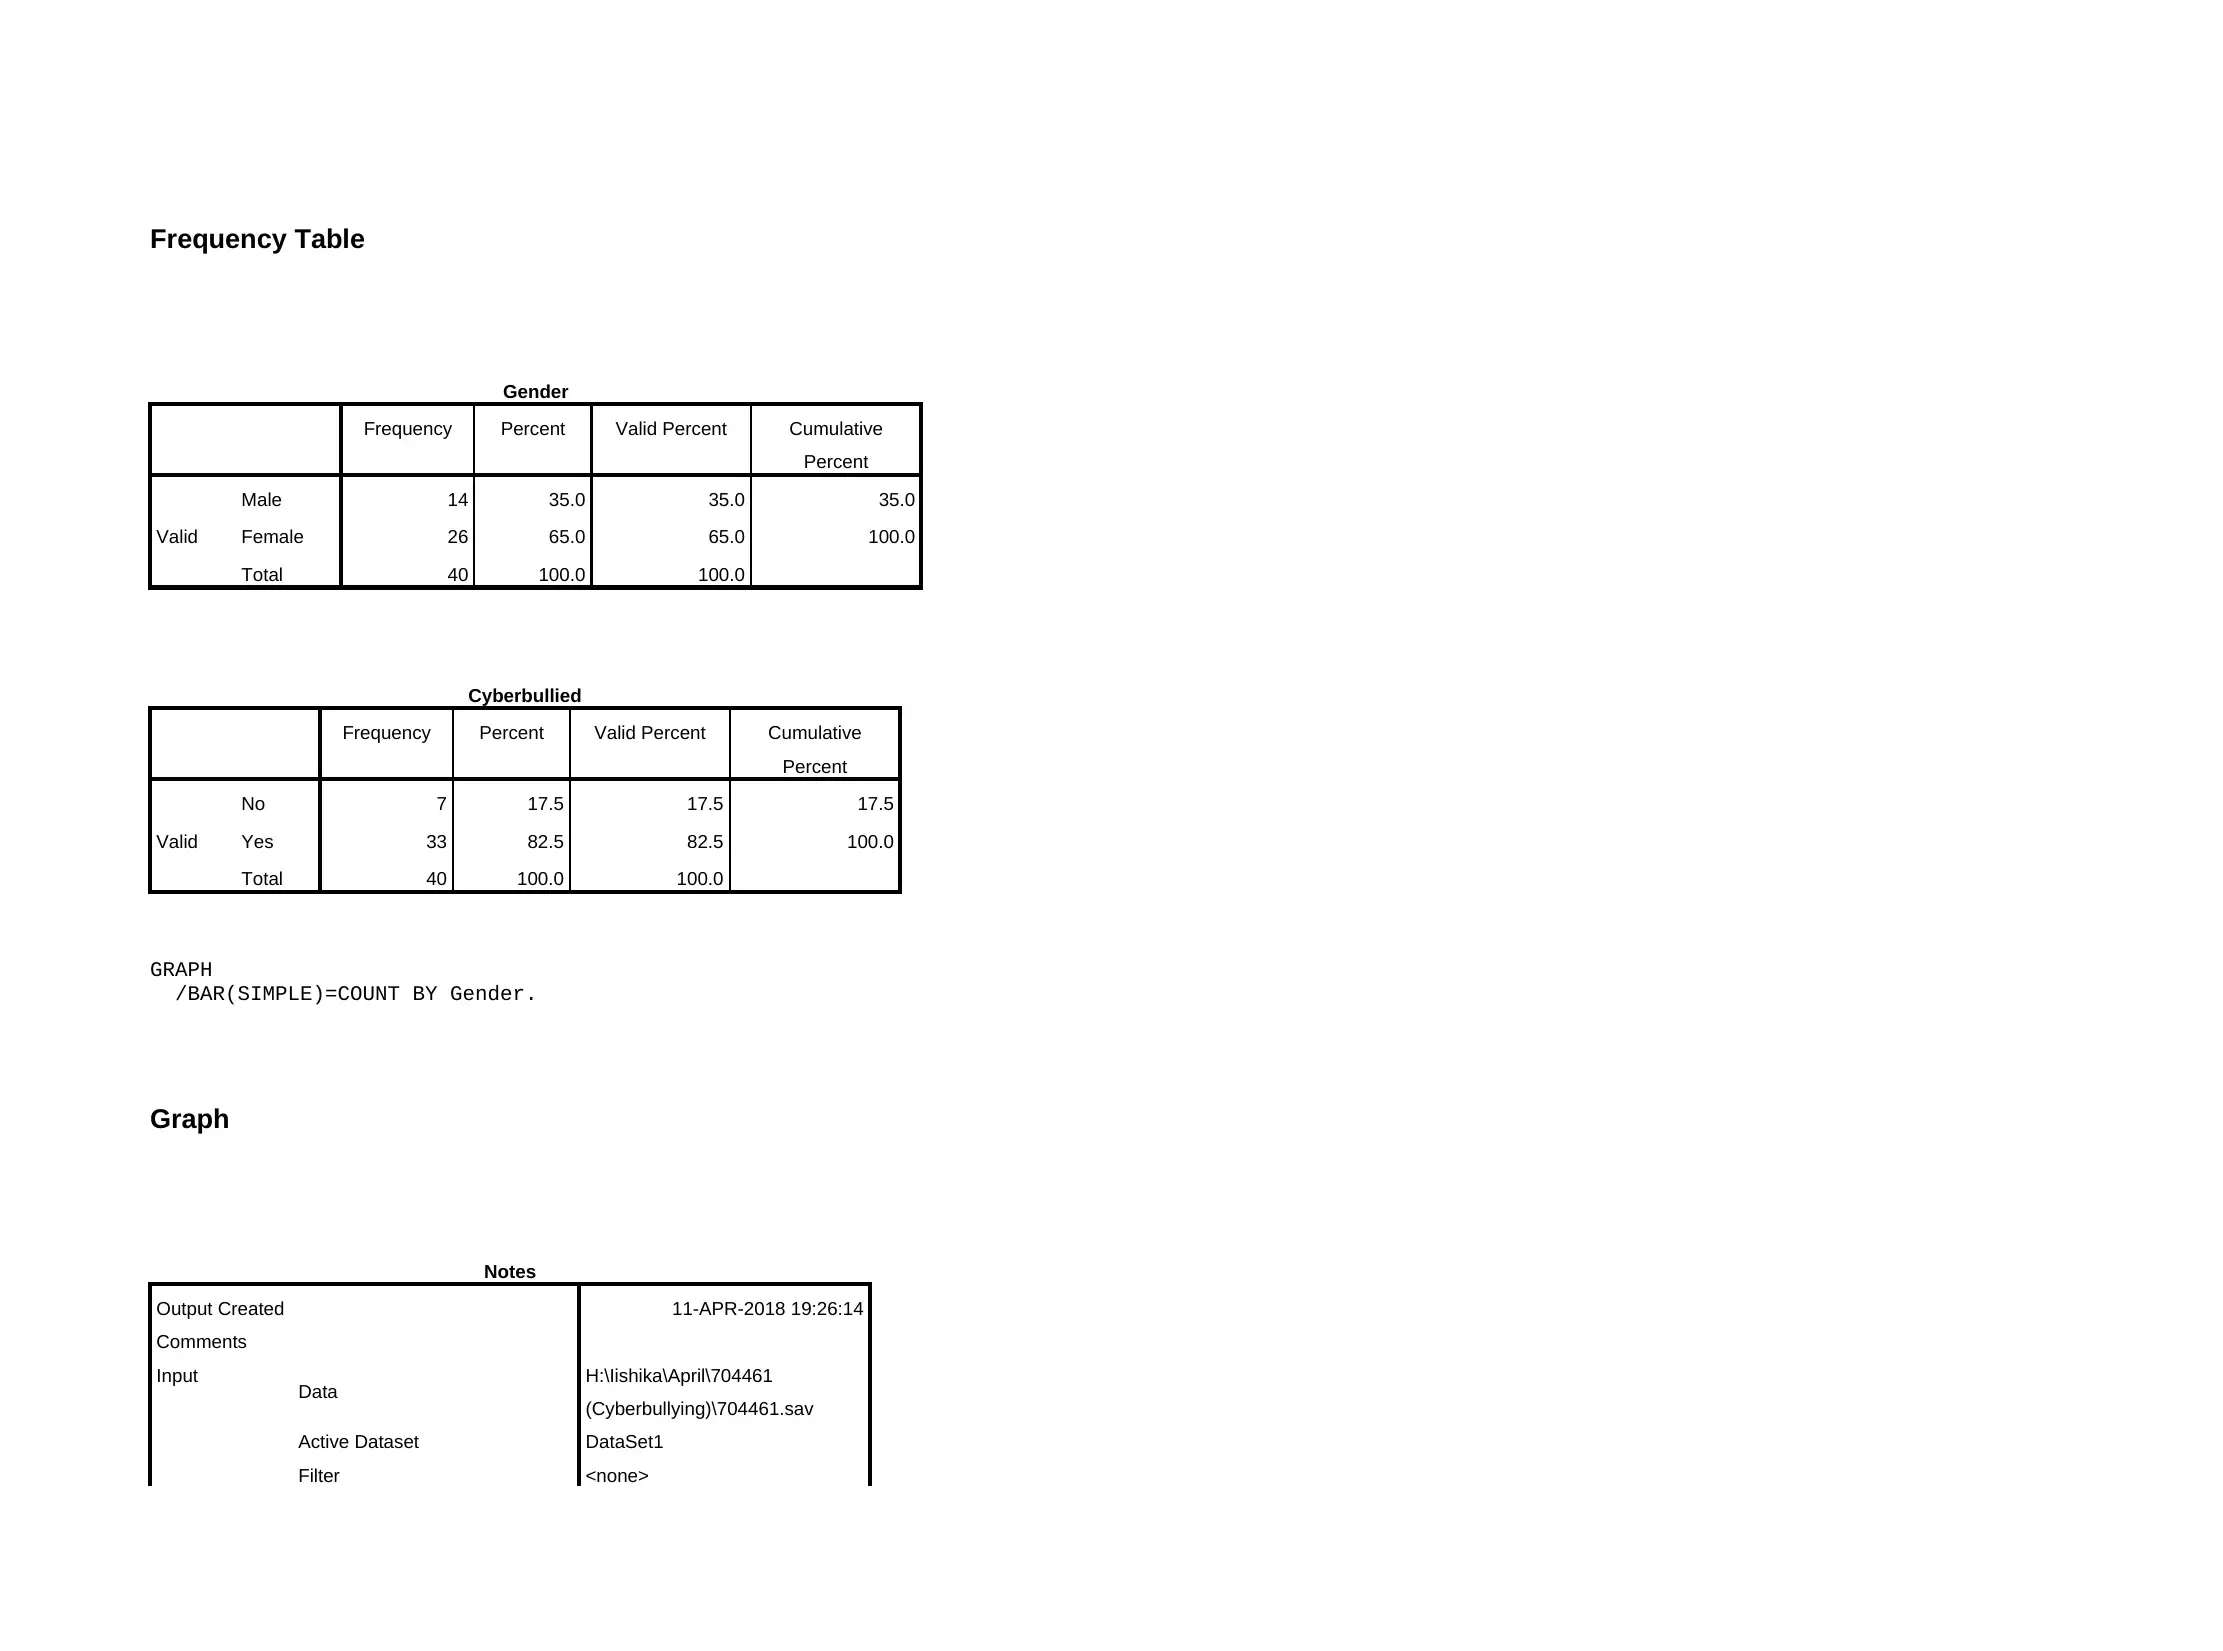
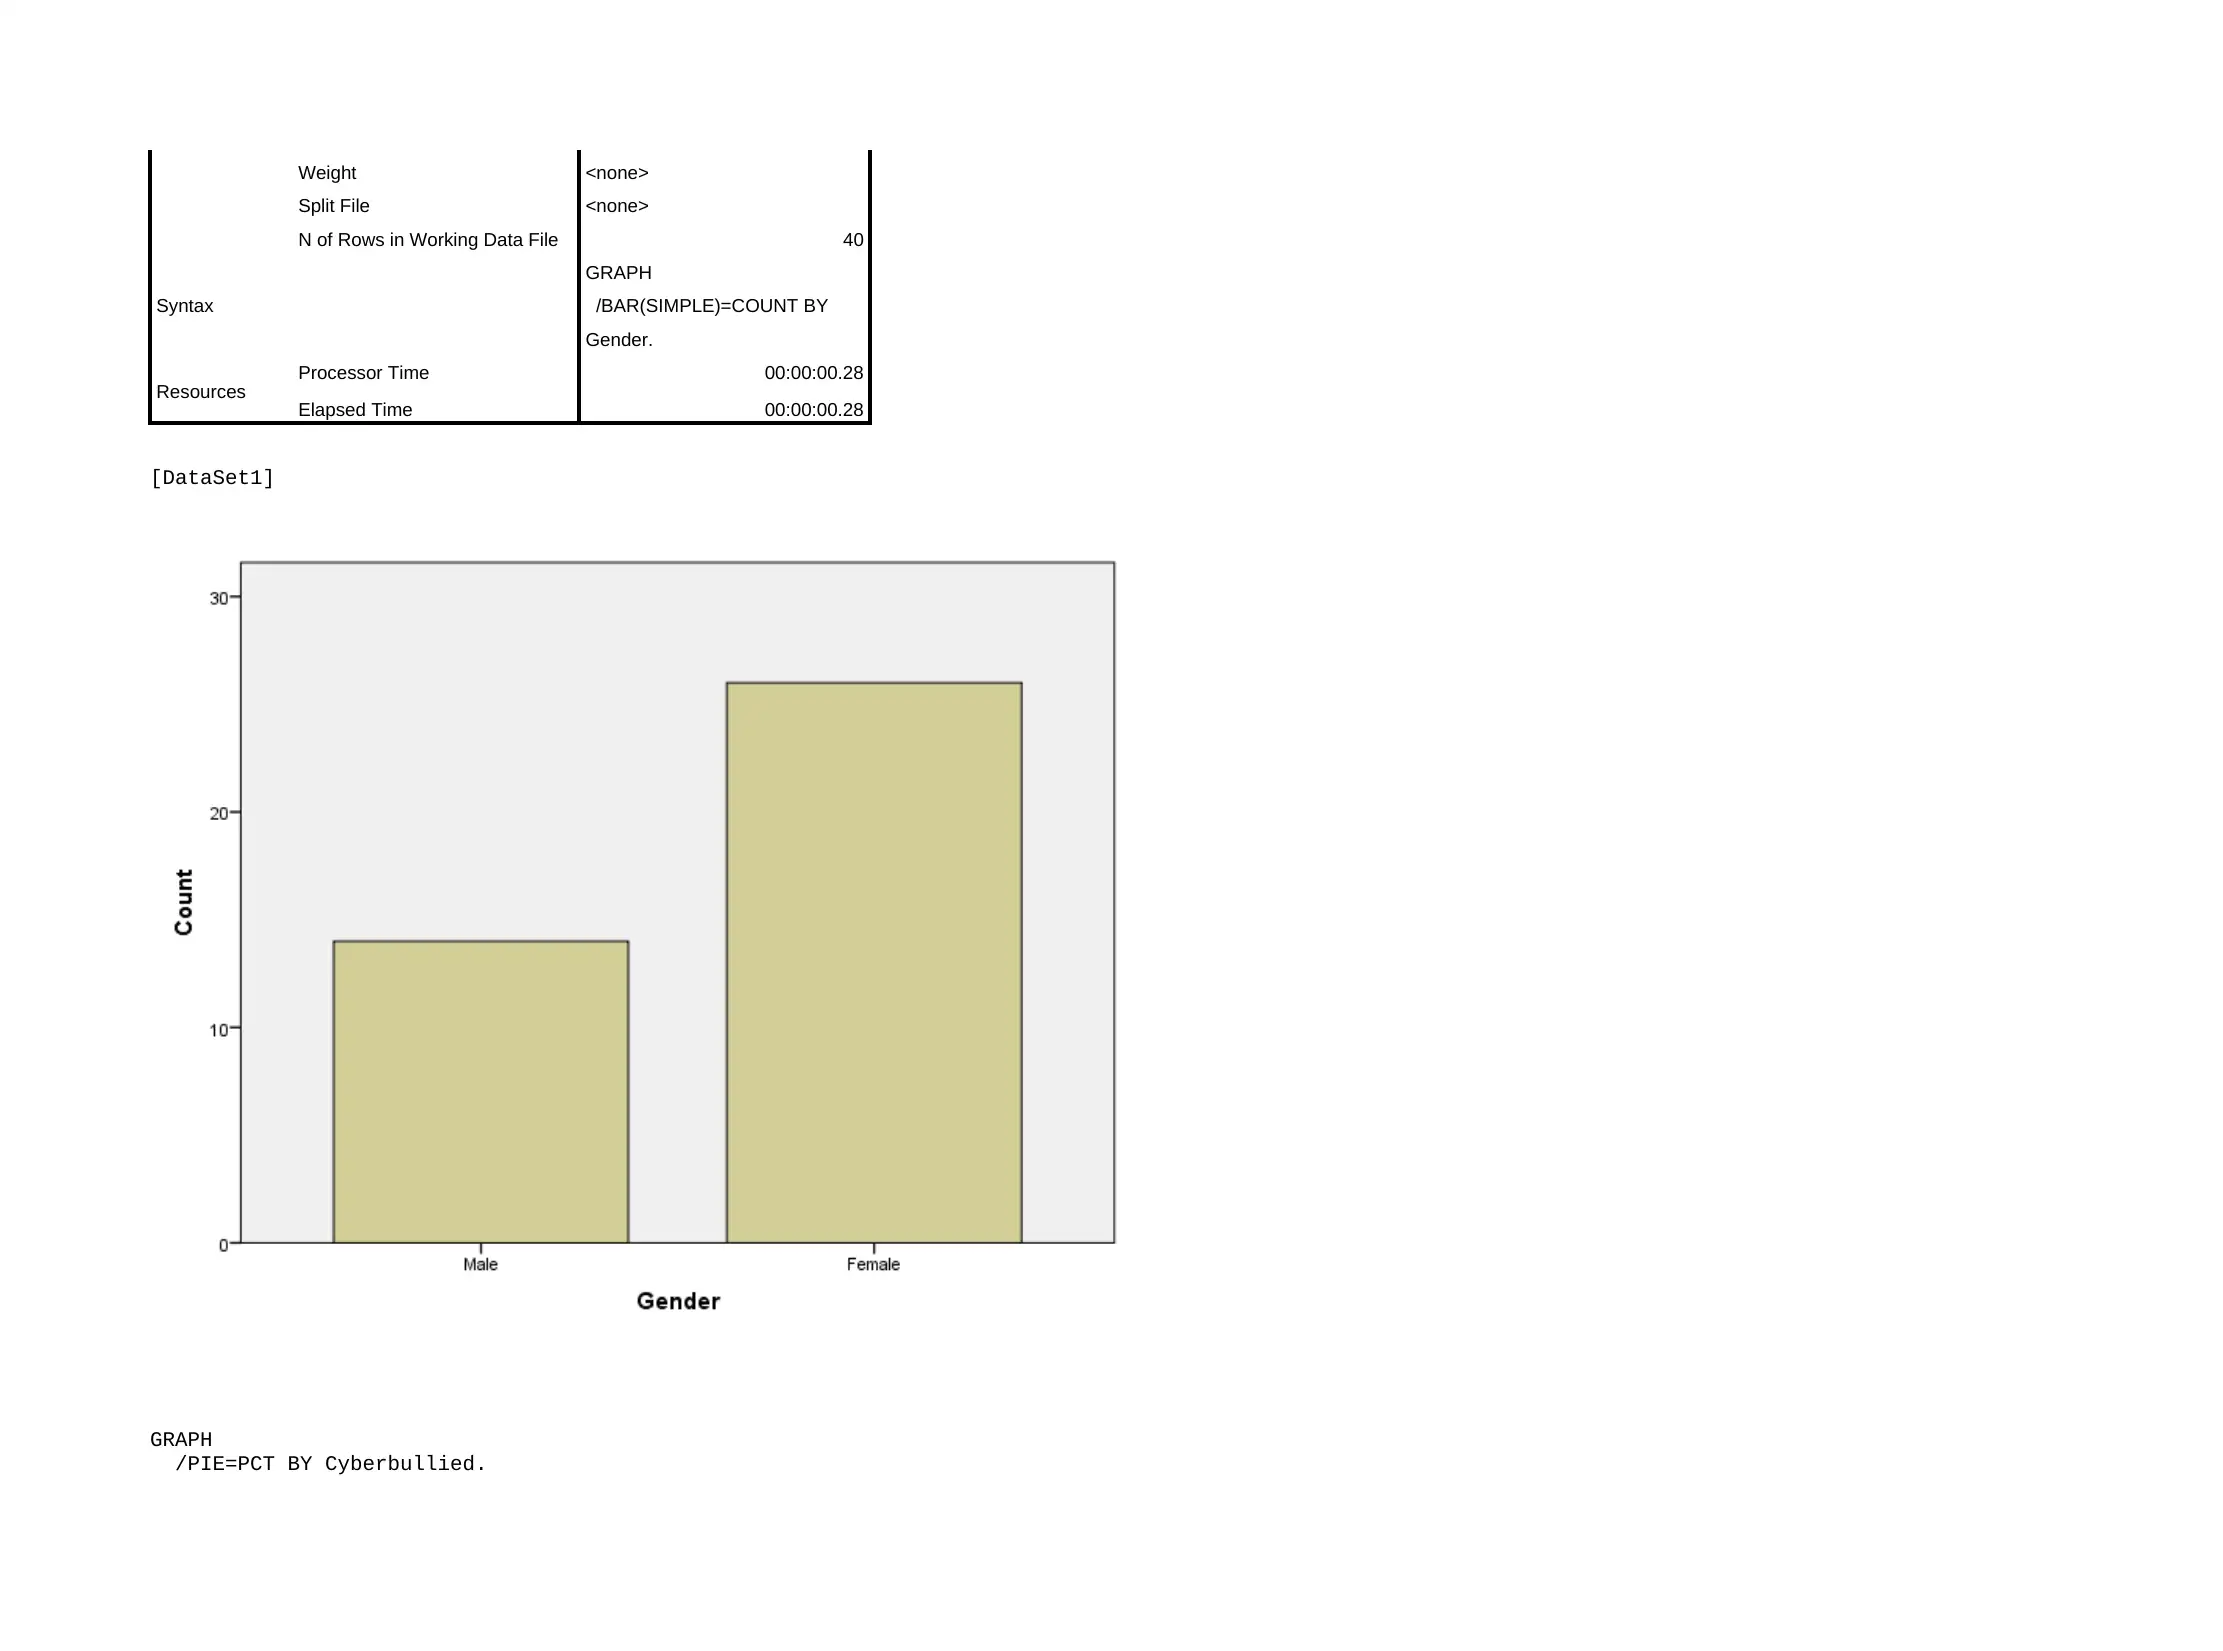
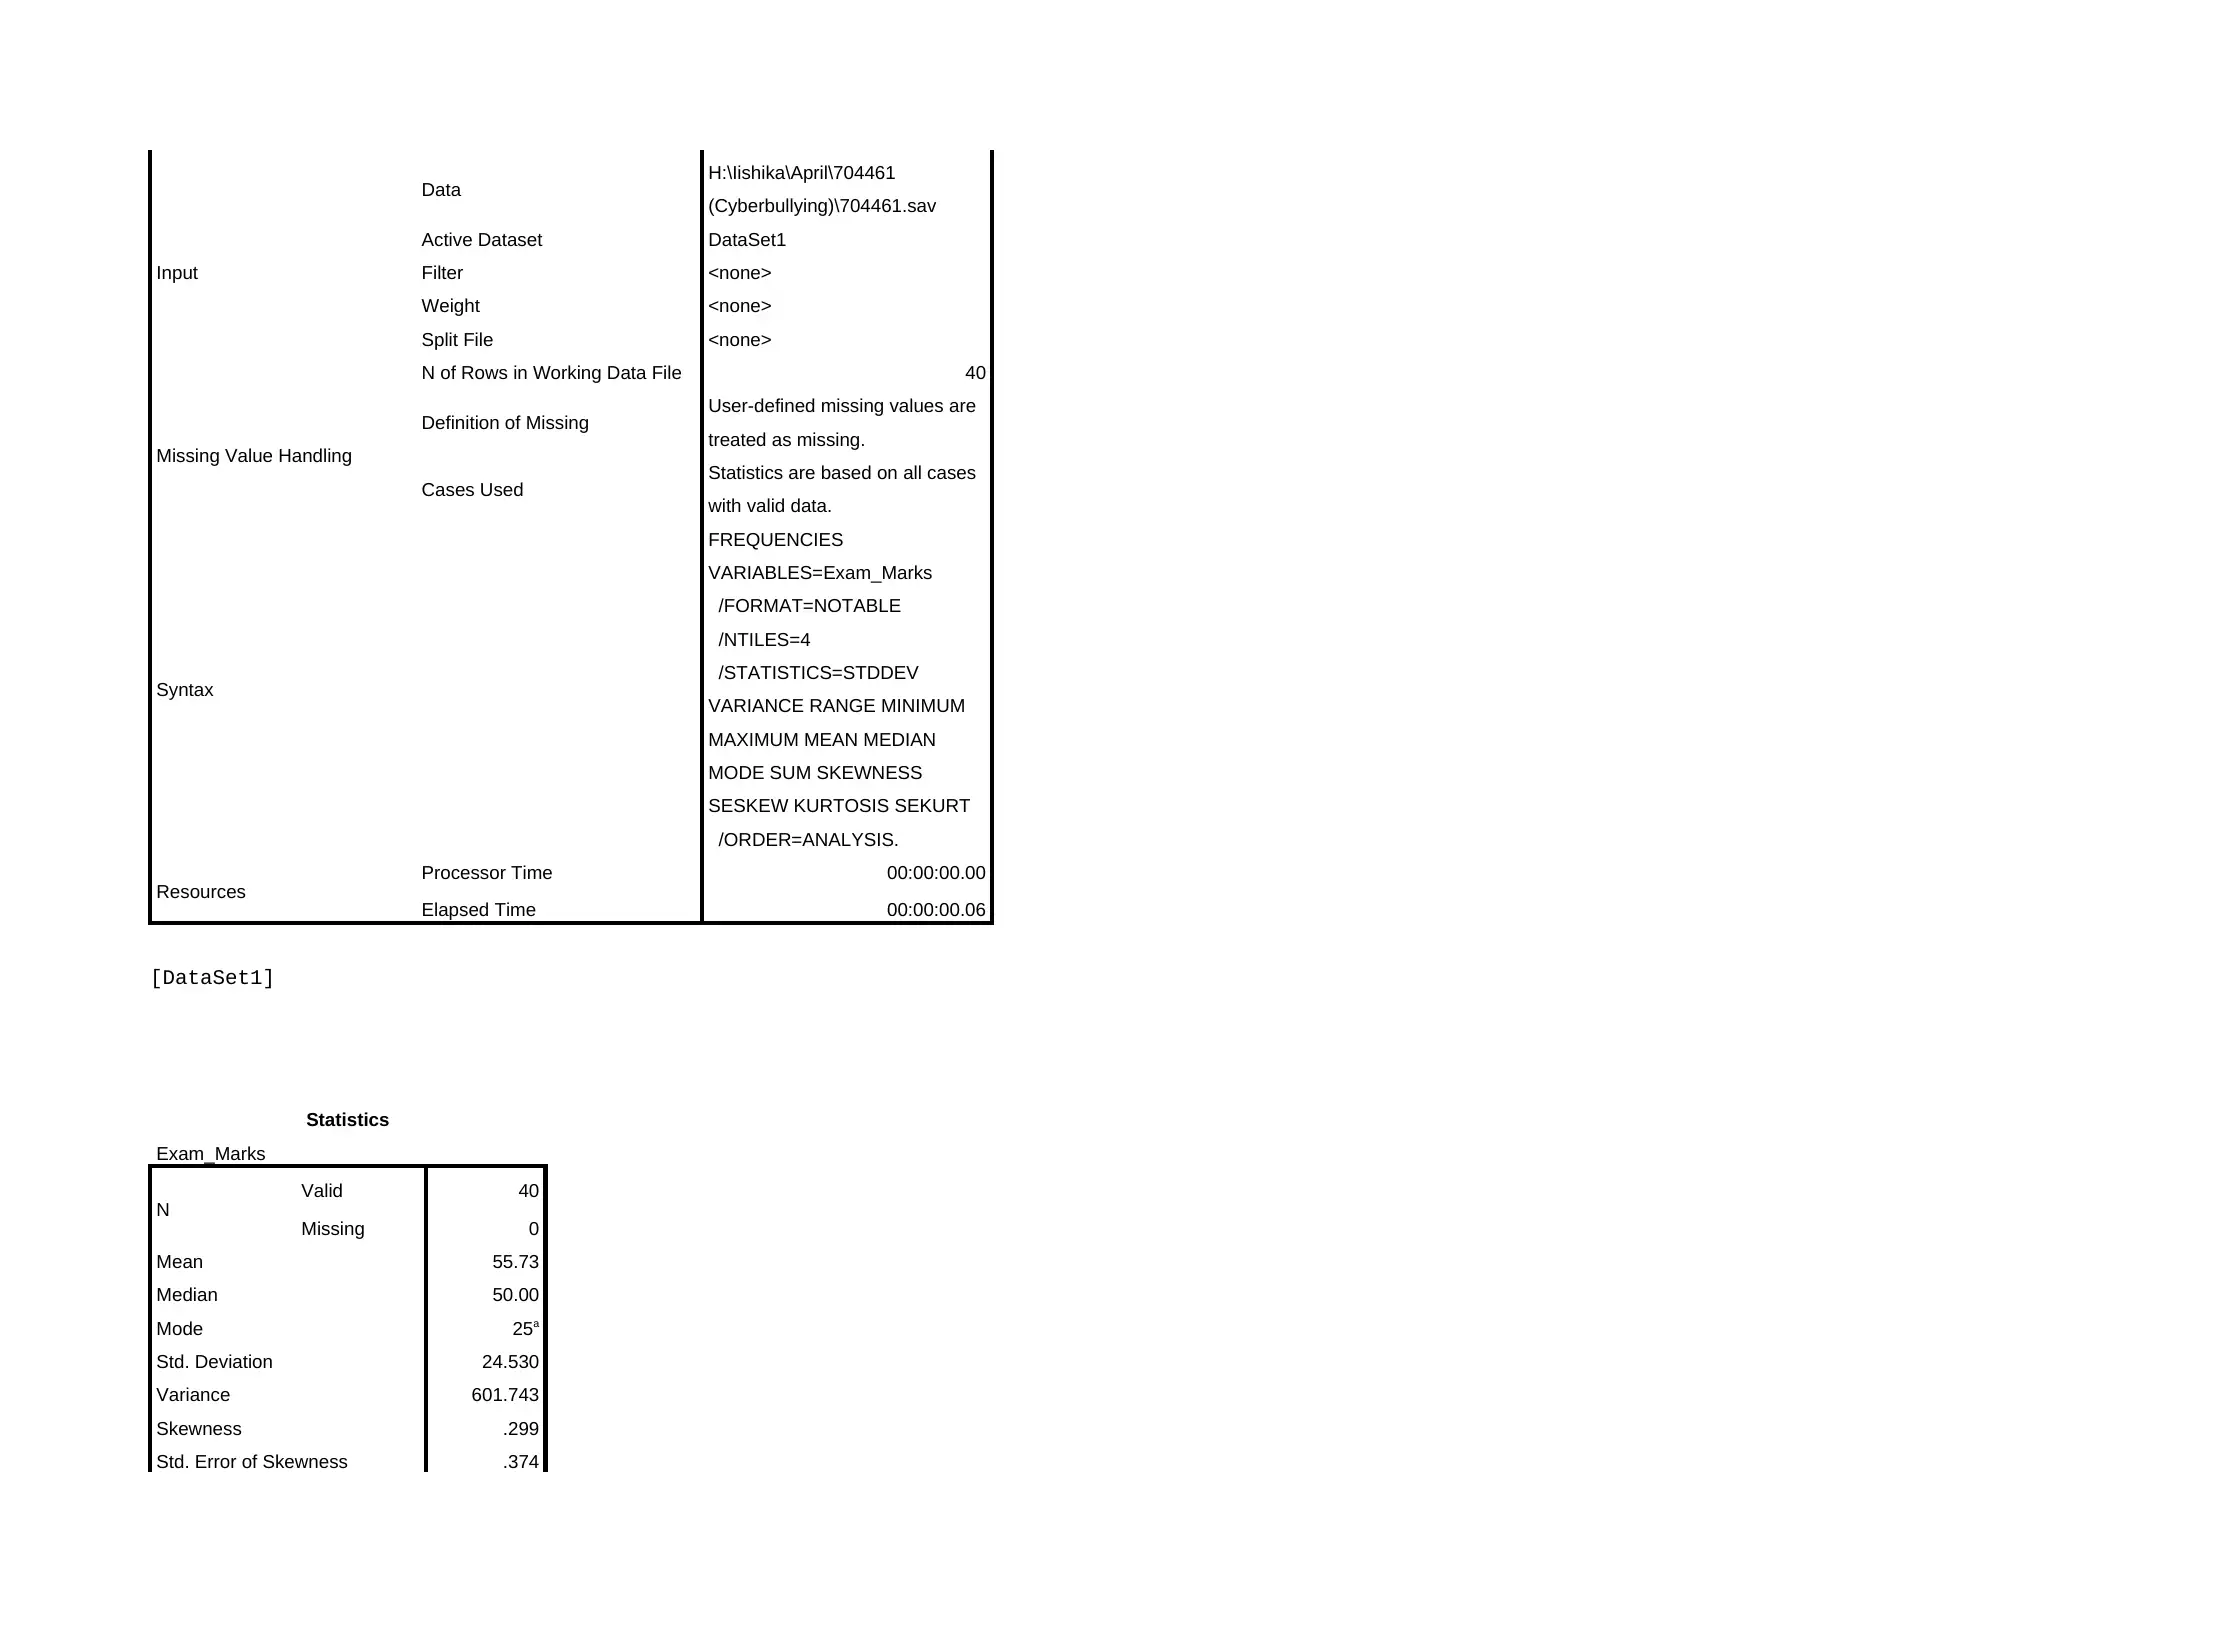
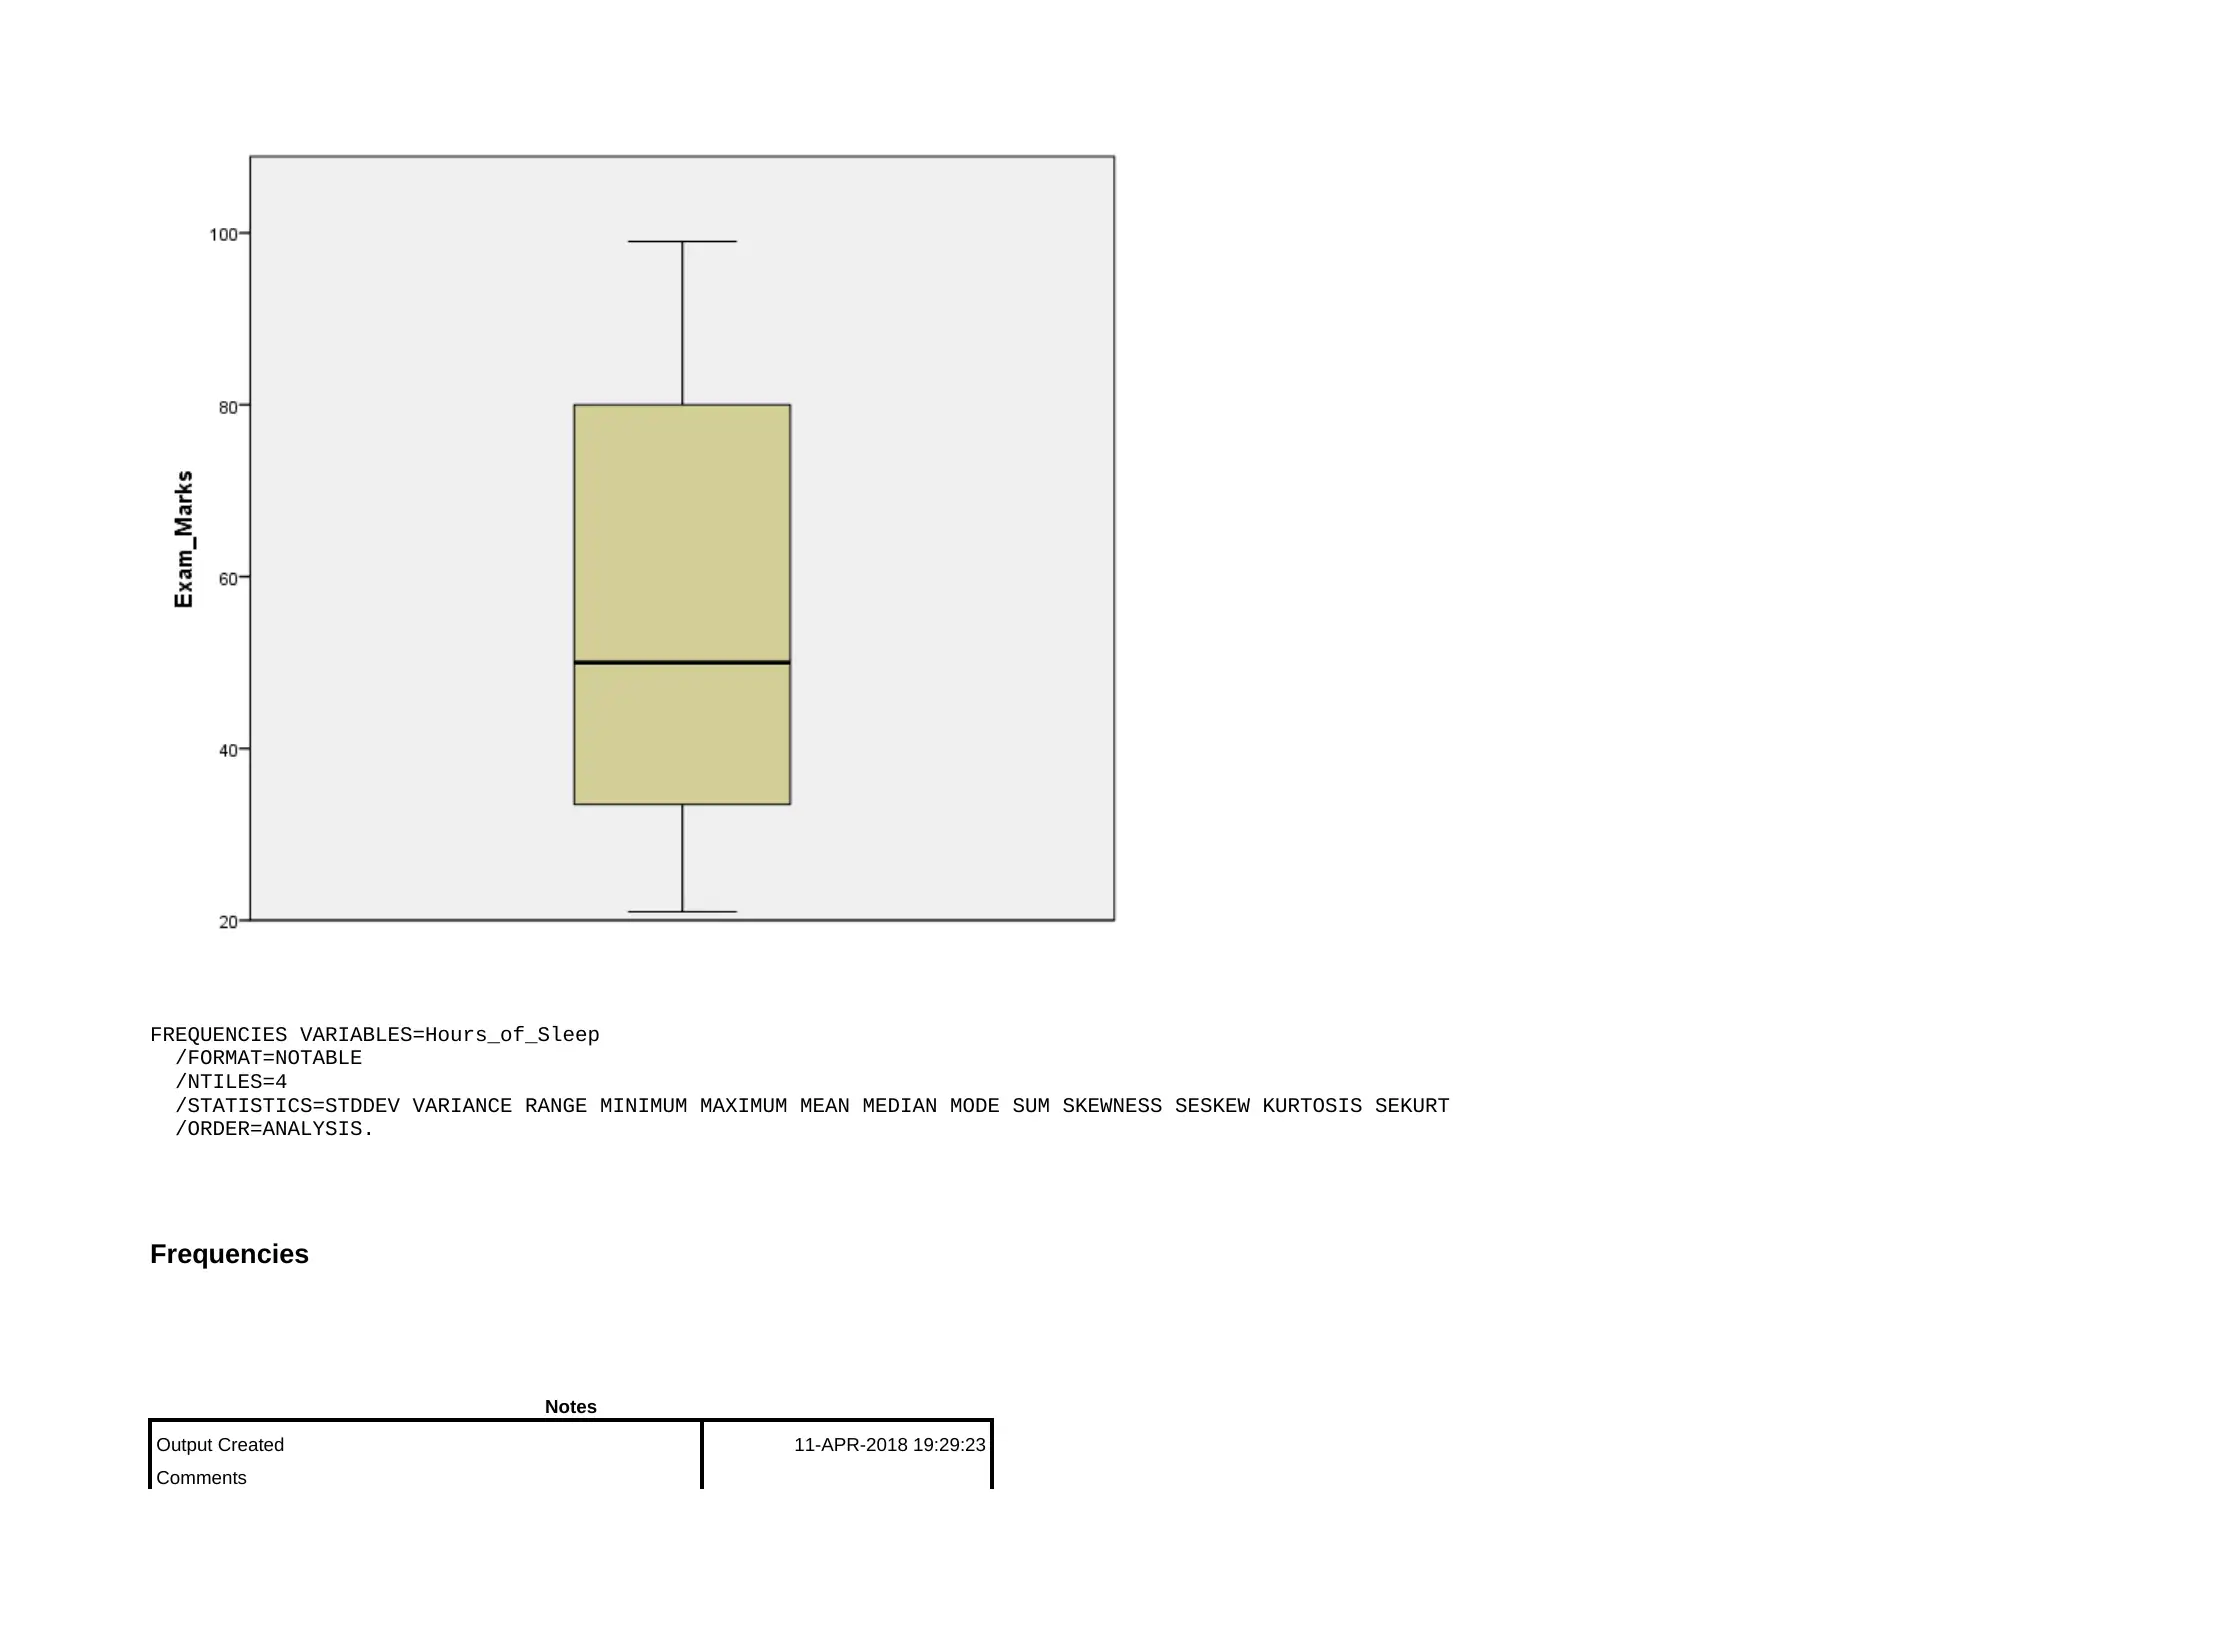
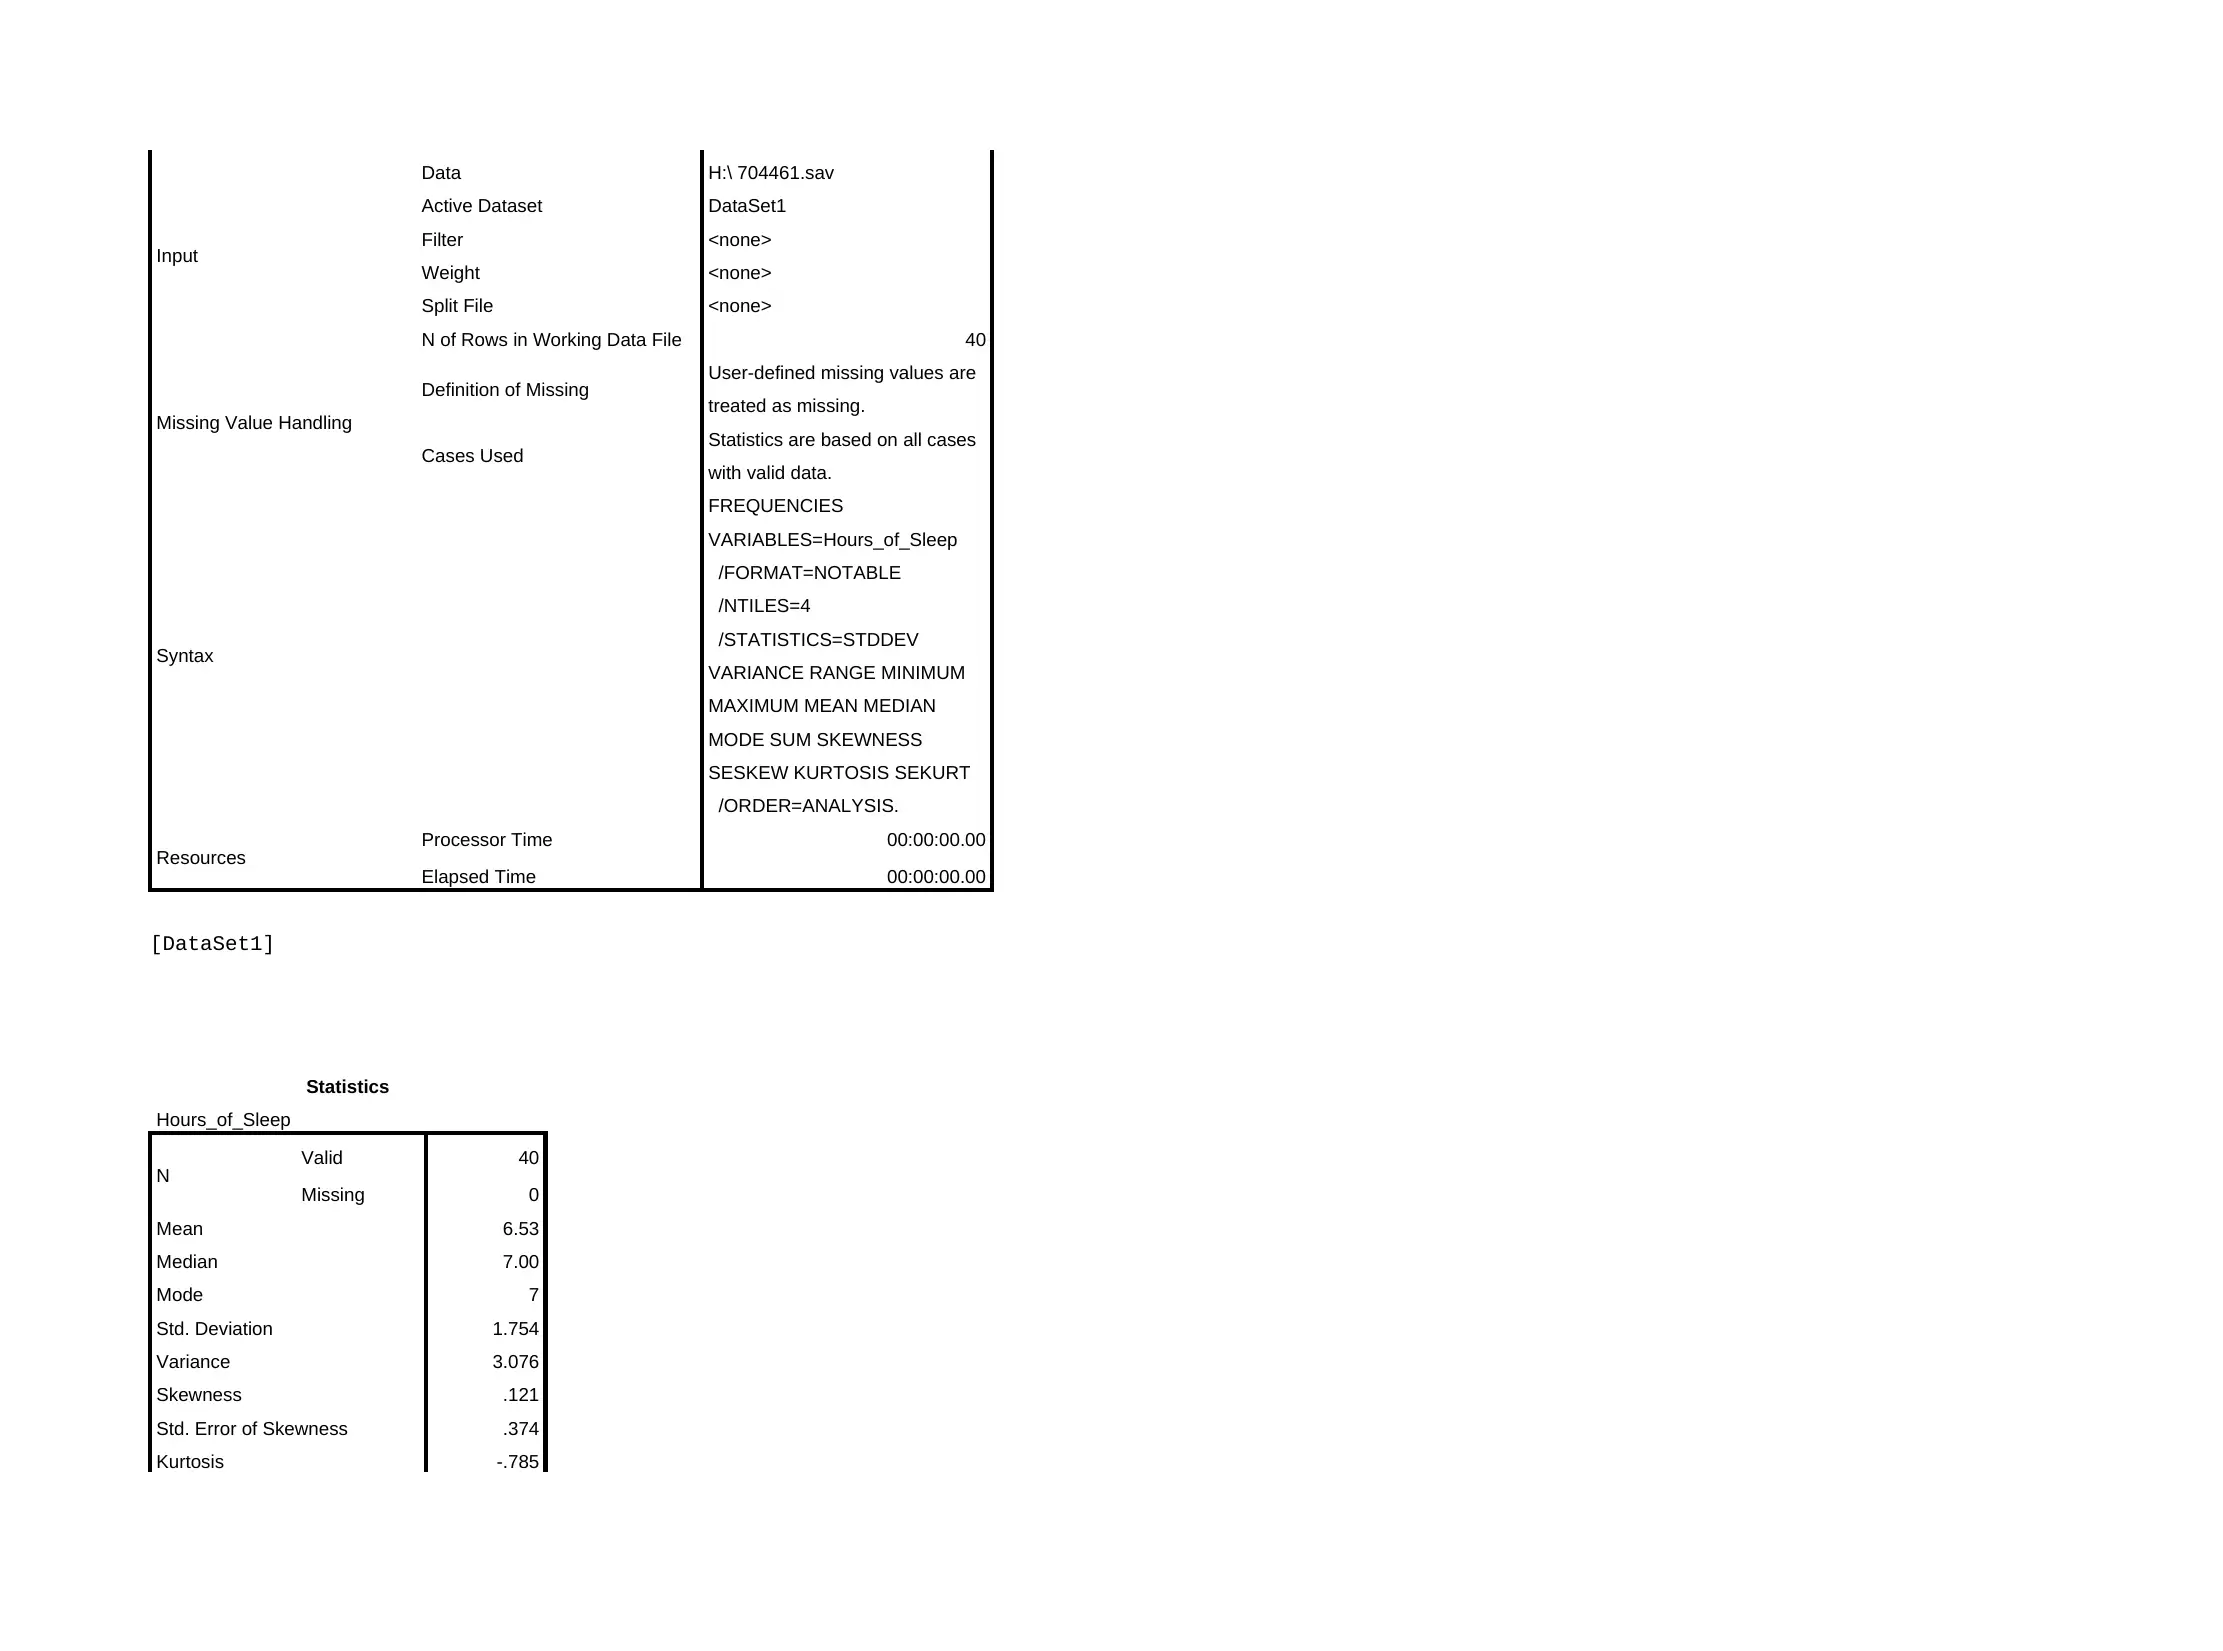
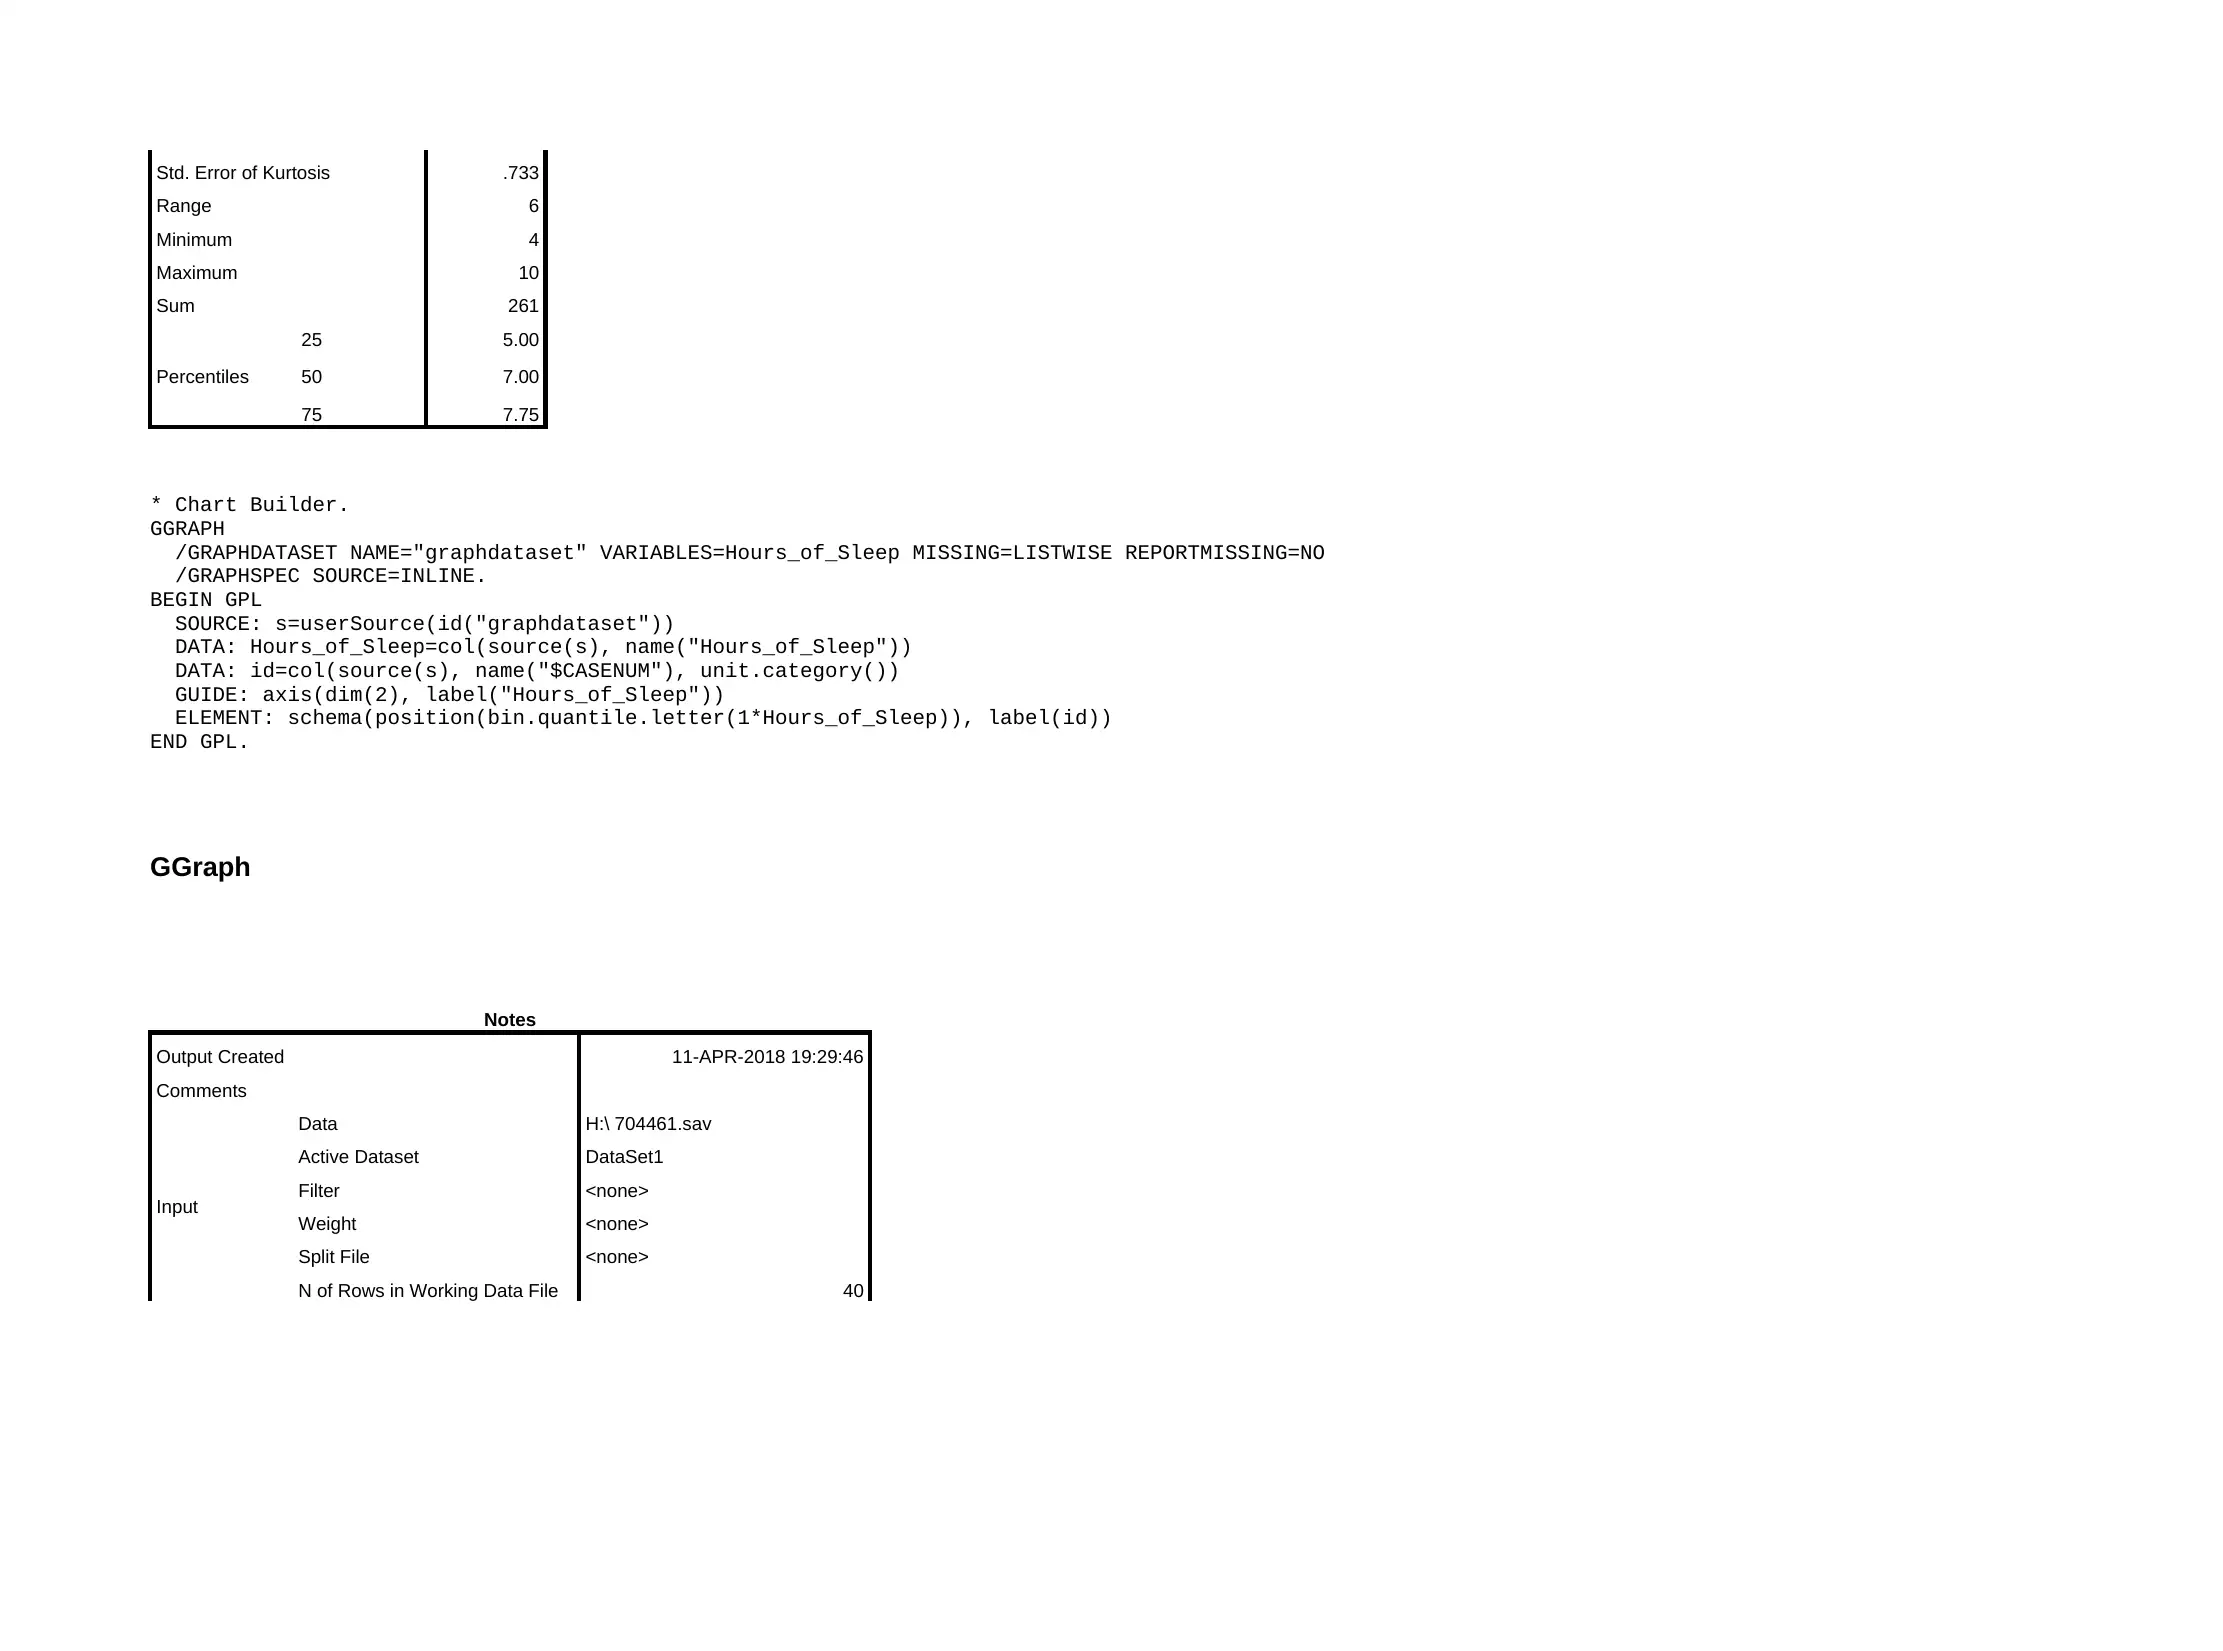
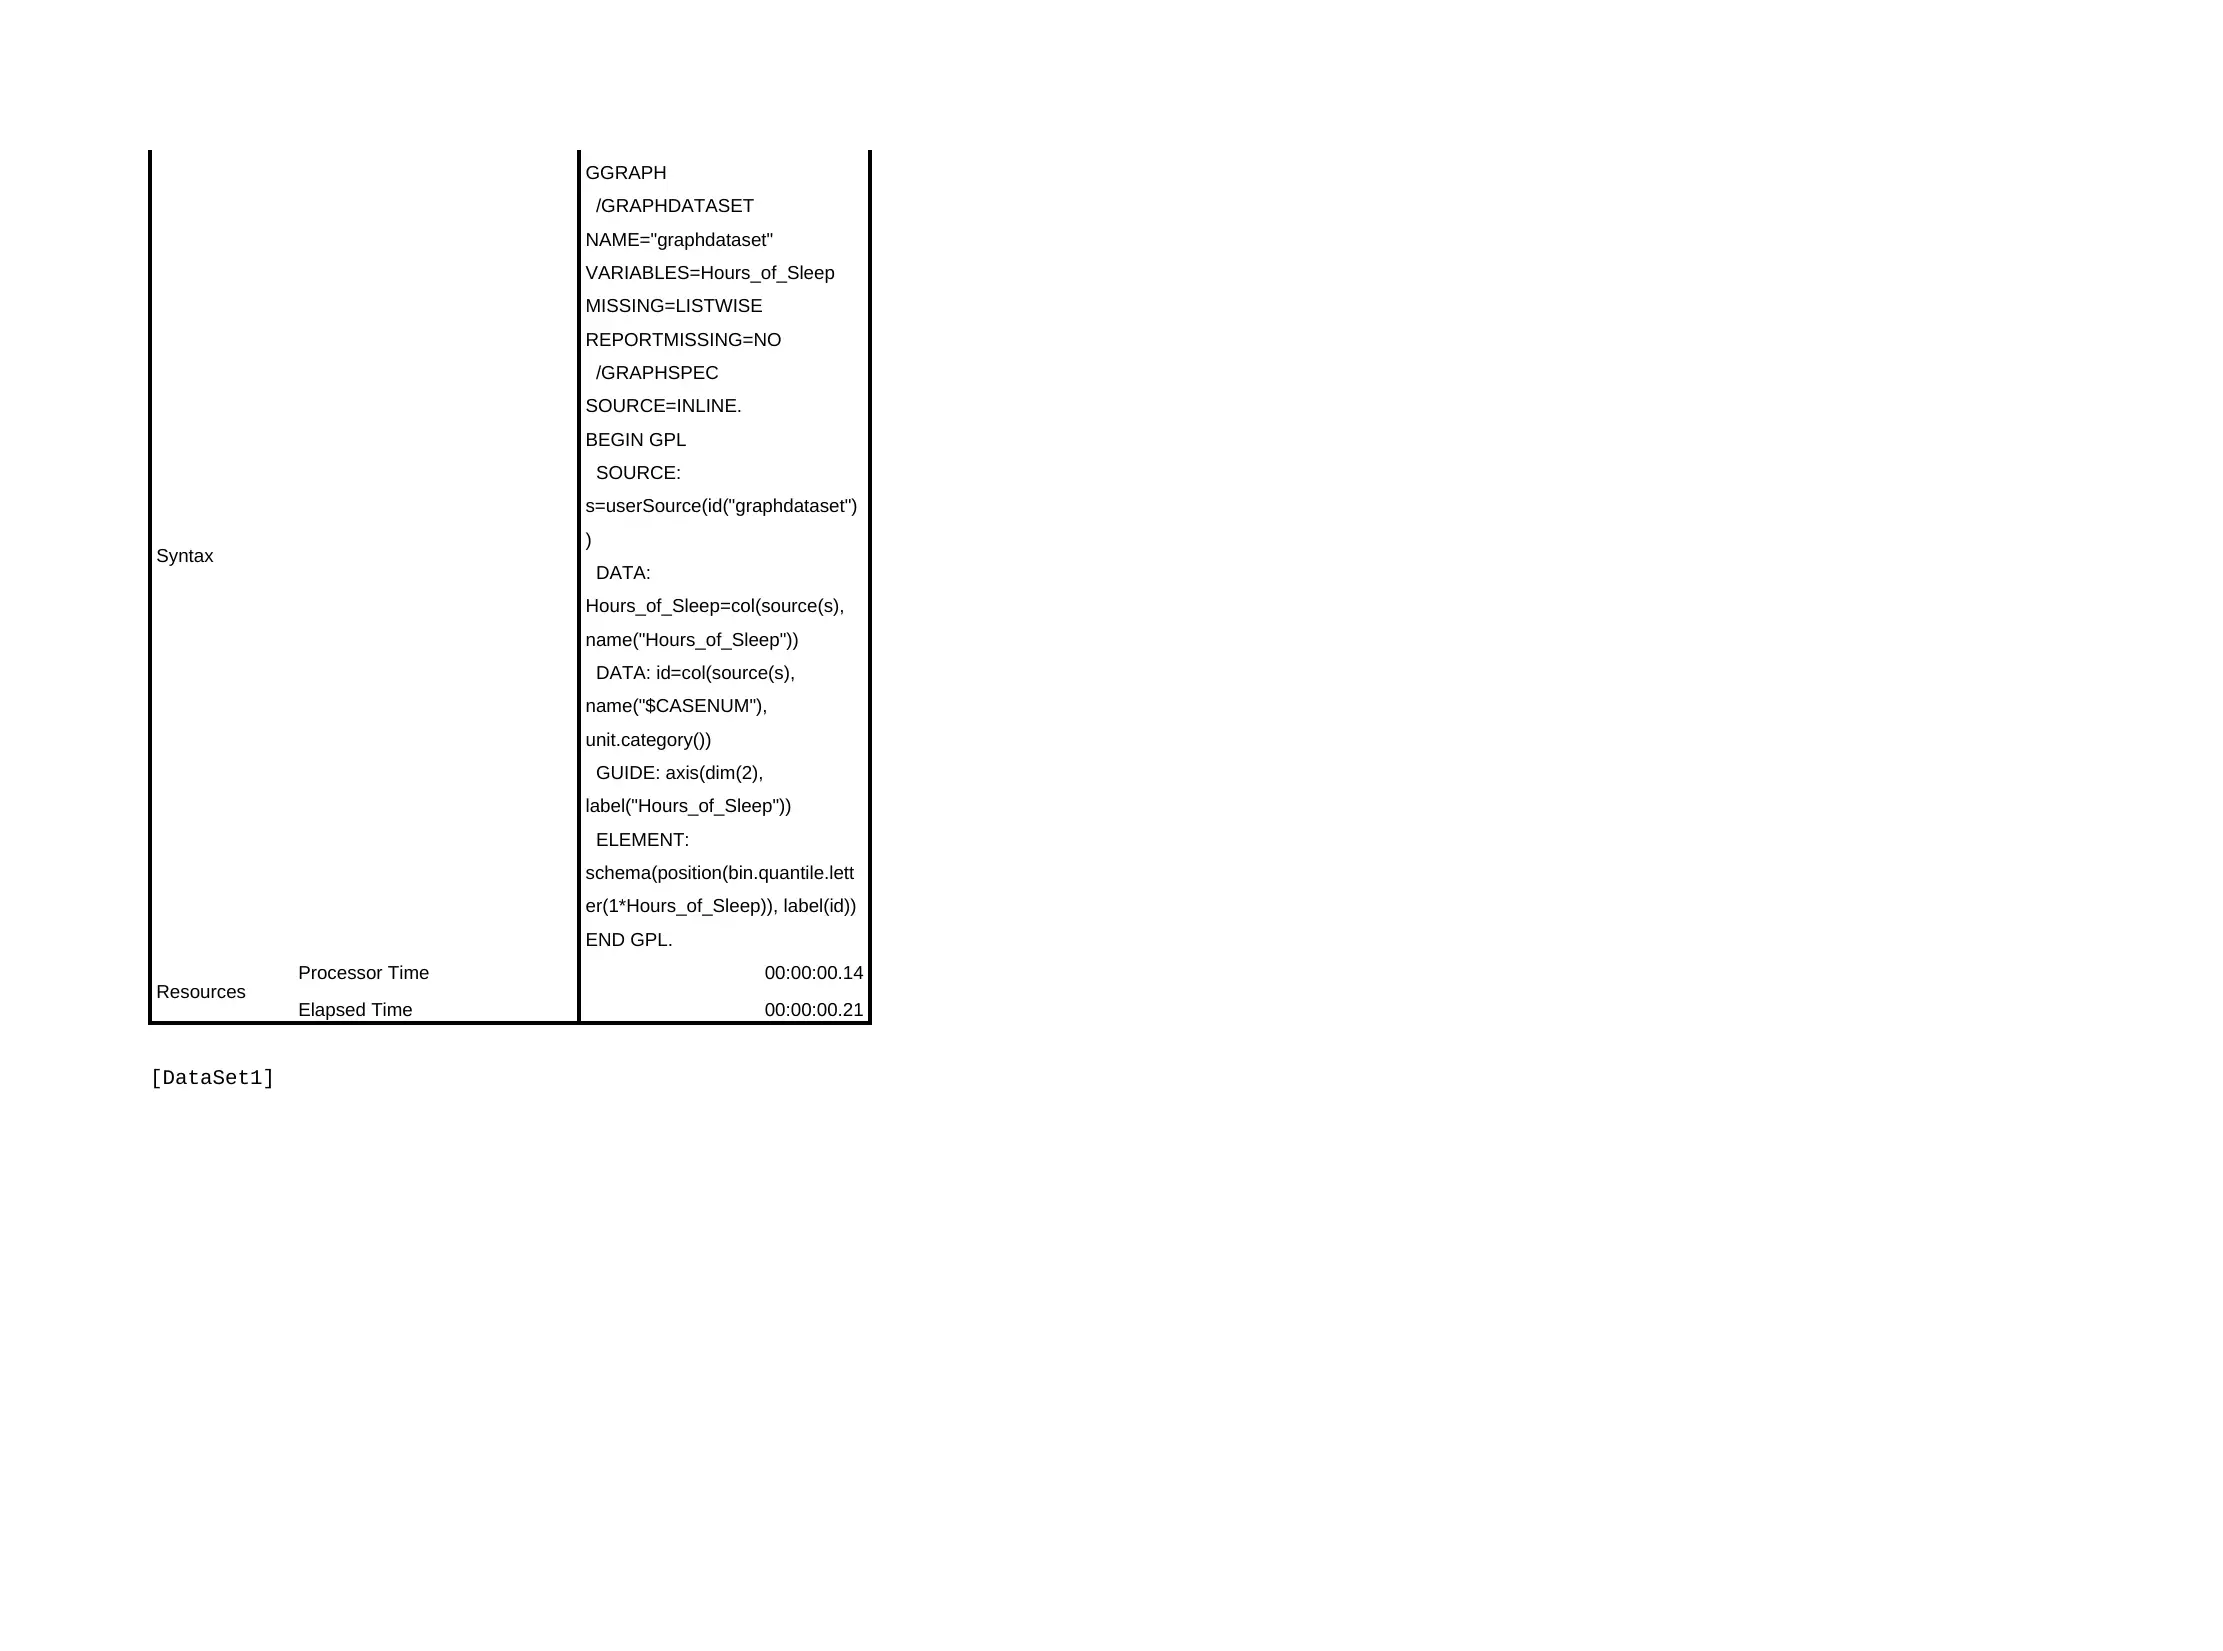
This assignment presents a statistical analysis of cyberbullying data using SPSS. The analysis includes frequency distributions for gender and cyberbullying incidence, revealing that a significant majority (82.5%) of the sample reported experiencing cyberbullying. Cross-tabulation and Chi-square tests explore the relationship between gender and cyberbullying, while t-tests assess the differences in exam marks and hours of sleep between those who have and have not been cyberbullied. The results include descriptive statistics, graphs, and statistical test outputs, offering a comprehensive overview of the dataset. Desklib is a valuable platform for students seeking similar solved assignments and past papers to enhance their understanding of statistical analysis.
Document Page
FREQUENCIES VARIABLES=Gender Cyberbullied
/ORDER=ANALYSIS.
Frequencies
Notes
Output Created 11-APR-2018 19:25:35
Comments
Input
Data H:\Iishika\April\704461
(Cyberbullying)\704461.sav
Active Dataset DataSet1
Filter <none>
Weight <none>
Split File <none>
N of Rows in Working Data File 40
Missing Value Handling
Definition of Missing User-defined missing values are
treated as missing.
Cases Used Statistics are based on all cases
with valid data.
Syntax
FREQUENCIES
VARIABLES=Gender
Cyberbullied
/ORDER=ANALYSIS.
Resources Processor Time 00:00:00.00
Elapsed Time 00:00:00.01
[DataSet1]
Statistics
Gender Cyberbullied
N Valid 40 40
Missing 0 0
tabler-icon-diamond-filled.svg

Paraphrase This Document

Need a fresh take? Get an instant paraphrase of this document with our AI Paraphraser
Document Page
Frequency Table
Gender
Frequency Percent Valid Percent Cumulative
Percent
Valid
Male 14 35.0 35.0 35.0
Female 26 65.0 65.0 100.0
Total 40 100.0 100.0
Cyberbullied
Frequency Percent Valid Percent Cumulative
Percent
Valid
No 7 17.5 17.5 17.5
Yes 33 82.5 82.5 100.0
Total 40 100.0 100.0
GRAPH
/BAR(SIMPLE)=COUNT BY Gender.
Graph
Notes
Output Created 11-APR-2018 19:26:14
Comments
Input Data H:\Iishika\April\704461
(Cyberbullying)\704461.sav
Active Dataset DataSet1
Filter <none>
Document Page
Weight <none>
Split File <none>
N of Rows in Working Data File 40
Syntax
GRAPH
/BAR(SIMPLE)=COUNT BY
Gender.
Resources Processor Time 00:00:00.28
Elapsed Time 00:00:00.28
[DataSet1]
GRAPH
/PIE=PCT BY Cyberbullied.
Document Page
Graph
Notes
Output Created 11-APR-2018 19:26:49
Comments
Input
Data H:\Iishika\April\704461
(Cyberbullying)\704461.sav
Active Dataset DataSet1
Filter <none>
Weight <none>
Split File <none>
N of Rows in Working Data File 40
Syntax GRAPH
/PIE=PCT BY Cyberbullied.
Resources Processor Time 00:00:00.17
Elapsed Time 00:00:00.17
[DataSet1]
tabler-icon-diamond-filled.svg

Paraphrase This Document

Need a fresh take? Get an instant paraphrase of this document with our AI Paraphraser
Document Page
FREQUENCIES VARIABLES=Exam_Marks
/FORMAT=NOTABLE
/NTILES=4
/STATISTICS=STDDEV VARIANCE RANGE MINIMUM MAXIMUM MEAN MEDIAN MODE SUM SKEWNESS SESKEW KURTOSIS SEKURT
/ORDER=ANALYSIS.
Frequencies
Notes
Output Created 11-APR-2018 19:27:51
Comments
Document Page
Input
Data H:\Iishika\April\704461
(Cyberbullying)\704461.sav
Active Dataset DataSet1
Filter <none>
Weight <none>
Split File <none>
N of Rows in Working Data File 40
Missing Value Handling
Definition of Missing User-defined missing values are
treated as missing.
Cases Used Statistics are based on all cases
with valid data.
Syntax
FREQUENCIES
VARIABLES=Exam_Marks
/FORMAT=NOTABLE
/NTILES=4
/STATISTICS=STDDEV
VARIANCE RANGE MINIMUM
MAXIMUM MEAN MEDIAN
MODE SUM SKEWNESS
SESKEW KURTOSIS SEKURT
/ORDER=ANALYSIS.
Resources Processor Time 00:00:00.00
Elapsed Time 00:00:00.06
[DataSet1]
Statistics
Exam_Marks
N Valid 40
Missing 0
Mean 55.73
Median 50.00
Mode 25a
Std. Deviation 24.530
Variance 601.743
Skewness .299
Std. Error of Skewness .374
Document Page
Kurtosis -1.353
Std. Error of Kurtosis .733
Range 78
Minimum 21
Maximum 99
Sum 2229
Percentiles
25 33.25
50 50.00
75 81.50
a. Multiple modes exist. The smallest value is
shown
* Chart Builder.
GGRAPH
/GRAPHDATASET NAME="graphdataset" VARIABLES=Exam_Marks MISSING=LISTWISE REPORTMISSING=NO
/GRAPHSPEC SOURCE=INLINE.
BEGIN GPL
SOURCE: s=userSource(id("graphdataset"))
DATA: Exam_Marks=col(source(s), name("Exam_Marks"))
DATA: id=col(source(s), name("$CASENUM"), unit.category())
GUIDE: axis(dim(2), label("Exam_Marks"))
ELEMENT: schema(position(bin.quantile.letter(1*Exam_Marks)), label(id))
END GPL.
GGraph
Notes
Output Created 11-APR-2018 19:28:56
Comments
Input
Data H:\ 704461.sav
Active Dataset DataSet1
Filter <none>
Weight <none>
Split File <none>
N of Rows in Working Data File 40
tabler-icon-diamond-filled.svg

Paraphrase This Document

Need a fresh take? Get an instant paraphrase of this document with our AI Paraphraser
Document Page
Syntax
GGRAPH
/GRAPHDATASET
NAME="graphdataset"
VARIABLES=Exam_Marks
MISSING=LISTWISE
REPORTMISSING=NO
/GRAPHSPEC
SOURCE=INLINE.
BEGIN GPL
SOURCE:
s=userSource(id("graphdataset")
)
DATA:
Exam_Marks=col(source(s),
name("Exam_Marks"))
DATA: id=col(source(s),
name("$CASENUM"),
unit.category())
GUIDE: axis(dim(2),
label("Exam_Marks"))
ELEMENT:
schema(position(bin.quantile.lett
er(1*Exam_Marks)), label(id))
END GPL.
Resources Processor Time 00:00:00.45
Elapsed Time 00:00:00.50
[DataSet1]
Document Page
FREQUENCIES VARIABLES=Hours_of_Sleep
/FORMAT=NOTABLE
/NTILES=4
/STATISTICS=STDDEV VARIANCE RANGE MINIMUM MAXIMUM MEAN MEDIAN MODE SUM SKEWNESS SESKEW KURTOSIS SEKURT
/ORDER=ANALYSIS.
Frequencies
Notes
Output Created 11-APR-2018 19:29:23
Comments
Document Page
Input
Data H:\ 704461.sav
Active Dataset DataSet1
Filter <none>
Weight <none>
Split File <none>
N of Rows in Working Data File 40
Missing Value Handling
Definition of Missing User-defined missing values are
treated as missing.
Cases Used Statistics are based on all cases
with valid data.
Syntax
FREQUENCIES
VARIABLES=Hours_of_Sleep
/FORMAT=NOTABLE
/NTILES=4
/STATISTICS=STDDEV
VARIANCE RANGE MINIMUM
MAXIMUM MEAN MEDIAN
MODE SUM SKEWNESS
SESKEW KURTOSIS SEKURT
/ORDER=ANALYSIS.
Resources Processor Time 00:00:00.00
Elapsed Time 00:00:00.00
[DataSet1]
Statistics
Hours_of_Sleep
N Valid 40
Missing 0
Mean 6.53
Median 7.00
Mode 7
Std. Deviation 1.754
Variance 3.076
Skewness .121
Std. Error of Skewness .374
Kurtosis -.785
tabler-icon-diamond-filled.svg

Paraphrase This Document

Need a fresh take? Get an instant paraphrase of this document with our AI Paraphraser
Document Page
Std. Error of Kurtosis .733
Range 6
Minimum 4
Maximum 10
Sum 261
Percentiles
25 5.00
50 7.00
75 7.75
* Chart Builder.
GGRAPH
/GRAPHDATASET NAME="graphdataset" VARIABLES=Hours_of_Sleep MISSING=LISTWISE REPORTMISSING=NO
/GRAPHSPEC SOURCE=INLINE.
BEGIN GPL
SOURCE: s=userSource(id("graphdataset"))
DATA: Hours_of_Sleep=col(source(s), name("Hours_of_Sleep"))
DATA: id=col(source(s), name("$CASENUM"), unit.category())
GUIDE: axis(dim(2), label("Hours_of_Sleep"))
ELEMENT: schema(position(bin.quantile.letter(1*Hours_of_Sleep)), label(id))
END GPL.
GGraph
Notes
Output Created 11-APR-2018 19:29:46
Comments
Input
Data H:\ 704461.sav
Active Dataset DataSet1
Filter <none>
Weight <none>
Split File <none>
N of Rows in Working Data File 40
Document Page
Syntax
GGRAPH
/GRAPHDATASET
NAME="graphdataset"
VARIABLES=Hours_of_Sleep
MISSING=LISTWISE
REPORTMISSING=NO
/GRAPHSPEC
SOURCE=INLINE.
BEGIN GPL
SOURCE:
s=userSource(id("graphdataset")
)
DATA:
Hours_of_Sleep=col(source(s),
name("Hours_of_Sleep"))
DATA: id=col(source(s),
name("$CASENUM"),
unit.category())
GUIDE: axis(dim(2),
label("Hours_of_Sleep"))
ELEMENT:
schema(position(bin.quantile.lett
er(1*Hours_of_Sleep)), label(id))
END GPL.
Resources Processor Time 00:00:00.14
Elapsed Time 00:00:00.21
[DataSet1]
chevron_up_icon
1 out of 19
circle_padding
hide_on_mobile
zoom_out_icon