PSY20007: Consumer Psychology - Cyberbullying Research Report
VerifiedAdded on 2022/10/19
|19
|3964
|46
Report
AI Summary
This research report, conducted at an Australian university, investigates the psychological effects of cyberbullying on students. The study analyzes data collected through questionnaires from 223 participants, focusing on the correlation between cyberbullying victimisation, psychological health outcomes (including self-esteem, anxiety, and depression), and coping mechanisms. The report explores the prevalence of cyberbullying, comparing the experiences of those never, sometimes, and repeatedly victimized, and examines the association between victimisation groups and psychological health. The research utilizes scales such as the Cyberbullying Scale, COPE Scale, Rosenberg Self-Esteem Scale, and Brief Symptom Inventory to assess different aspects of the participants' experiences and mental states. Statistical analyses, including hypothesis testing, are performed to determine the significance of the relationships between variables. The results indicate that there are some differences in psychological health outcomes among victimisation groups. The study also discusses limitations and suggests directions for future research. This assignment provides comprehensive insights into the psychological impact of cyberbullying, contributing to a better understanding of the phenomenon and its effects on young adults.
Running Head: CONSUMER PSYCHOLOGY
Consumer Psychology
Name of the Student:
Name of the University:
Author Note:
Consumer Psychology
Name of the Student:
Name of the University:
Author Note:
Paraphrase This Document
Need a fresh take? Get an instant paraphrase of this document with our AI Paraphraser
1CONSUMER PYSCHOLOGY
Abstract
The study on Consumer Psychology is based on the participants of Australian
University. The data has been collected by questionnaire method among 223 students of
Australian University. This study provide the correlation, frequency, and hypothetical test on
a psychological health and victimisation groups among the collected participants. The
concept of bullying and cyberbullying is much different and the psychological effect of them
has been different as well. The following section aims at analysing the researches based on
the common issues related to cyberbullying along with the associated psychological
outcomes of self-esteem in the human being and the coping mechanisms like problem
focused coping mechanism. The psychological impact thus was much more difficult to
handle than it was with the previous forms of the bullying mechanisms. According to the
conducted sampling interview, it was found that the maximum number people in the selected
sample size were involved in cyberbullying as the bullies and the least percentage belonged
to the people who are bullied.
2CONSUMER PYSCHOLOGY
Table of Contents
Abstract......................................................................................................................................1
Introduction................................................................................................................................3
Hypotheses.............................................................................................................................4
Method and Data collection.......................................................................................................4
Results........................................................................................................................................5
Hypothesis test 1....................................................................................................................5
Hypothesis test 2....................................................................................................................5
Hypothesis test 3....................................................................................................................6
Hypothesis test 4....................................................................................................................6
Discussion..................................................................................................................................6
Aim of the study.....................................................................................................................6
Limitation of the Study:.........................................................................................................8
Conclusion..................................................................................................................................9
References................................................................................................................................10
Appendix..................................................................................................................................11
⊘ This is a preview!⊘
Do you want full access?
Subscribe today to unlock all pages.
Trusted by 1+ million students worldwide
3CONSUMER PYSCHOLOGY
Introduction
Bullying is defined as showing dominance towards the other person by hurting or
giving mental torture. This is a standard part of childhood that are regarded as pointless and
mean-spirited. However, it is faced by numerous people during their childhood. Bullying is
not just the behaviour of physically or verbally abusing a person, but it is a multifaceted shift
in tone noticed in human beings. Mostly, it is an aggressive and unsolicited behaviour
exercised as the wrongly perceived imbalance in power. Nowadays, the emergence in
technology has made bullying activities occur with the utilisation of digital technologies as
well. There might be bullying activities involving the usage of social media networks, or even
through emails and text messages. The events has not refrained itself to just physical or
verbal tormenting but also has spread to other mentally ways of harassing people that have
reflected on affecting the psychology of the people. The concept of bullying and
cyberbullying is much different, and the psychological effect of them has been modified as
well. The following section would thus analyse the researches based on the commonness of
cyberbullying along with the associated psychological outcomes of self-esteem in the human
being and the coping mechanisms like a problem-focused coping mechanism.
Review of the literature on the prevalence of cyberbullying
According to Lee and Shin (2017), the studies have provided investigations about the
prevalence of the cyberbullying. The penetration of the factors associated with the
cyberbullying incidence. The authors have conducted a cluster sampling method that
represented the sample taken from 4000 Korean adolescence people. According to the
conducted sampling interview, it was found that the maximum number of people in the
selected sample size were involved in cyberbullying as the bullies. Also, the least percentage
belonged to the people who are bullied. Based on the identification and the obtained result
from the conducted interview, it was found that the prevalence of the occurrences of
cyberbullying was taking place through the variable social network services or SNS. The
availability and the mechanism of the SNS factors provided the bullies with the tools to
continue the bullying activities as well. More than the percentage of the people found to be
the sole victims in this system, and there were also a certain percentage of people found in the
sample taken and found to be acting as both bullies and the victims. Therefore, the prevalent
commonality found in this regard clarifies that the victims were also the bullies. This could
be a coping mechanism as well for the victims to be the bullies and torment the others as
well.
Review of the literature on cyberbullying and the psychological outcomes like self-
esteem
According to the author Palermiti, Servidio, Bartolo and Costabile (2017), it was
found that mostly the student who were related to experiencing the effects of cyberbullying
posed as the victims in the scenario. They also posed as an offender were reflected to have
much lower self-esteem than the others. This is an alarming issue that was found to be a
repercussion of the associated psychological outcomes of the survey. The study was
conducted by the author to find out the relevance of the entire issue to find out or examine the
level of self-esteem in adolescent students. Due to this, it was found that the statistical
Paraphrase This Document
Need a fresh take? Get an instant paraphrase of this document with our AI Paraphraser
4CONSUMER PYSCHOLOGY
analysis was dependent on the relationship existing between experiences that the students are
having with cyberbullying and the lower self-esteem in the students. After it was found that
the mean age of the sample size of the involved students was between the ages of 12 to 13, it
was a much alarming issue. It is due to the children of age 12-year-olds have lower self-
esteem as both the victim and the proprietor of the bullying through the cyber world. It was
noted in the more considerable amount of school districts of various countries.
Review of the literature on cyberbullying and coping mechanisms like problem-focused
coping
The coping mechanism, as per McLoughlin (2019), was found that there were mixed
results to the factorisation of the coping styles. It was inferred as per the researches based on
the unproductive forms of the coping mechanisms. The study was again conducted with the
involvement of the adolescent students, and it was found that the coping mechanism in the
teenage students was actively formulating within the students, it was more moving on to
coping with the situation in the form of taking revenge. Therefore, it could be seen that the
ways by which the students were trying to deal with the case were to involve as the bullies if
they were victims of the cyberbullying situation before. The psychological impact thus was
much more difficult to handle than it was with the previous forms of the bullying
mechanisms.
Hypotheses
To test there is a difference between the average scores in anxiety, self-esteem, and
depression among the Never/Single/Repeated victimisation groups.
To test an association between a psychological health and victimisation groups.
Method and Data collection
This research has been done by the University of Human Research Ethics Committee.
The data has been collected by online questionnaire method. The participants which has
agreed to involve in this study this participants access thoroughly the University URL system.
The questionnaire provide the information on cyberbullying, psychological outcomes, coping
and other demographic information like gender, age. The sample has been collected from
psychology students an Australian university. The survey has been completed within the first
week of the semester of the participants.
There are 223 sample has been collected by questionnaire method, in which there are
54 males and 169 females. In this study the sample has been collected in different age group.
The mean age of the gender is 23.02 and the standard deviation is 4.574. The age range is
also determined. This age range is the difference between maximum and minimum age.
Therefore the range is 22.
Using SPSS the frequencies, descriptive statistics and different test has been done. In
this study different material has also been provided and this are given below.
5CONSUMER PYSCHOLOGY
Cyberbullying scale: This scale is a 10-item scale. The samples are react on a five
point respond scale from one to five. All the samples are classified in to three
victimisation level groups: 1=Never; 2= Single episode, 3 = Repeated.
COPE scale: This scale has been divided into 60 items scale and this has to be
subdivided into 15 subscales. After this two coping styles has to be combined on the
scores of the similar subscales. Higher scores has been used of that coping strategy.
Rosenberg Self-Esteem Scale: This scale is a 10 item scale. The samples has been
responded on a four-point Likert scale ranging from 1-4. In this scale items has been
seen in the reverse scored. The higher level of self- esteem has been illustrate the
higher scores on this scale.
The Brief Symptom Inventory: The Inventory scale is a scale which is divided in to
53 items and this is measured by range of negative psychological symptoms. In this
section has been showed the Depression and Anxiety subscales. The samples are
respond on a five-point scale where 1 = Not at all and five and 5 = Extreme. The
greater experience of a particular symptom has been showed by higher scores.
Results
The table number 1 has been provided the Nasty text message on different category. It
has been seen that the highest percentage of participants in the never section and the very few
percentage of participant is on the repeated section. It is clear from the table 1 that only once
and twice section is approximately a half number participant comparing to never section.
From the table 2 it has been cleared that most of the participant is the never section
and it is 95%. The 5% participant is on the only once and twice section.
The table 3 has been illustrated that the 90% participant is on the never section of
phone photos, videos of intimate scenes and just only a single percent of participant is in the
repeated section. The table number 4 to 10 all the table provide the same picture like the
previous table. It is clear from the study that in phone photos/videos of violent scene section
is the only section where repeated is absent.
Hypothesis test 1
H0: There is a difference between the mean scores in anxiety, self- esteem and depression
across the Never/Single victimisation groups.
H1: There is no difference between the mean scores in self-esteem, anxiety, and depression
across the Never/Single victimisation groups.
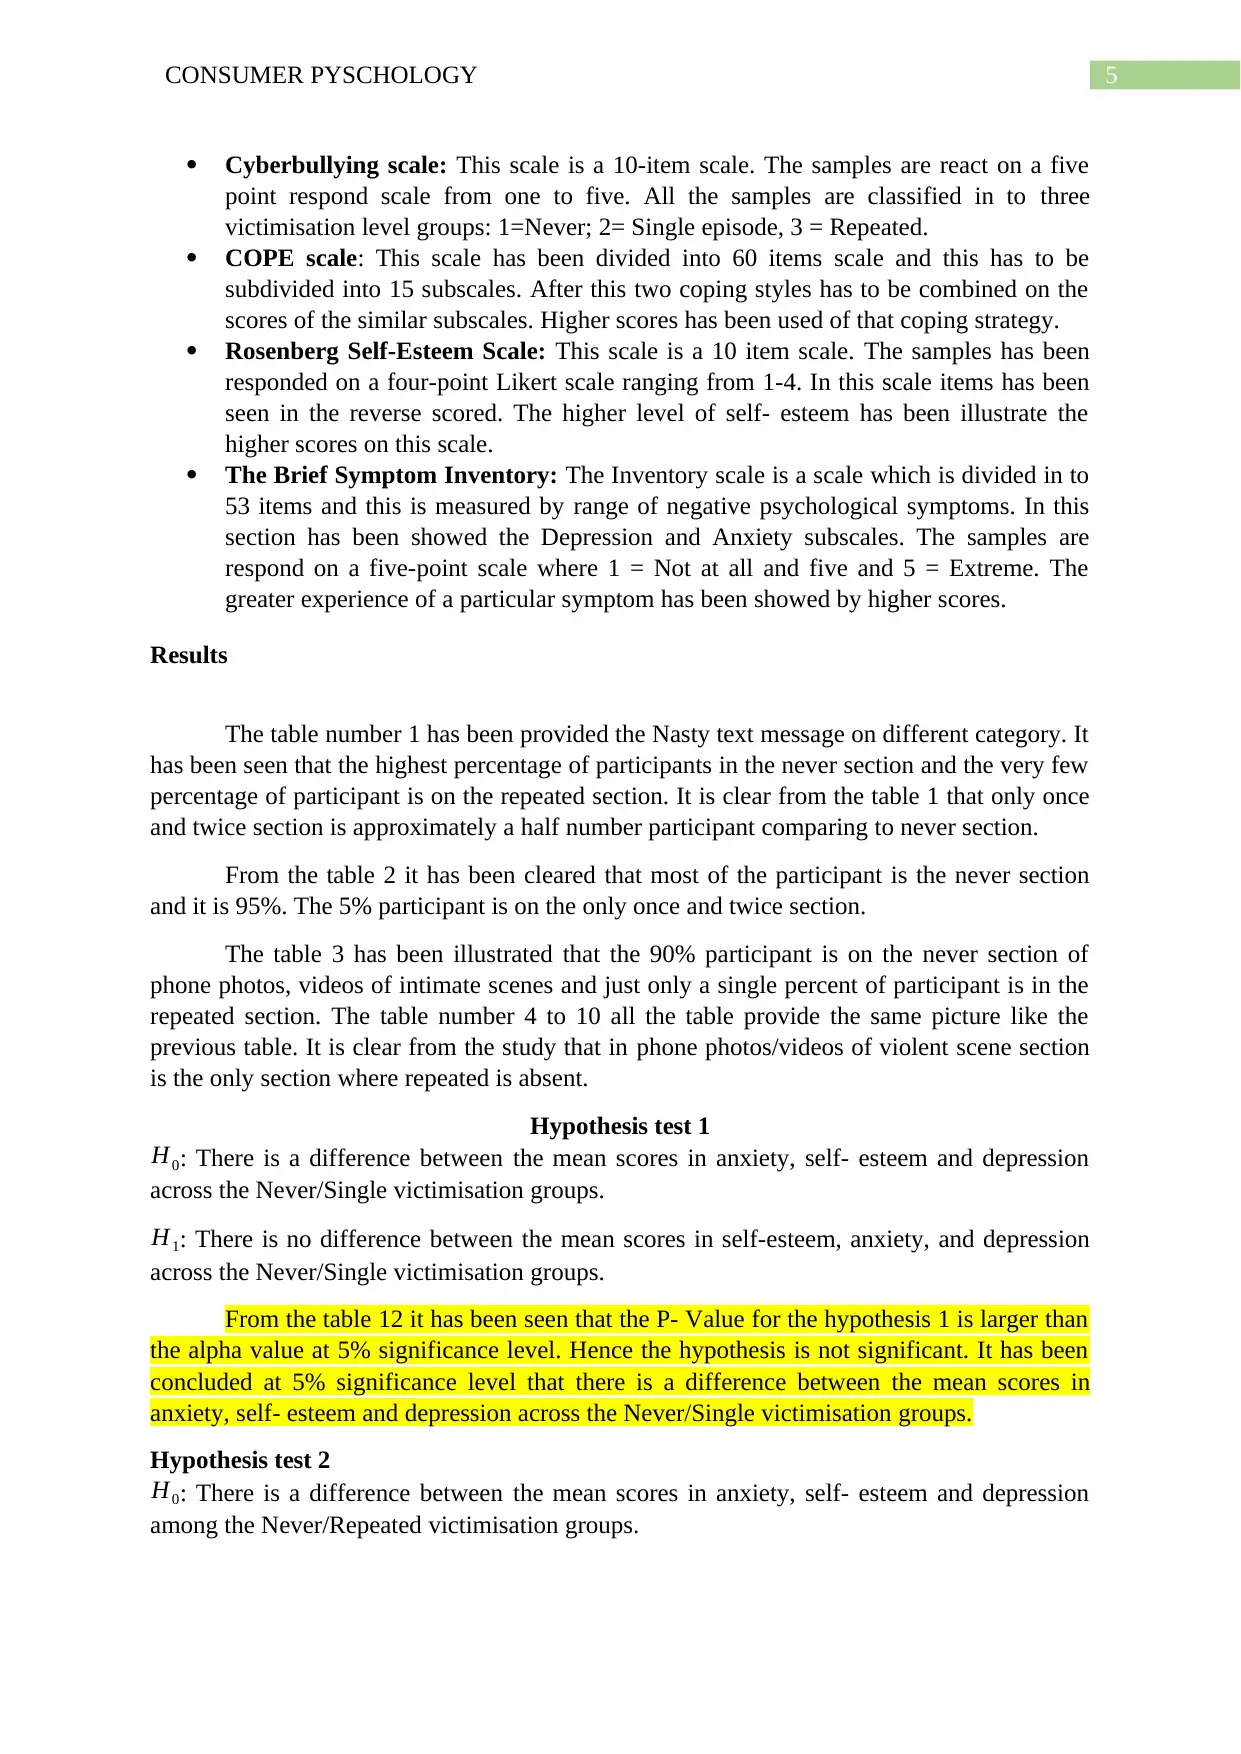
From the table 12 it has been seen that the P- Value for the hypothesis 1 is larger than
the alpha value at 5% significance level. Hence the hypothesis is not significant. It has been
concluded at 5% significance level that there is a difference between the mean scores in
anxiety, self- esteem and depression across the Never/Single victimisation groups.
Hypothesis test 2
H0: There is a difference between the mean scores in anxiety, self- esteem and depression
among the Never/Repeated victimisation groups.
Cyberbullying scale: This scale is a 10-item scale. The samples are react on a five
point respond scale from one to five. All the samples are classified in to three
victimisation level groups: 1=Never; 2= Single episode, 3 = Repeated.
COPE scale: This scale has been divided into 60 items scale and this has to be
subdivided into 15 subscales. After this two coping styles has to be combined on the
scores of the similar subscales. Higher scores has been used of that coping strategy.
Rosenberg Self-Esteem Scale: This scale is a 10 item scale. The samples has been
responded on a four-point Likert scale ranging from 1-4. In this scale items has been
seen in the reverse scored. The higher level of self- esteem has been illustrate the
higher scores on this scale.
The Brief Symptom Inventory: The Inventory scale is a scale which is divided in to
53 items and this is measured by range of negative psychological symptoms. In this
section has been showed the Depression and Anxiety subscales. The samples are
respond on a five-point scale where 1 = Not at all and five and 5 = Extreme. The
greater experience of a particular symptom has been showed by higher scores.
Results
The table number 1 has been provided the Nasty text message on different category. It
has been seen that the highest percentage of participants in the never section and the very few
percentage of participant is on the repeated section. It is clear from the table 1 that only once
and twice section is approximately a half number participant comparing to never section.
From the table 2 it has been cleared that most of the participant is the never section
and it is 95%. The 5% participant is on the only once and twice section.
The table 3 has been illustrated that the 90% participant is on the never section of
phone photos, videos of intimate scenes and just only a single percent of participant is in the
repeated section. The table number 4 to 10 all the table provide the same picture like the
previous table. It is clear from the study that in phone photos/videos of violent scene section
is the only section where repeated is absent.
Hypothesis test 1
H0: There is a difference between the mean scores in anxiety, self- esteem and depression
across the Never/Single victimisation groups.
H1: There is no difference between the mean scores in self-esteem, anxiety, and depression
across the Never/Single victimisation groups.
From the table 12 it has been seen that the P- Value for the hypothesis 1 is larger than
the alpha value at 5% significance level. Hence the hypothesis is not significant. It has been
concluded at 5% significance level that there is a difference between the mean scores in
anxiety, self- esteem and depression across the Never/Single victimisation groups.
Hypothesis test 2
H0: There is a difference between the mean scores in anxiety, self- esteem and depression
among the Never/Repeated victimisation groups.
⊘ This is a preview!⊘
Do you want full access?
Subscribe today to unlock all pages.
Trusted by 1+ million students worldwide
6CONSUMER PYSCHOLOGY
H1: There is no difference between the mean scores in anxiety, self- esteem and depression
among the Never/Repeated victimisation groups.
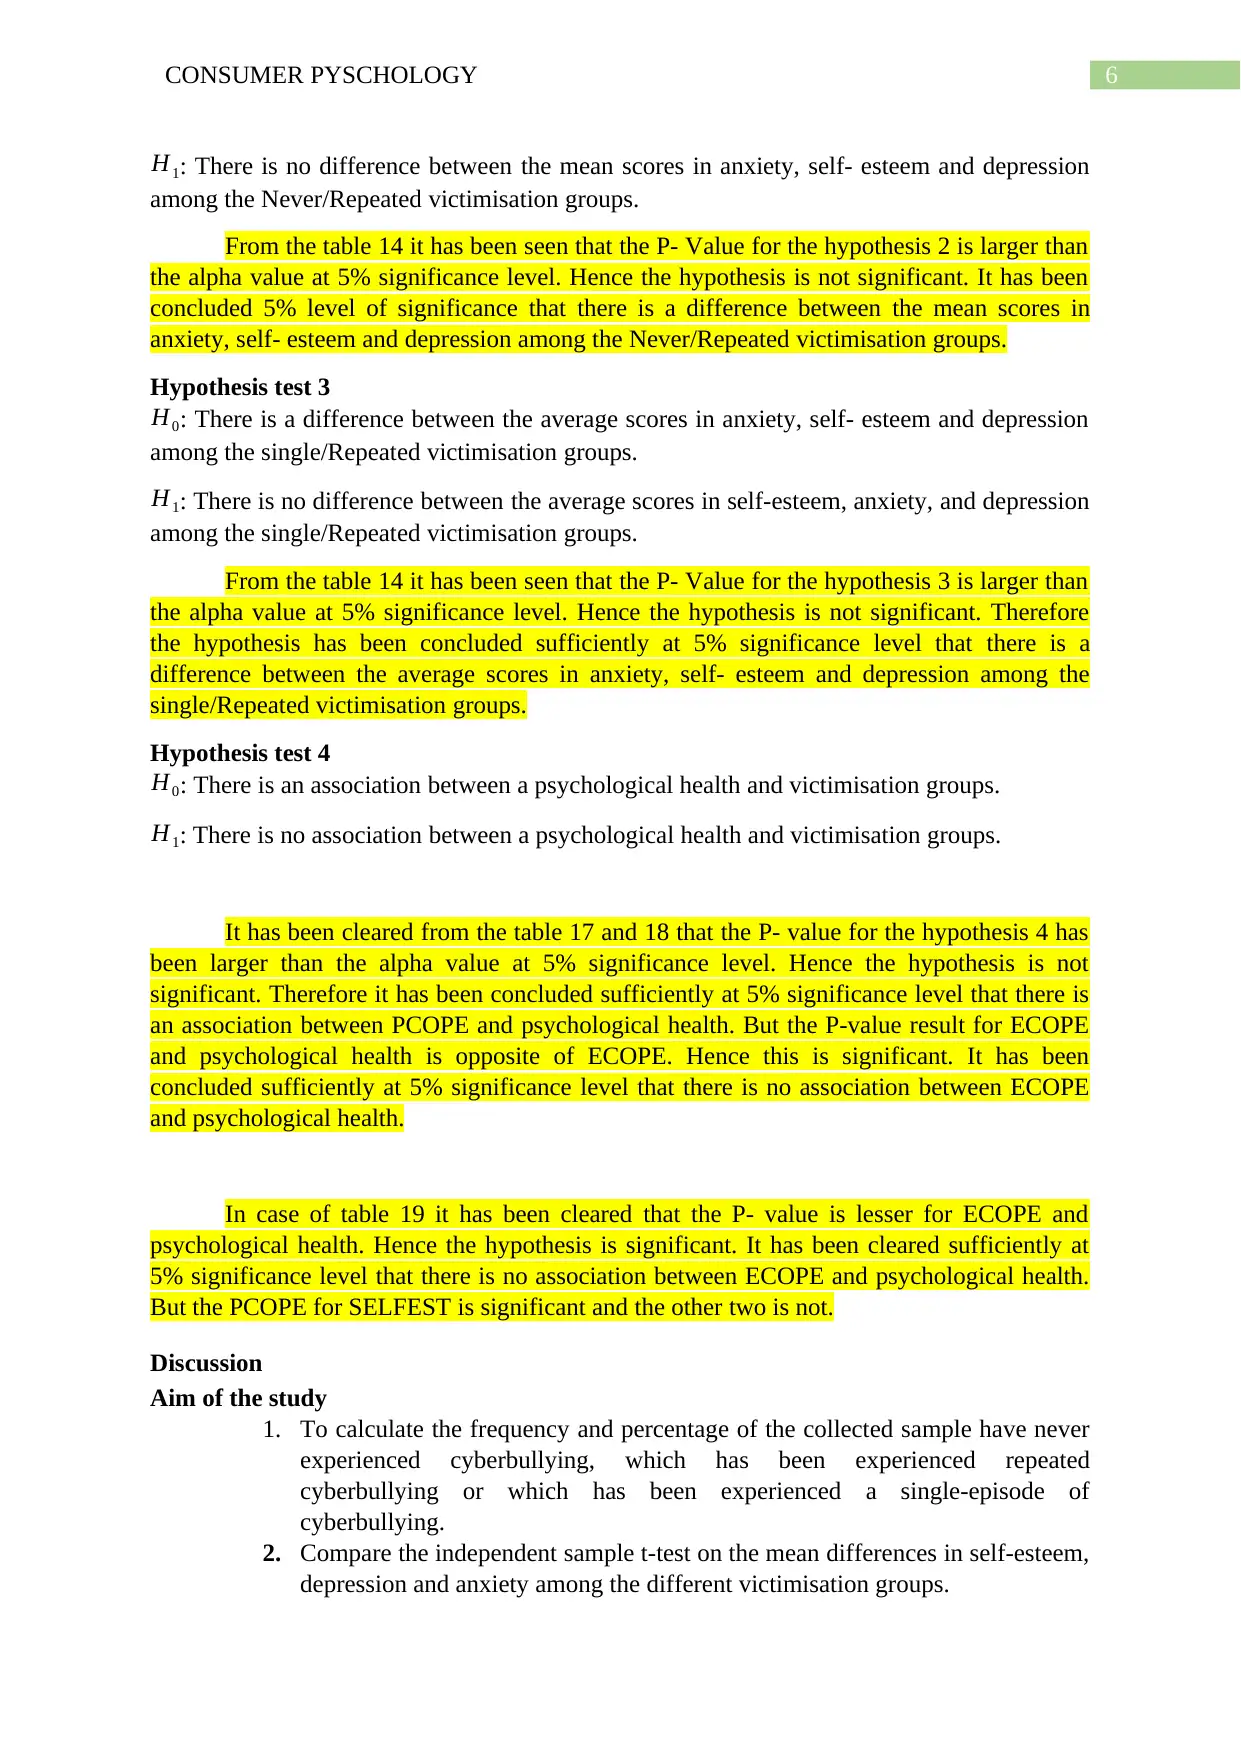
From the table 14 it has been seen that the P- Value for the hypothesis 2 is larger than
the alpha value at 5% significance level. Hence the hypothesis is not significant. It has been
concluded 5% level of significance that there is a difference between the mean scores in
anxiety, self- esteem and depression among the Never/Repeated victimisation groups.
Hypothesis test 3
H0: There is a difference between the average scores in anxiety, self- esteem and depression
among the single/Repeated victimisation groups.
H1: There is no difference between the average scores in self-esteem, anxiety, and depression
among the single/Repeated victimisation groups.
From the table 14 it has been seen that the P- Value for the hypothesis 3 is larger than
the alpha value at 5% significance level. Hence the hypothesis is not significant. Therefore
the hypothesis has been concluded sufficiently at 5% significance level that there is a
difference between the average scores in anxiety, self- esteem and depression among the
single/Repeated victimisation groups.
Hypothesis test 4
H0: There is an association between a psychological health and victimisation groups.
H1: There is no association between a psychological health and victimisation groups.
It has been cleared from the table 17 and 18 that the P- value for the hypothesis 4 has
been larger than the alpha value at 5% significance level. Hence the hypothesis is not
significant. Therefore it has been concluded sufficiently at 5% significance level that there is
an association between PCOPE and psychological health. But the P-value result for ECOPE
and psychological health is opposite of ECOPE. Hence this is significant. It has been
concluded sufficiently at 5% significance level that there is no association between ECOPE
and psychological health.
In case of table 19 it has been cleared that the P- value is lesser for ECOPE and
psychological health. Hence the hypothesis is significant. It has been cleared sufficiently at
5% significance level that there is no association between ECOPE and psychological health.
But the PCOPE for SELFEST is significant and the other two is not.
Discussion
Aim of the study
1. To calculate the frequency and percentage of the collected sample have never
experienced cyberbullying, which has been experienced repeated
cyberbullying or which has been experienced a single-episode of
cyberbullying.
2. Compare the independent sample t-test on the mean differences in self-esteem,
depression and anxiety among the different victimisation groups.
H1: There is no difference between the mean scores in anxiety, self- esteem and depression
among the Never/Repeated victimisation groups.
From the table 14 it has been seen that the P- Value for the hypothesis 2 is larger than
the alpha value at 5% significance level. Hence the hypothesis is not significant. It has been
concluded 5% level of significance that there is a difference between the mean scores in
anxiety, self- esteem and depression among the Never/Repeated victimisation groups.
Hypothesis test 3
H0: There is a difference between the average scores in anxiety, self- esteem and depression
among the single/Repeated victimisation groups.
H1: There is no difference between the average scores in self-esteem, anxiety, and depression
among the single/Repeated victimisation groups.
From the table 14 it has been seen that the P- Value for the hypothesis 3 is larger than
the alpha value at 5% significance level. Hence the hypothesis is not significant. Therefore
the hypothesis has been concluded sufficiently at 5% significance level that there is a
difference between the average scores in anxiety, self- esteem and depression among the
single/Repeated victimisation groups.
Hypothesis test 4
H0: There is an association between a psychological health and victimisation groups.
H1: There is no association between a psychological health and victimisation groups.
It has been cleared from the table 17 and 18 that the P- value for the hypothesis 4 has
been larger than the alpha value at 5% significance level. Hence the hypothesis is not
significant. Therefore it has been concluded sufficiently at 5% significance level that there is
an association between PCOPE and psychological health. But the P-value result for ECOPE
and psychological health is opposite of ECOPE. Hence this is significant. It has been
concluded sufficiently at 5% significance level that there is no association between ECOPE
and psychological health.
In case of table 19 it has been cleared that the P- value is lesser for ECOPE and
psychological health. Hence the hypothesis is significant. It has been cleared sufficiently at
5% significance level that there is no association between ECOPE and psychological health.
But the PCOPE for SELFEST is significant and the other two is not.
Discussion
Aim of the study
1. To calculate the frequency and percentage of the collected sample have never
experienced cyberbullying, which has been experienced repeated
cyberbullying or which has been experienced a single-episode of
cyberbullying.
2. Compare the independent sample t-test on the mean differences in self-esteem,
depression and anxiety among the different victimisation groups.
Paraphrase This Document
Need a fresh take? Get an instant paraphrase of this document with our AI Paraphraser
7CONSUMER PYSCHOLOGY
3. Determine the bivariate correlation and examine the association between
psychological health and victimisation groups.
There are 223 sample has been collected by questionnaire method, in which there are
54 males and 169 females. In this study the sample has been collected in different age group.
The mean age of the gender is 23.02 and the standard deviation is 4.574. The ranges of the
age is also determined. This range is the difference between maximum and minimum age.
Therefore the range is 22. Using SPSS the frequencies, descriptive statistics and different test
has been done. Different scale has been provided in this study like COPE scale, Rosenberg
Self-Esteem Scale, Cyberbullying scale and The Brief Symptom Inventory.
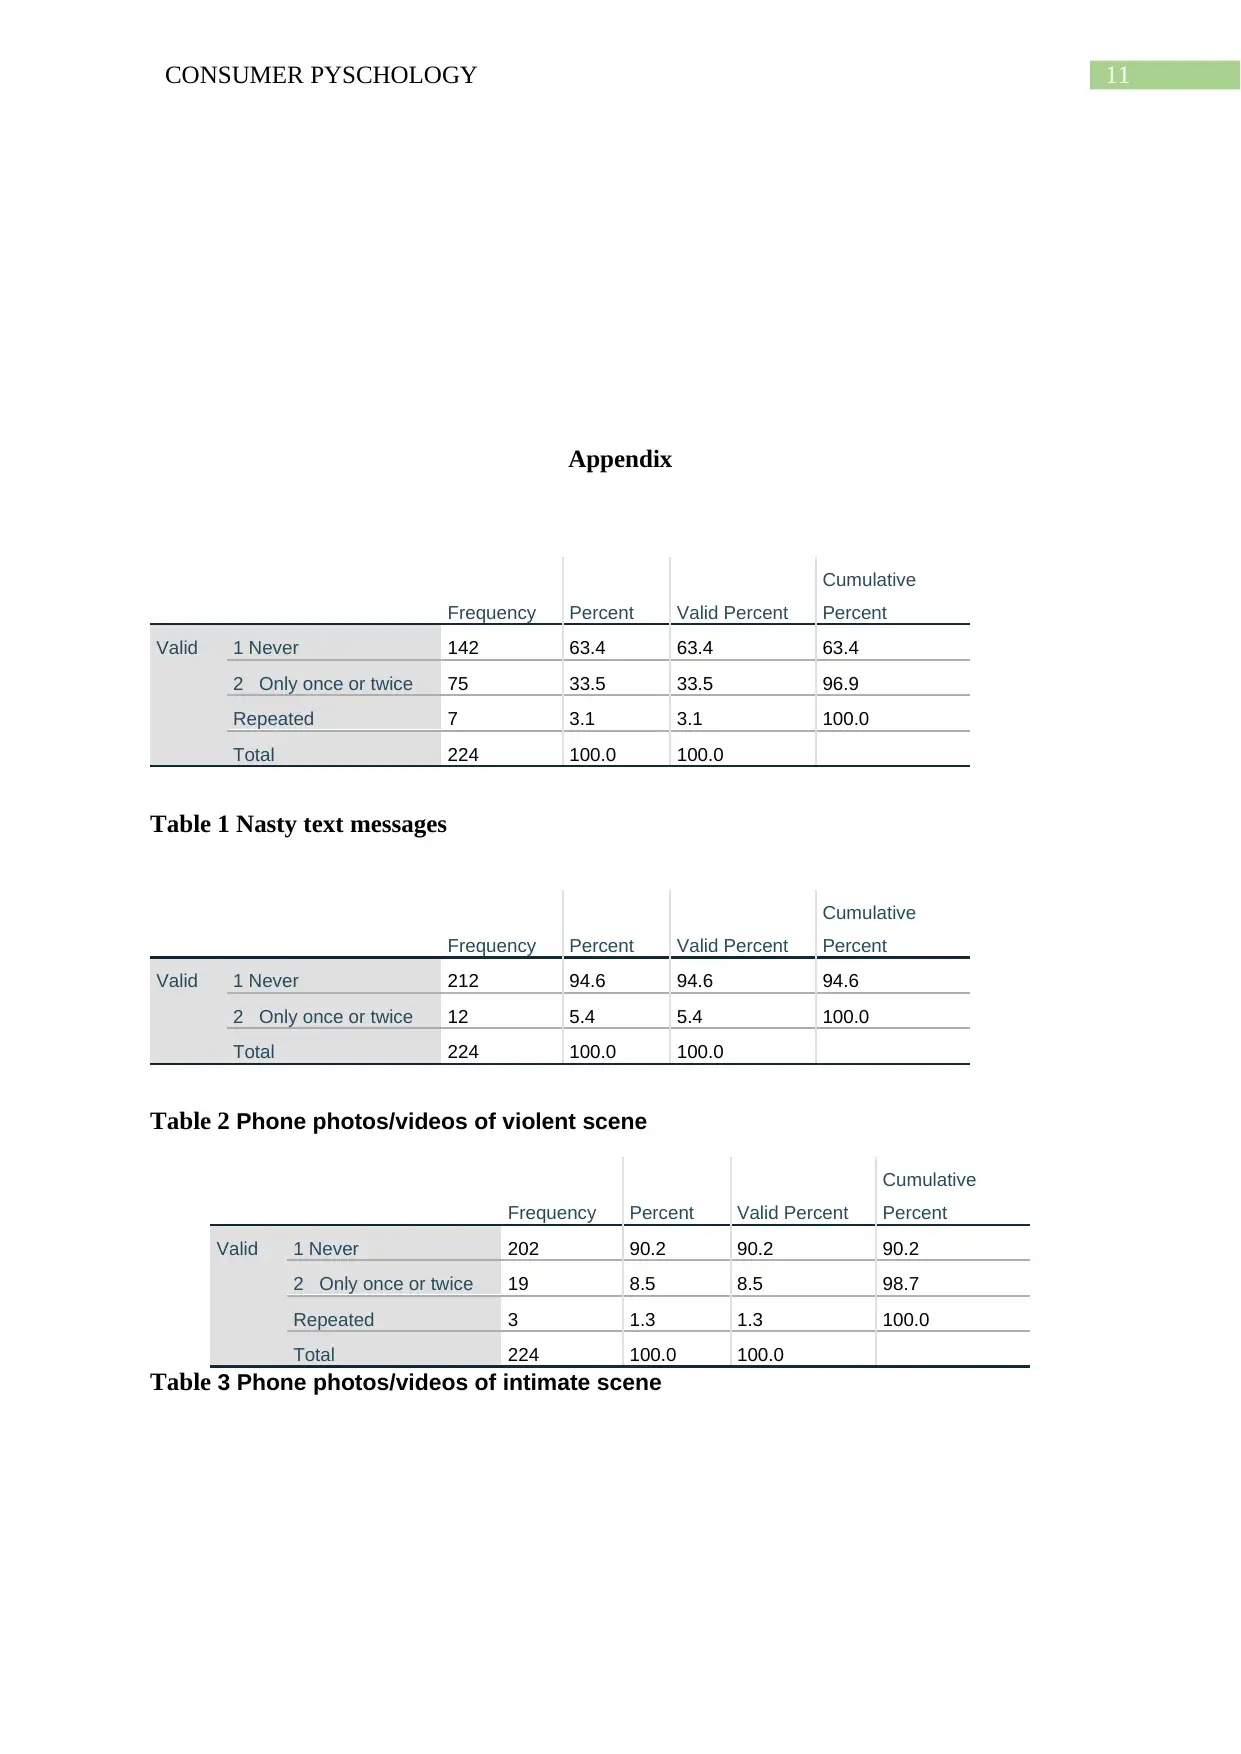
The table number 1 has been provided the Nasty text message on different category. It
has been seen that the highest percentage of participants in the never section and the very few
percentage of participant is on the repeated section. It is clear from the table 1 that only once
and twice section is approximately a half number participant comparing to never section.
From the table 2 it has been cleared that most of the participant is the never section
and it is 95%. The 5% participant is on the only once and twice section.
The table 3 has been illustrated that the 90% participant is on the never section of
phone photos, videos of intimate scenes and just only a single percent of participant is in the
repeated section. The table number 4 to 10 all the table provide the same picture like the
previous table. It is clear from the study that repeated absence has been seen on Phone
photos/videos of violent scene section.
From the hypothesis one it has been clear that there is a difference between the
average scores on anxiety, self-esteem and depression among the victimisation groups of
Never/Single. It means that self-esteem, anxiety and depression are different across the Never
and single. Simply the hypothesis or statement on the hypothesis one may not rejected. In the
hypothesis two it has been seen the similar picture like hypothesis one. That means the
statement may not be rejected. There is a difference between the mean scores in self-esteem,
anxiety, and depression across the Never/Repeated victimisation groups. Similarly in the
hypothesis three also may not be rejected. That means there is a difference between the mean
scores in self-esteem, anxiety, and depression across the single/Repeated victimisation
groups. Hence it has been concluded that there is a difference between the average scores in
anxiety, self-esteem, and depression across the victimisation groups of Never/ single/
repeated.
The correlation between psychological health and victimisation groups like single and
never provide a good relationship between the variable. The statement of the test has been
accepted. There is a positive relationship between PCOPE and SELFEST, PCOPE and
ANXIETY but there is a negative correlation between PCOPE and DEPRESS. In case of
ECOPE and SELFEST provide a negative relationship but with the other two provide a
positive relationship. The test has a sufficient evidence at 5% level of significance to
conclude that there is an association between PCOPE and psychological health and there is
no association between ECOPE and psychological health. Similarly the correlation between
psychological health and victimisation groups repeated provide a good relationship between
the variable. The relationship between PCOPE and SELFEST is positive but the relation
between PCOPE and ANXIETY, DEPRESS is negative. In case of ECOPE with SELFEST
3. Determine the bivariate correlation and examine the association between
psychological health and victimisation groups.
There are 223 sample has been collected by questionnaire method, in which there are
54 males and 169 females. In this study the sample has been collected in different age group.
The mean age of the gender is 23.02 and the standard deviation is 4.574. The ranges of the
age is also determined. This range is the difference between maximum and minimum age.
Therefore the range is 22. Using SPSS the frequencies, descriptive statistics and different test
has been done. Different scale has been provided in this study like COPE scale, Rosenberg
Self-Esteem Scale, Cyberbullying scale and The Brief Symptom Inventory.
The table number 1 has been provided the Nasty text message on different category. It
has been seen that the highest percentage of participants in the never section and the very few
percentage of participant is on the repeated section. It is clear from the table 1 that only once
and twice section is approximately a half number participant comparing to never section.
From the table 2 it has been cleared that most of the participant is the never section
and it is 95%. The 5% participant is on the only once and twice section.
The table 3 has been illustrated that the 90% participant is on the never section of
phone photos, videos of intimate scenes and just only a single percent of participant is in the
repeated section. The table number 4 to 10 all the table provide the same picture like the
previous table. It is clear from the study that repeated absence has been seen on Phone
photos/videos of violent scene section.
From the hypothesis one it has been clear that there is a difference between the
average scores on anxiety, self-esteem and depression among the victimisation groups of
Never/Single. It means that self-esteem, anxiety and depression are different across the Never
and single. Simply the hypothesis or statement on the hypothesis one may not rejected. In the
hypothesis two it has been seen the similar picture like hypothesis one. That means the
statement may not be rejected. There is a difference between the mean scores in self-esteem,
anxiety, and depression across the Never/Repeated victimisation groups. Similarly in the
hypothesis three also may not be rejected. That means there is a difference between the mean
scores in self-esteem, anxiety, and depression across the single/Repeated victimisation
groups. Hence it has been concluded that there is a difference between the average scores in
anxiety, self-esteem, and depression across the victimisation groups of Never/ single/
repeated.
The correlation between psychological health and victimisation groups like single and
never provide a good relationship between the variable. The statement of the test has been
accepted. There is a positive relationship between PCOPE and SELFEST, PCOPE and
ANXIETY but there is a negative correlation between PCOPE and DEPRESS. In case of
ECOPE and SELFEST provide a negative relationship but with the other two provide a
positive relationship. The test has a sufficient evidence at 5% level of significance to
conclude that there is an association between PCOPE and psychological health and there is
no association between ECOPE and psychological health. Similarly the correlation between
psychological health and victimisation groups repeated provide a good relationship between
the variable. The relationship between PCOPE and SELFEST is positive but the relation
between PCOPE and ANXIETY, DEPRESS is negative. In case of ECOPE with SELFEST
8CONSUMER PYSCHOLOGY
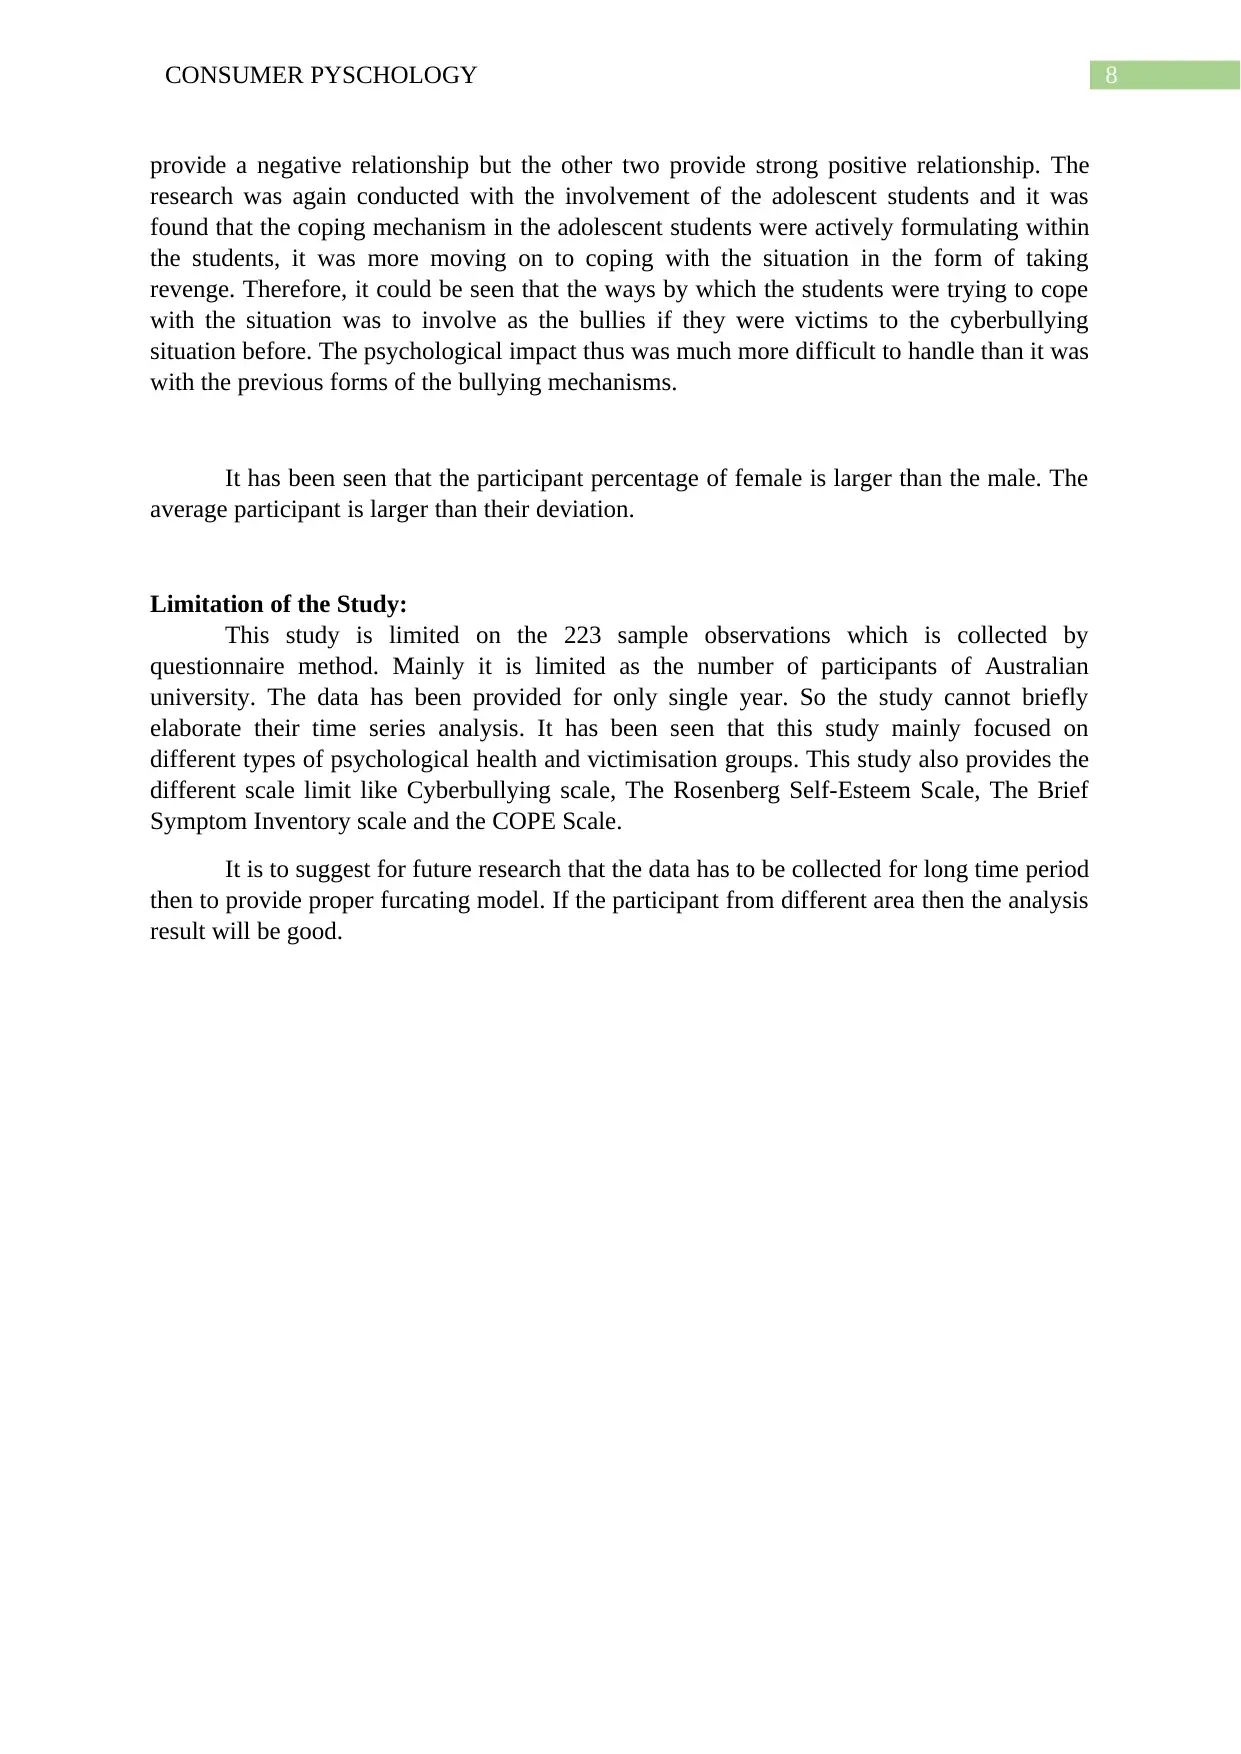
provide a negative relationship but the other two provide strong positive relationship. The
research was again conducted with the involvement of the adolescent students and it was
found that the coping mechanism in the adolescent students were actively formulating within
the students, it was more moving on to coping with the situation in the form of taking
revenge. Therefore, it could be seen that the ways by which the students were trying to cope
with the situation was to involve as the bullies if they were victims to the cyberbullying
situation before. The psychological impact thus was much more difficult to handle than it was
with the previous forms of the bullying mechanisms.
It has been seen that the participant percentage of female is larger than the male. The
average participant is larger than their deviation.
Limitation of the Study:
This study is limited on the 223 sample observations which is collected by
questionnaire method. Mainly it is limited as the number of participants of Australian
university. The data has been provided for only single year. So the study cannot briefly
elaborate their time series analysis. It has been seen that this study mainly focused on
different types of psychological health and victimisation groups. This study also provides the
different scale limit like Cyberbullying scale, The Rosenberg Self-Esteem Scale, The Brief
Symptom Inventory scale and the COPE Scale.
It is to suggest for future research that the data has to be collected for long time period
then to provide proper furcating model. If the participant from different area then the analysis
result will be good.
⊘ This is a preview!⊘
Do you want full access?
Subscribe today to unlock all pages.
Trusted by 1+ million students worldwide
9CONSUMER PYSCHOLOGY
Conclusion
The study on consumer psychology is a common part of childhood that are regarded
as pointless and mean-spirited. However, it is faced by numerous people going through their
childhood. It has been found that mostly the students who were associated with experiencing
the effects of cyberbullying posed as the victims in the scenario and also as an offender was
reflected to have a much lower self-esteem than the others. In this study also provides the
correlation and hypothetical test on psychological health and victimisation groups of the
participants of Australian university
Paraphrase This Document
Need a fresh take? Get an instant paraphrase of this document with our AI Paraphraser
10CONSUMER PYSCHOLOGY
References
Alipan, A., Skues, J. L., & Theiler, S. (2018). “They Will Find Another Way to Hurt You”:
Emerging Adults’ Perceptions of Coping With Cyberbullying. Emerging Adulthood,
2167696818816896.
Lee, C., & Shin, N. (2017). Prevalence of cyberbullying and predictors of cyberbullying
perpetration among Korean adolescents. Computers in Human Behavior, 68, 352-358.
McLoughlin, L. T. (2019). Understanding and measuring coping with cyberbullying in
adolescents: exploratory factor analysis of the brief coping orientation to problems
experienced inventory. Current Psychology, 1-11.
Palermiti, A. L., Servidio, R., Bartolo, M. G., & Costabile, A. (2017). Cyberbullying and self-
esteem: An Italian study. Computers in Human Behavior, 69, 136-141.
11CONSUMER PYSCHOLOGY
Appendix
Frequency Percent Valid Percent
Cumulative
Percent
Valid 1 Never 142 63.4 63.4 63.4
2 Only once or twice 75 33.5 33.5 96.9
Repeated 7 3.1 3.1 100.0
Total 224 100.0 100.0
Table 1 Nasty text messages
Frequency Percent Valid Percent
Cumulative
Percent
Valid 1 Never 212 94.6 94.6 94.6
2 Only once or twice 12 5.4 5.4 100.0
Total 224 100.0 100.0
Table 2 Phone photos/videos of violent scene
Table 3 Phone photos/videos of intimate scene
Frequency Percent Valid Percent
Cumulative
Percent
Valid 1 Never 202 90.2 90.2 90.2
2 Only once or twice 19 8.5 8.5 98.7
Repeated 3 1.3 1.3 100.0
Total 224 100.0 100.0
⊘ This is a preview!⊘
Do you want full access?
Subscribe today to unlock all pages.
Trusted by 1+ million students worldwide
1 out of 19
Related Documents


Your All-in-One AI-Powered Toolkit for Academic Success.
+13062052269
info@desklib.com
Available 24*7 on WhatsApp / Email
![[object Object]](/_next/static/media/star-bottom.7253800d.svg)
Unlock your academic potential
Copyright © 2020–2026 A2Z Services. All Rights Reserved. Developed and managed by ZUCOL.