Comprehensive Financial Analysis of Dabur India Limited (2018-2019)

Verified

Added on  2022/08/14

|15
|2738
|30
Report
AI Summary
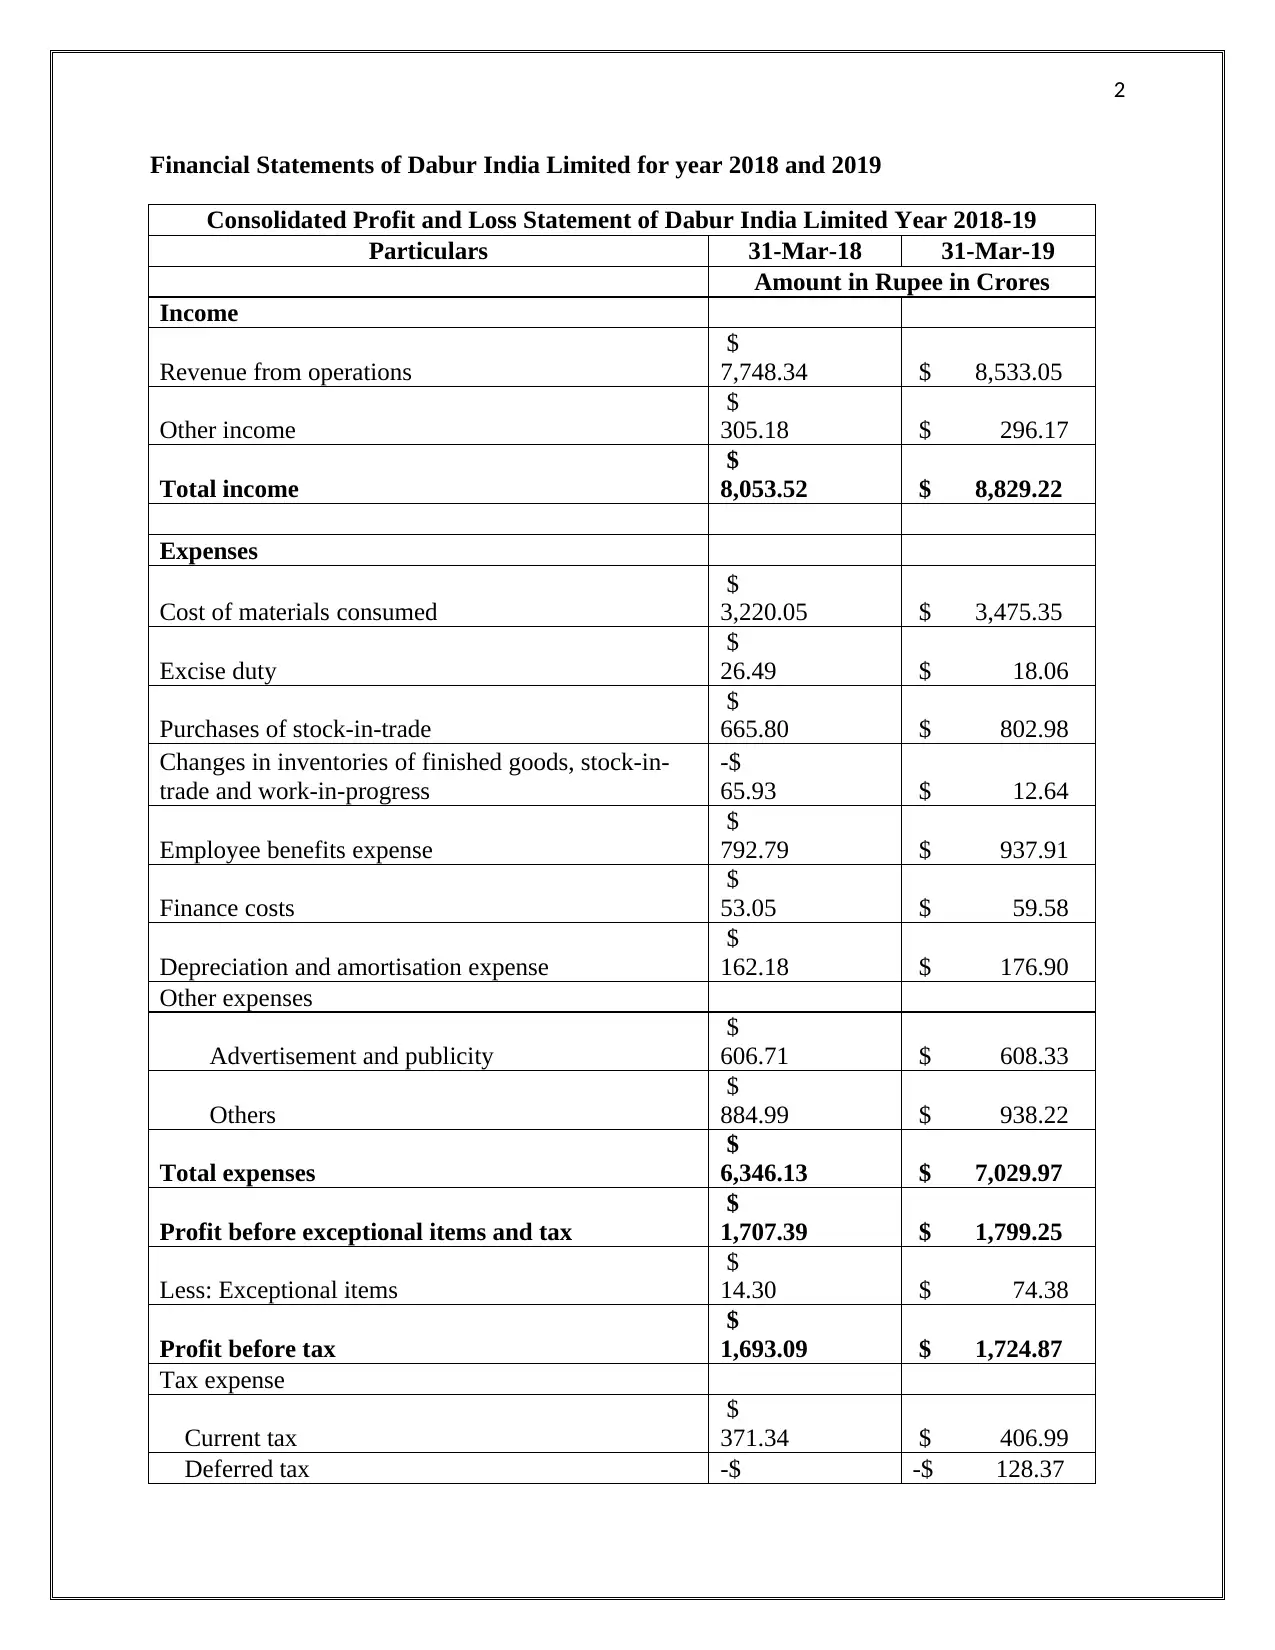
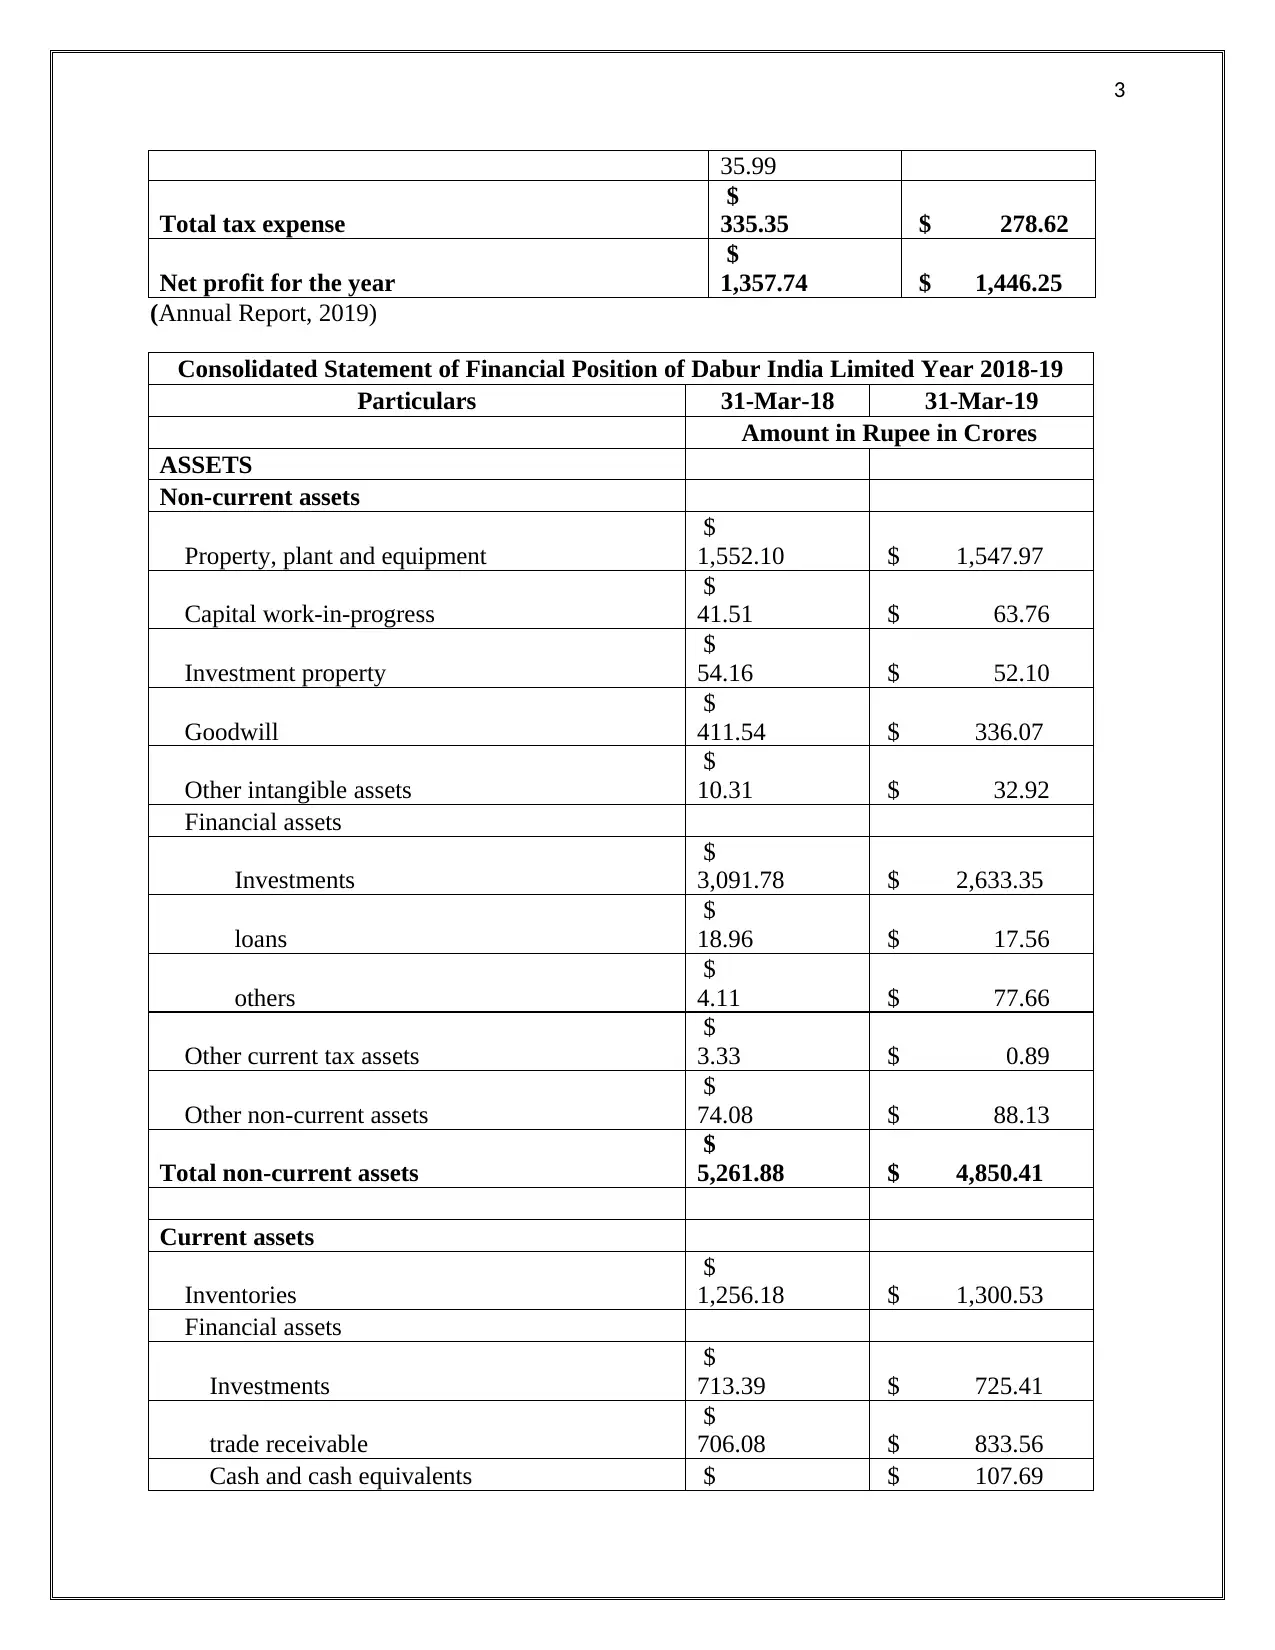
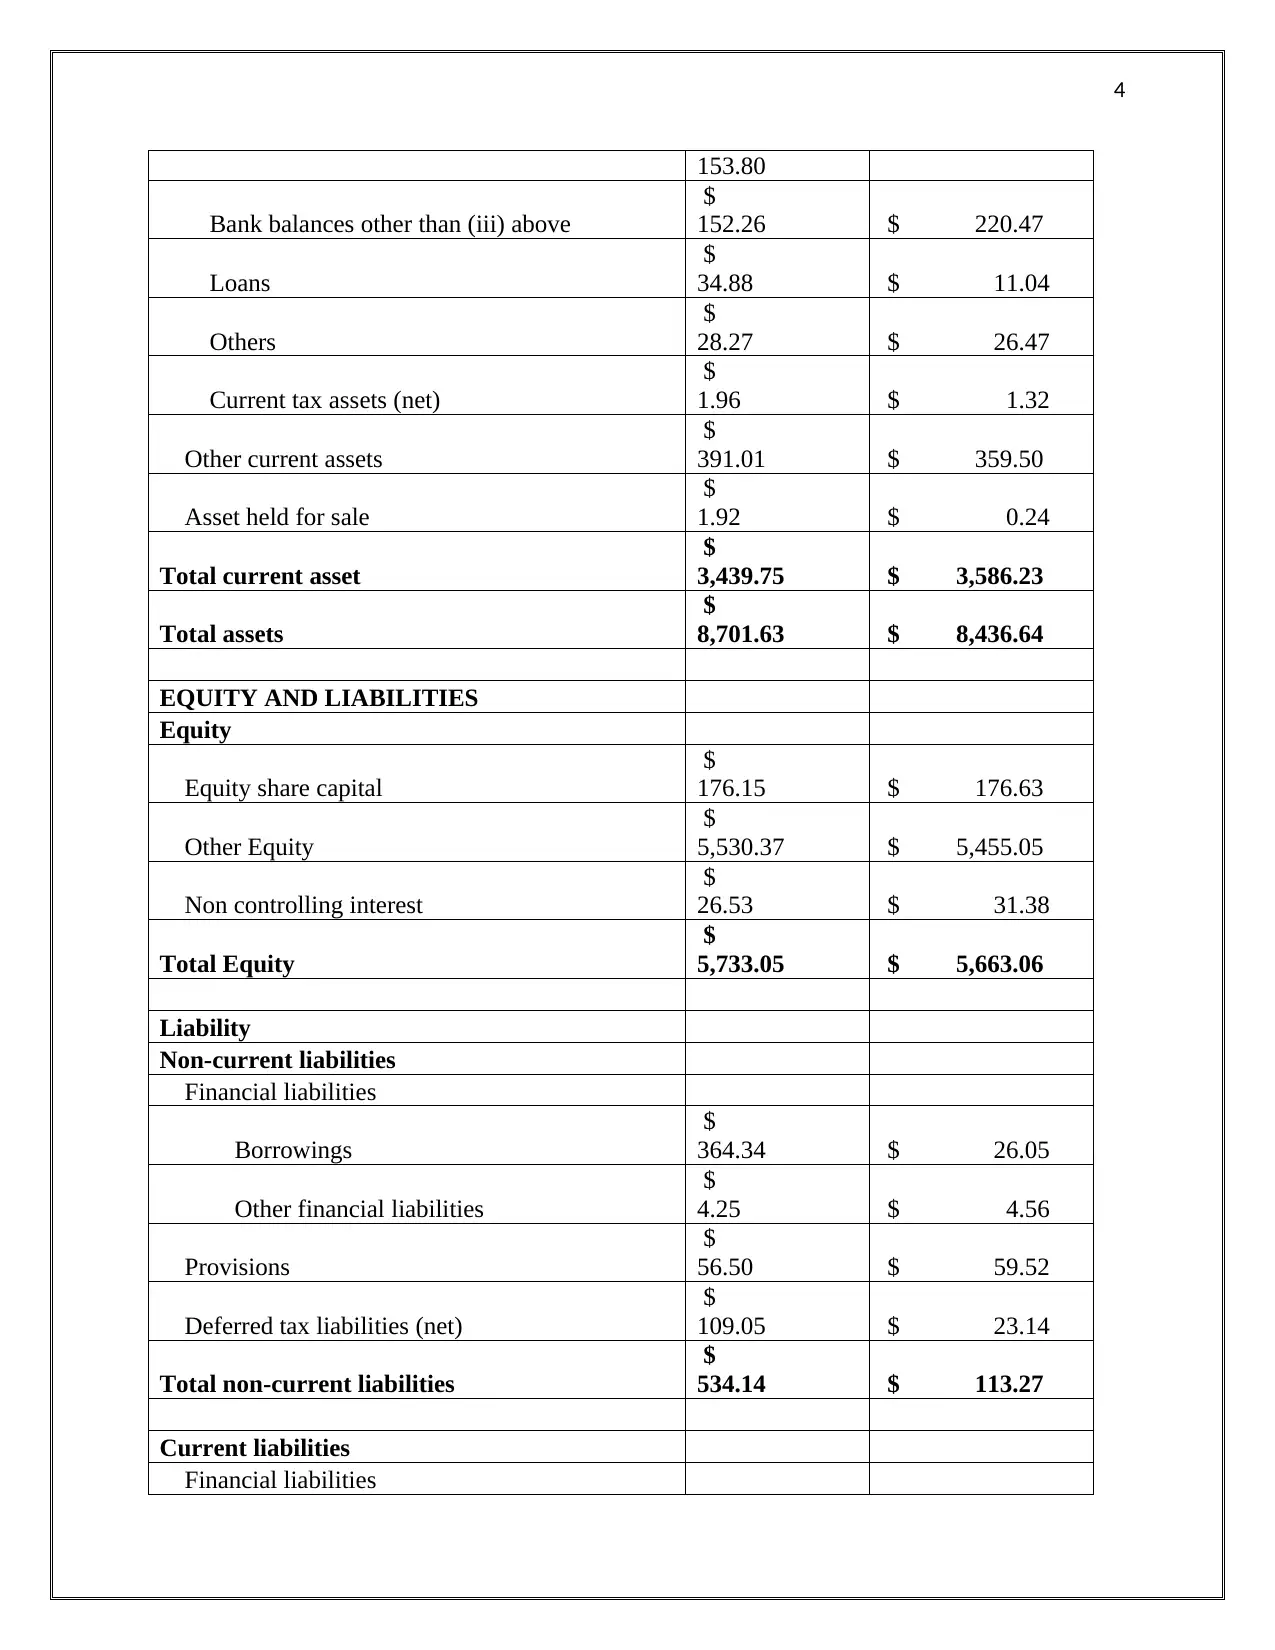
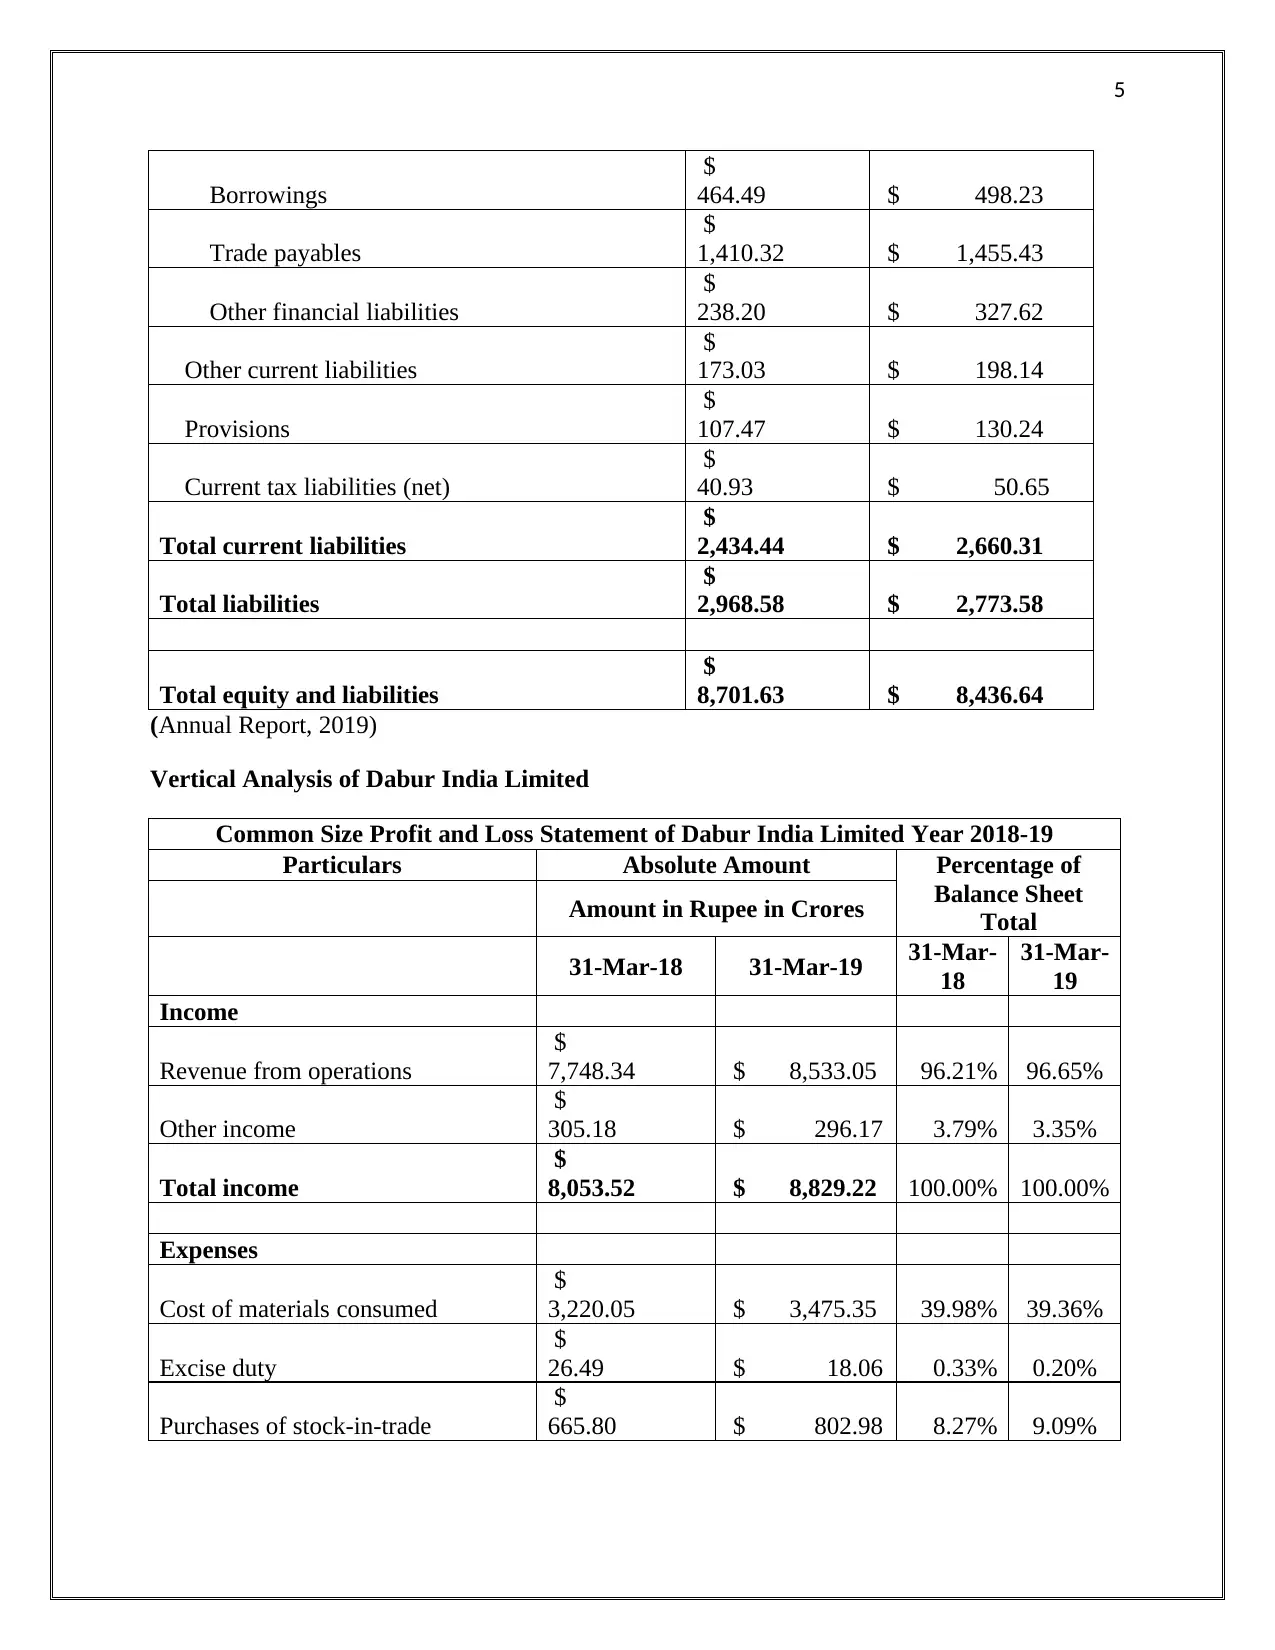
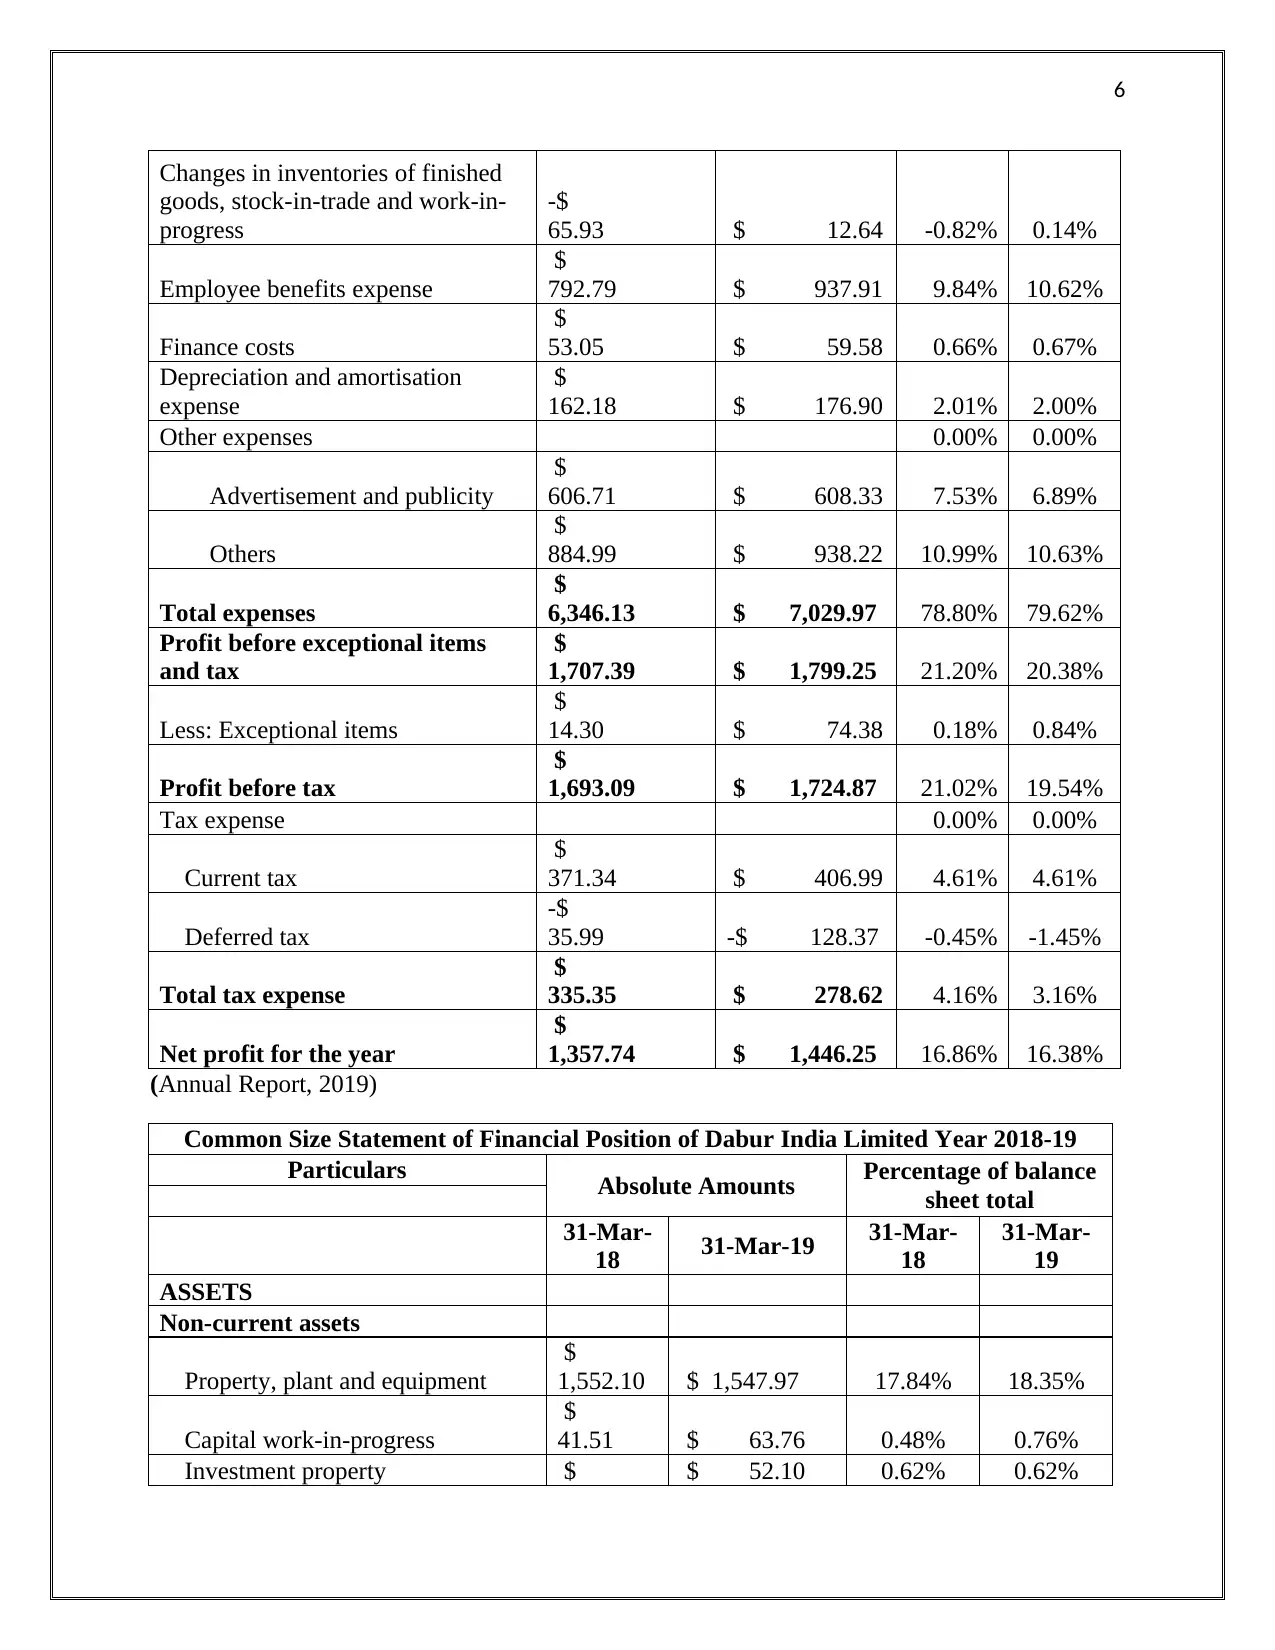
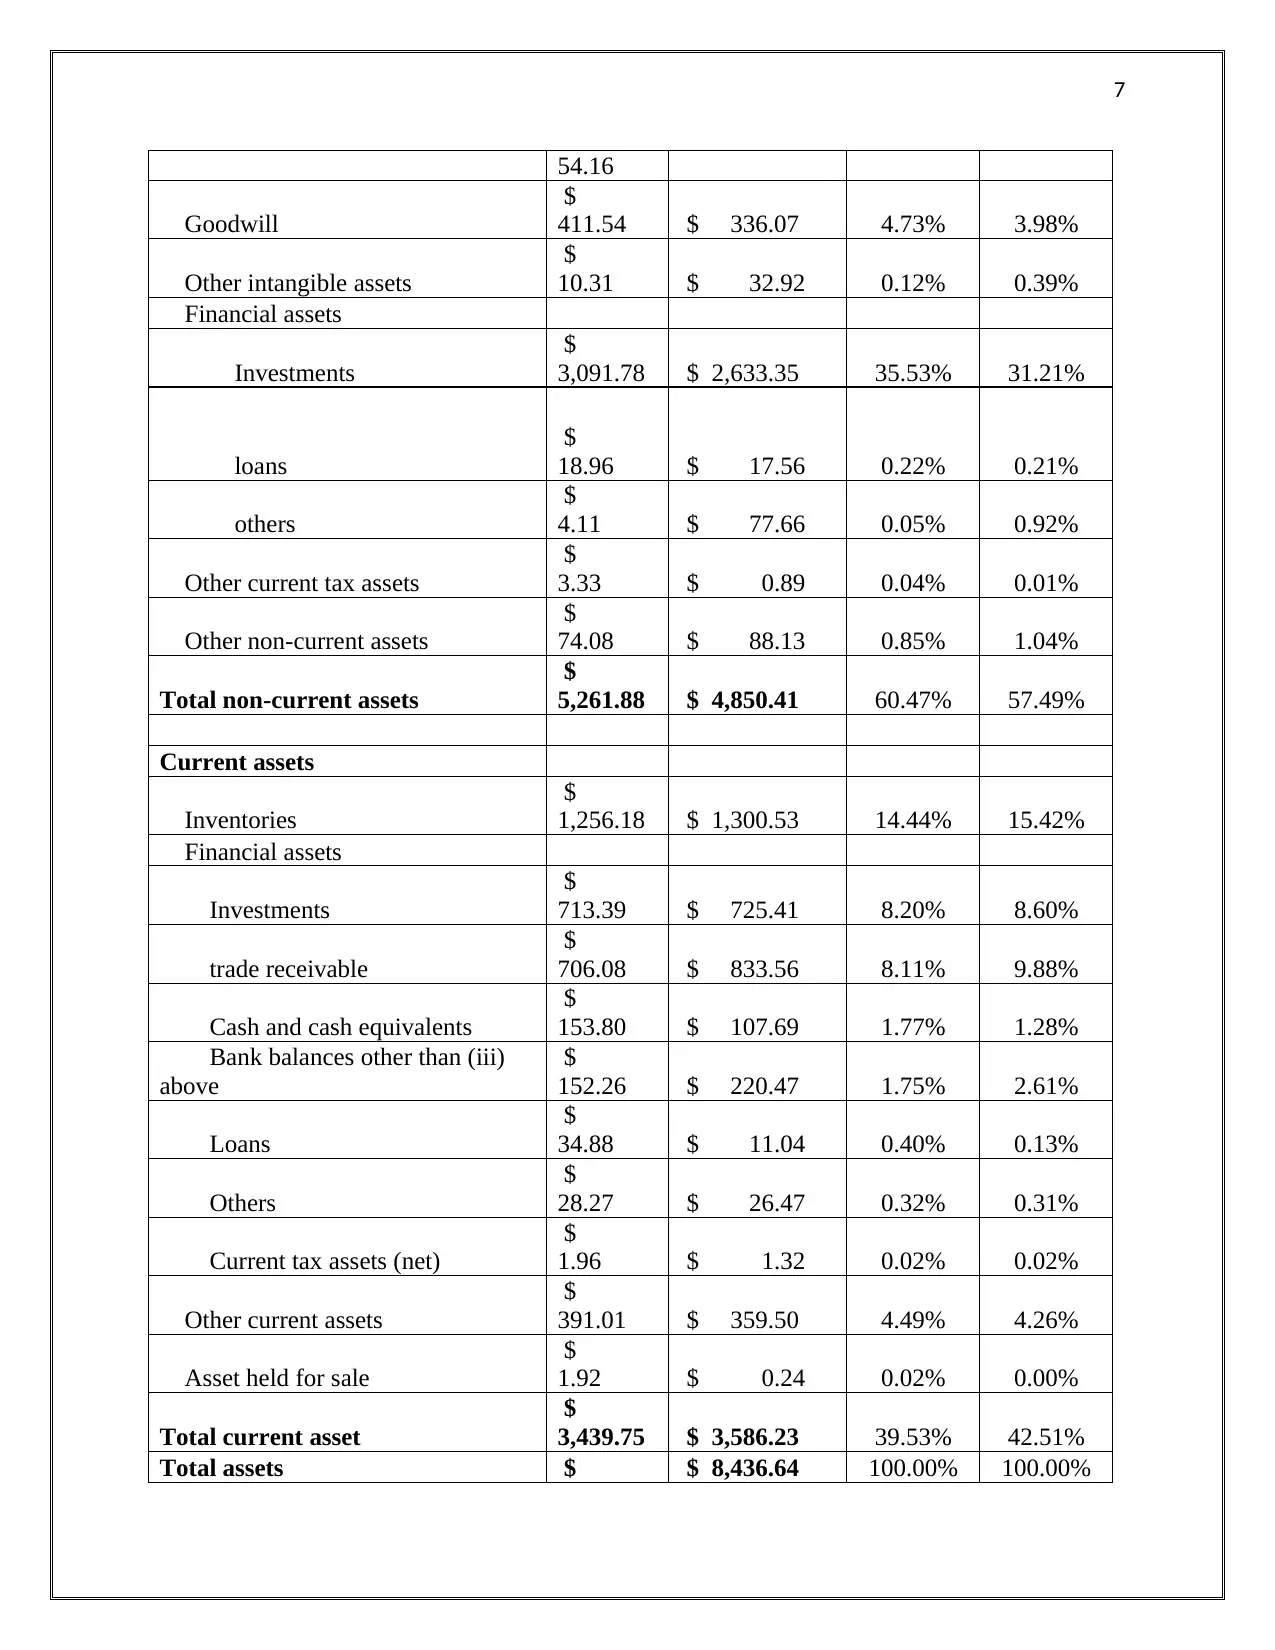
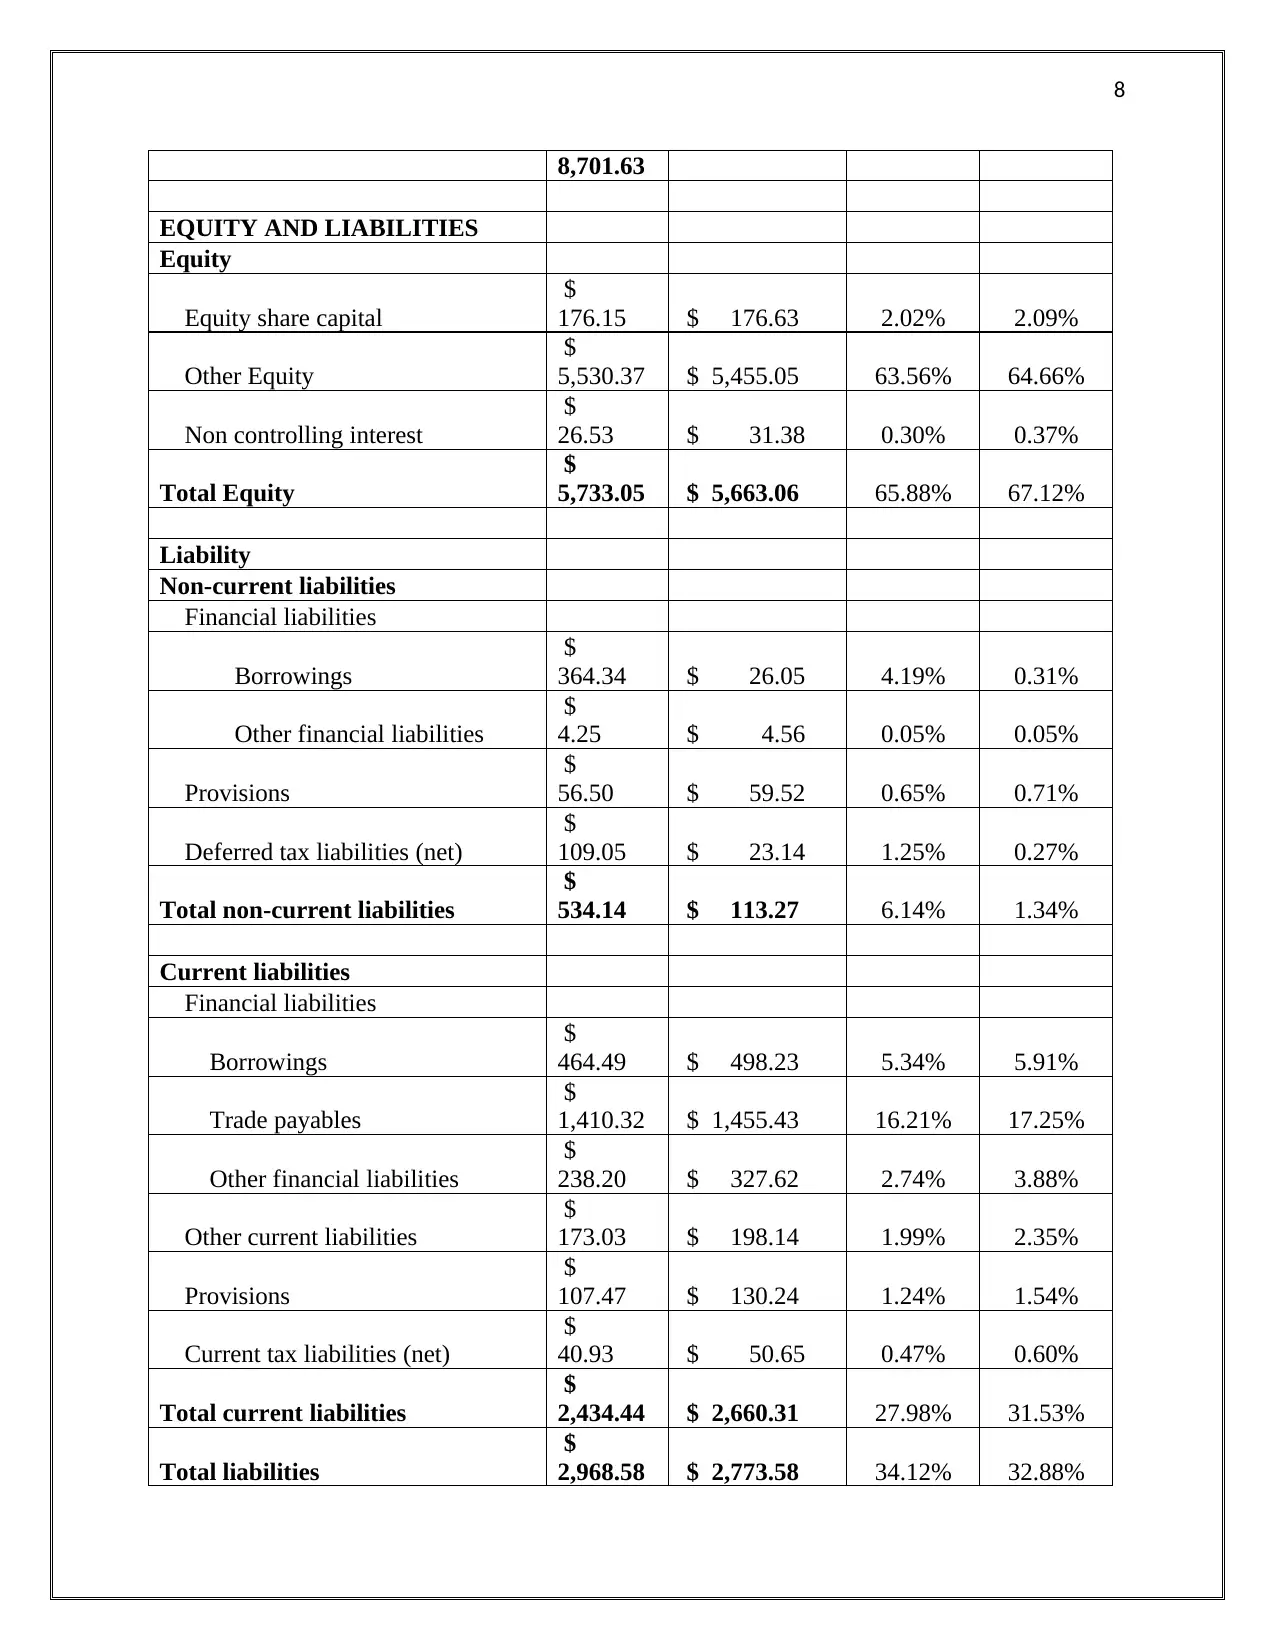
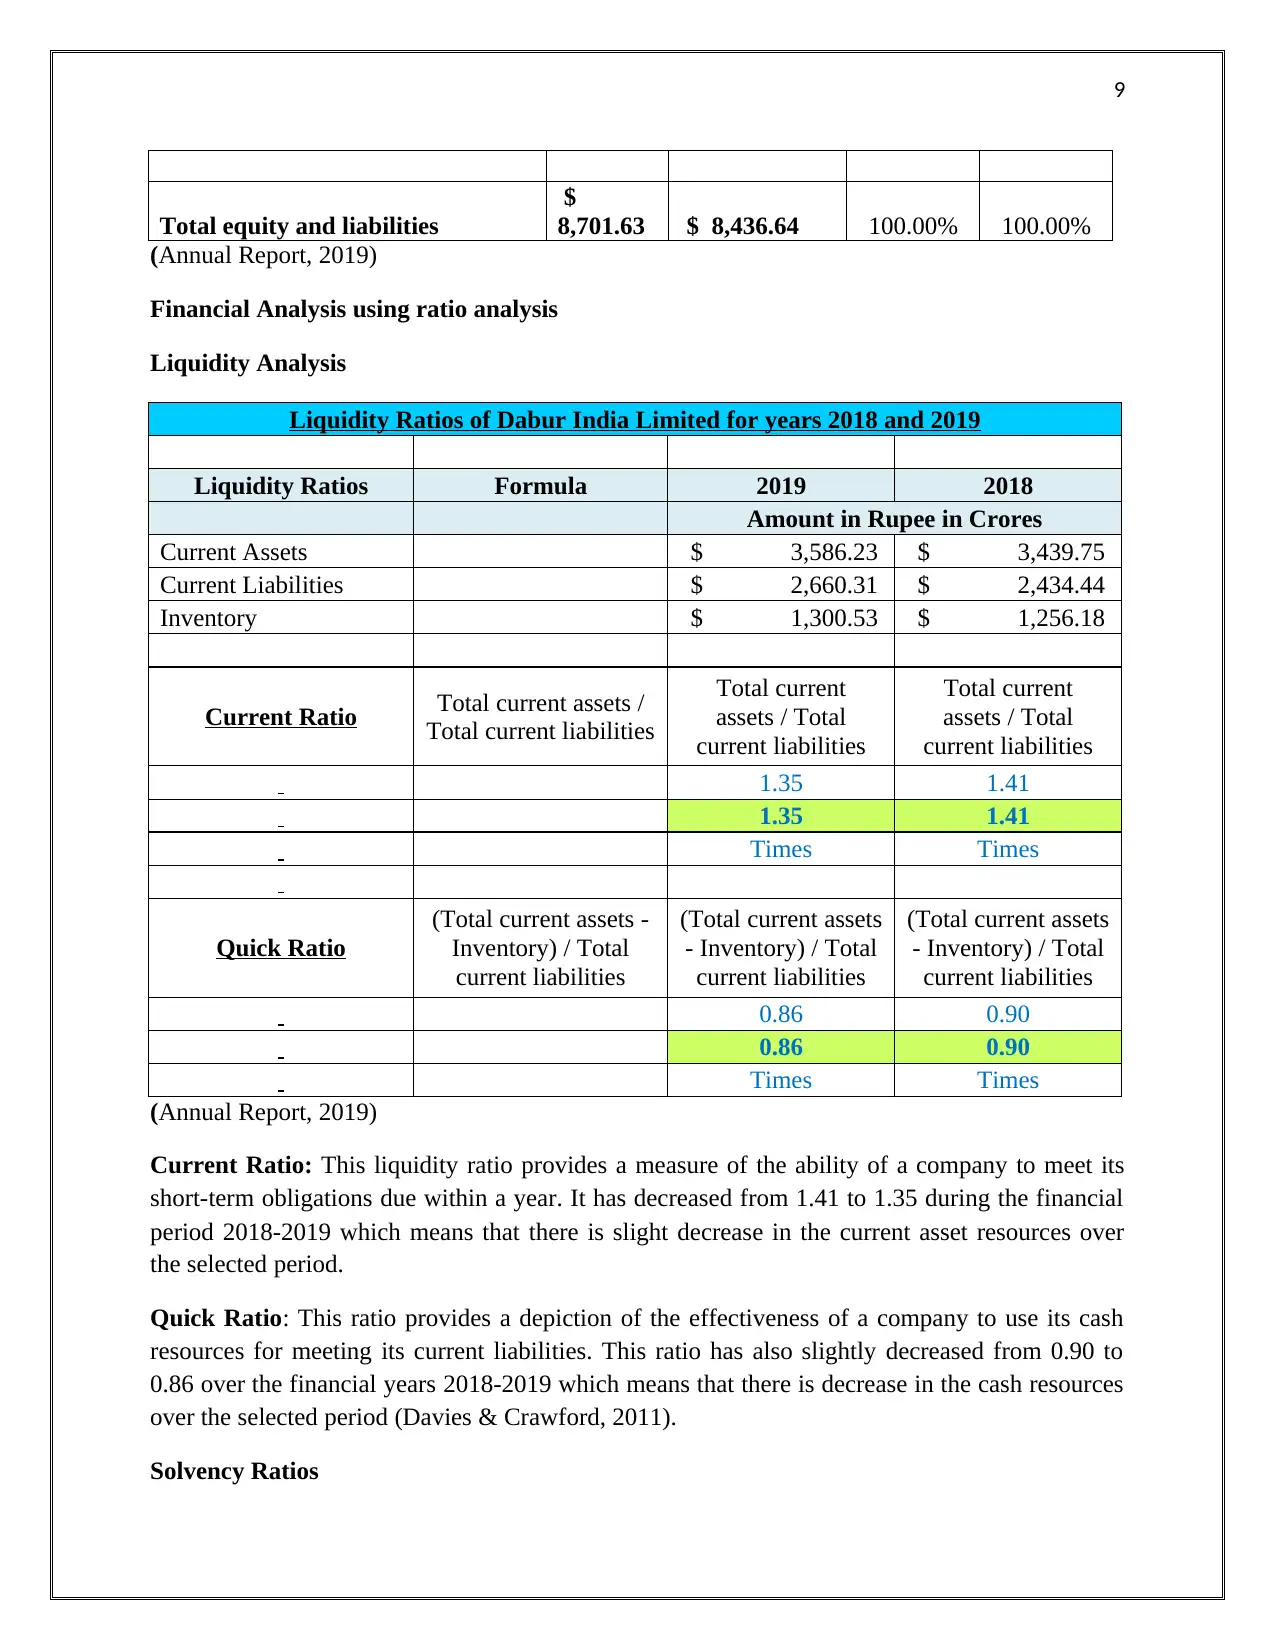
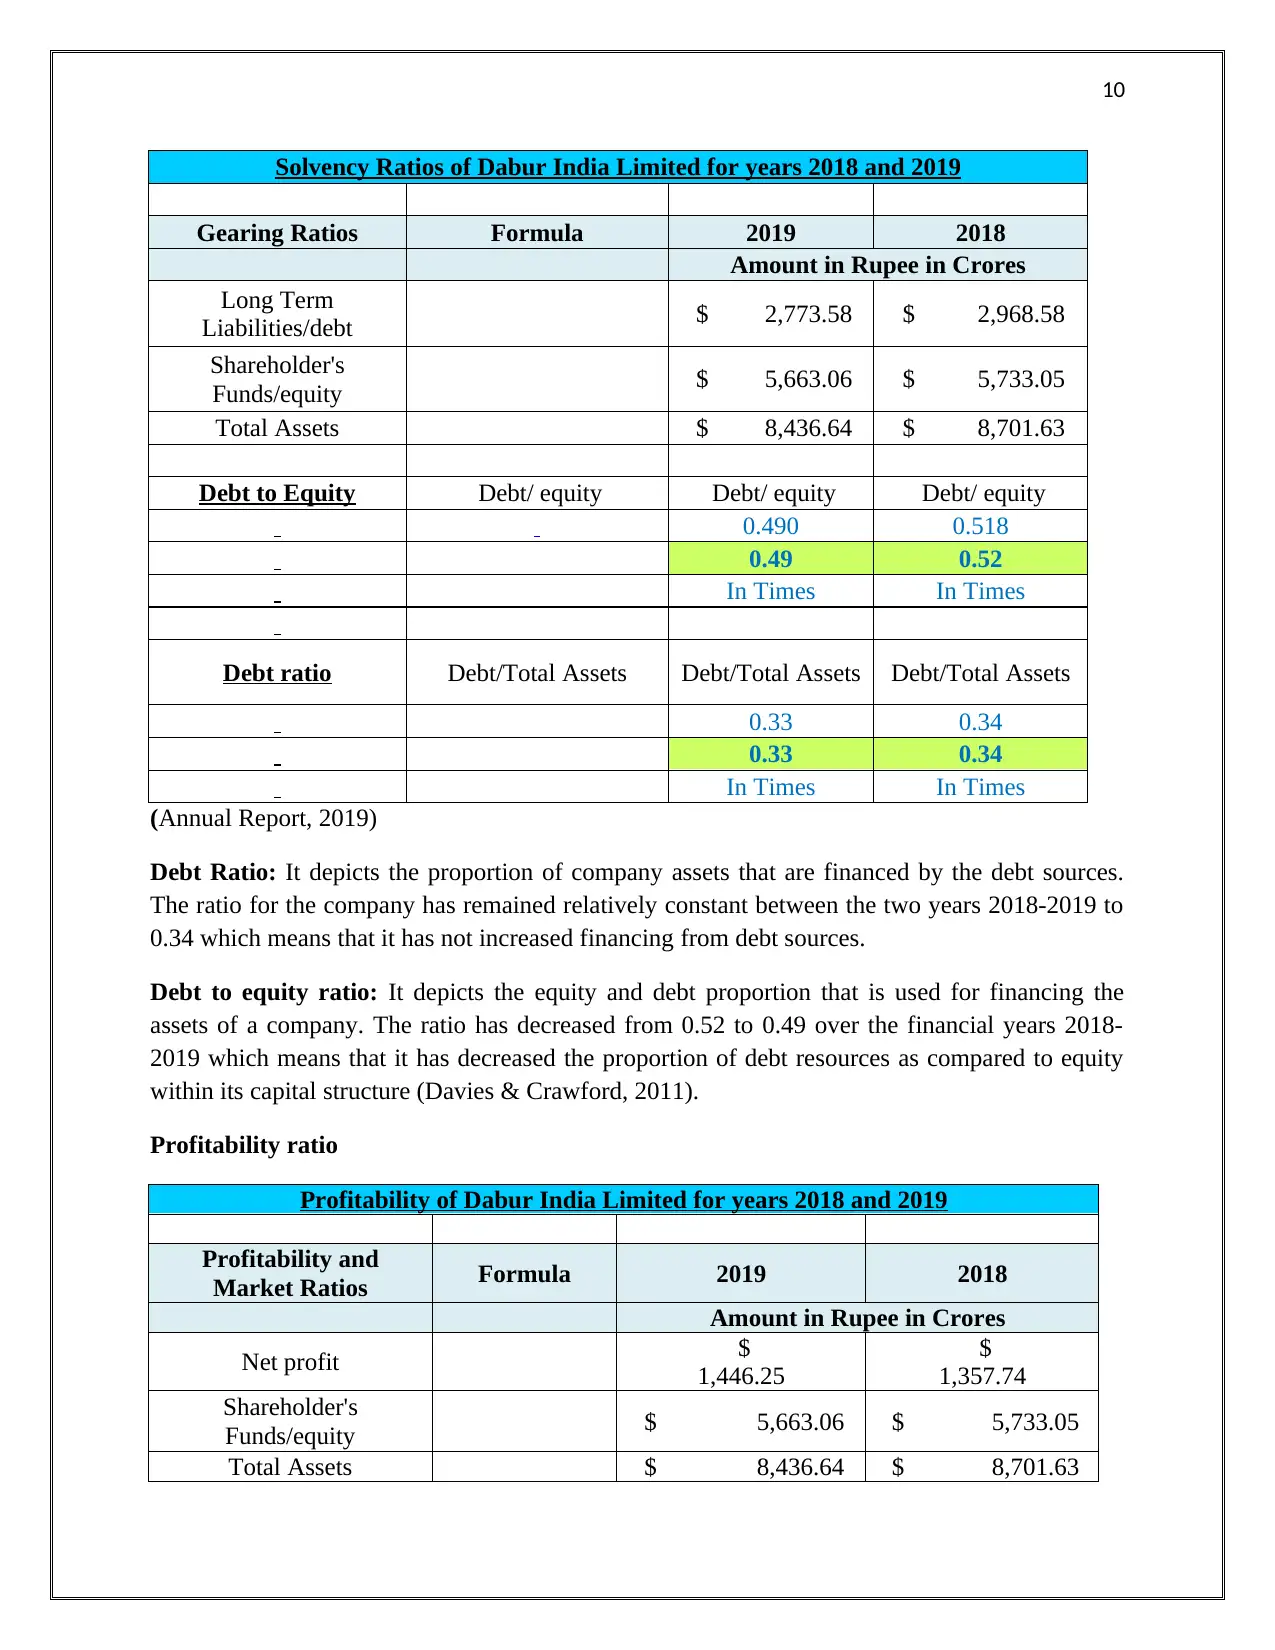
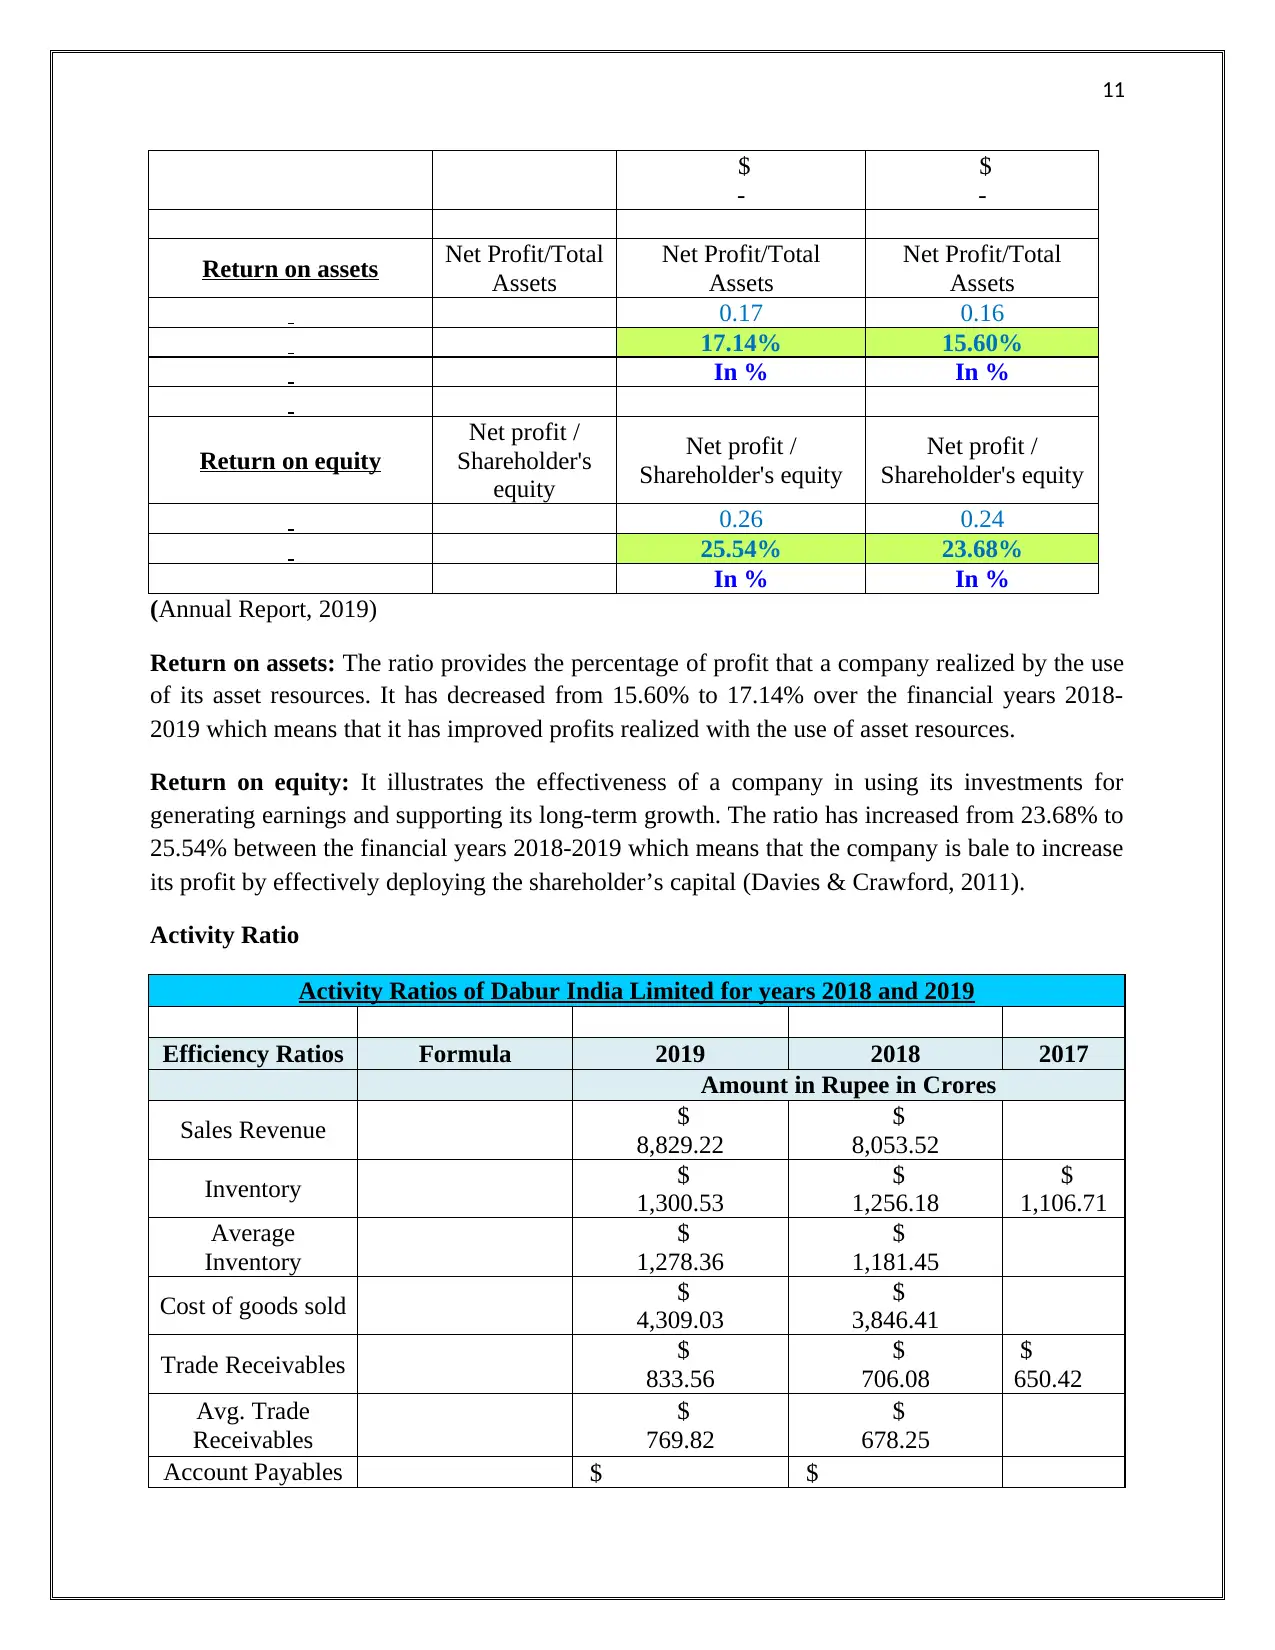
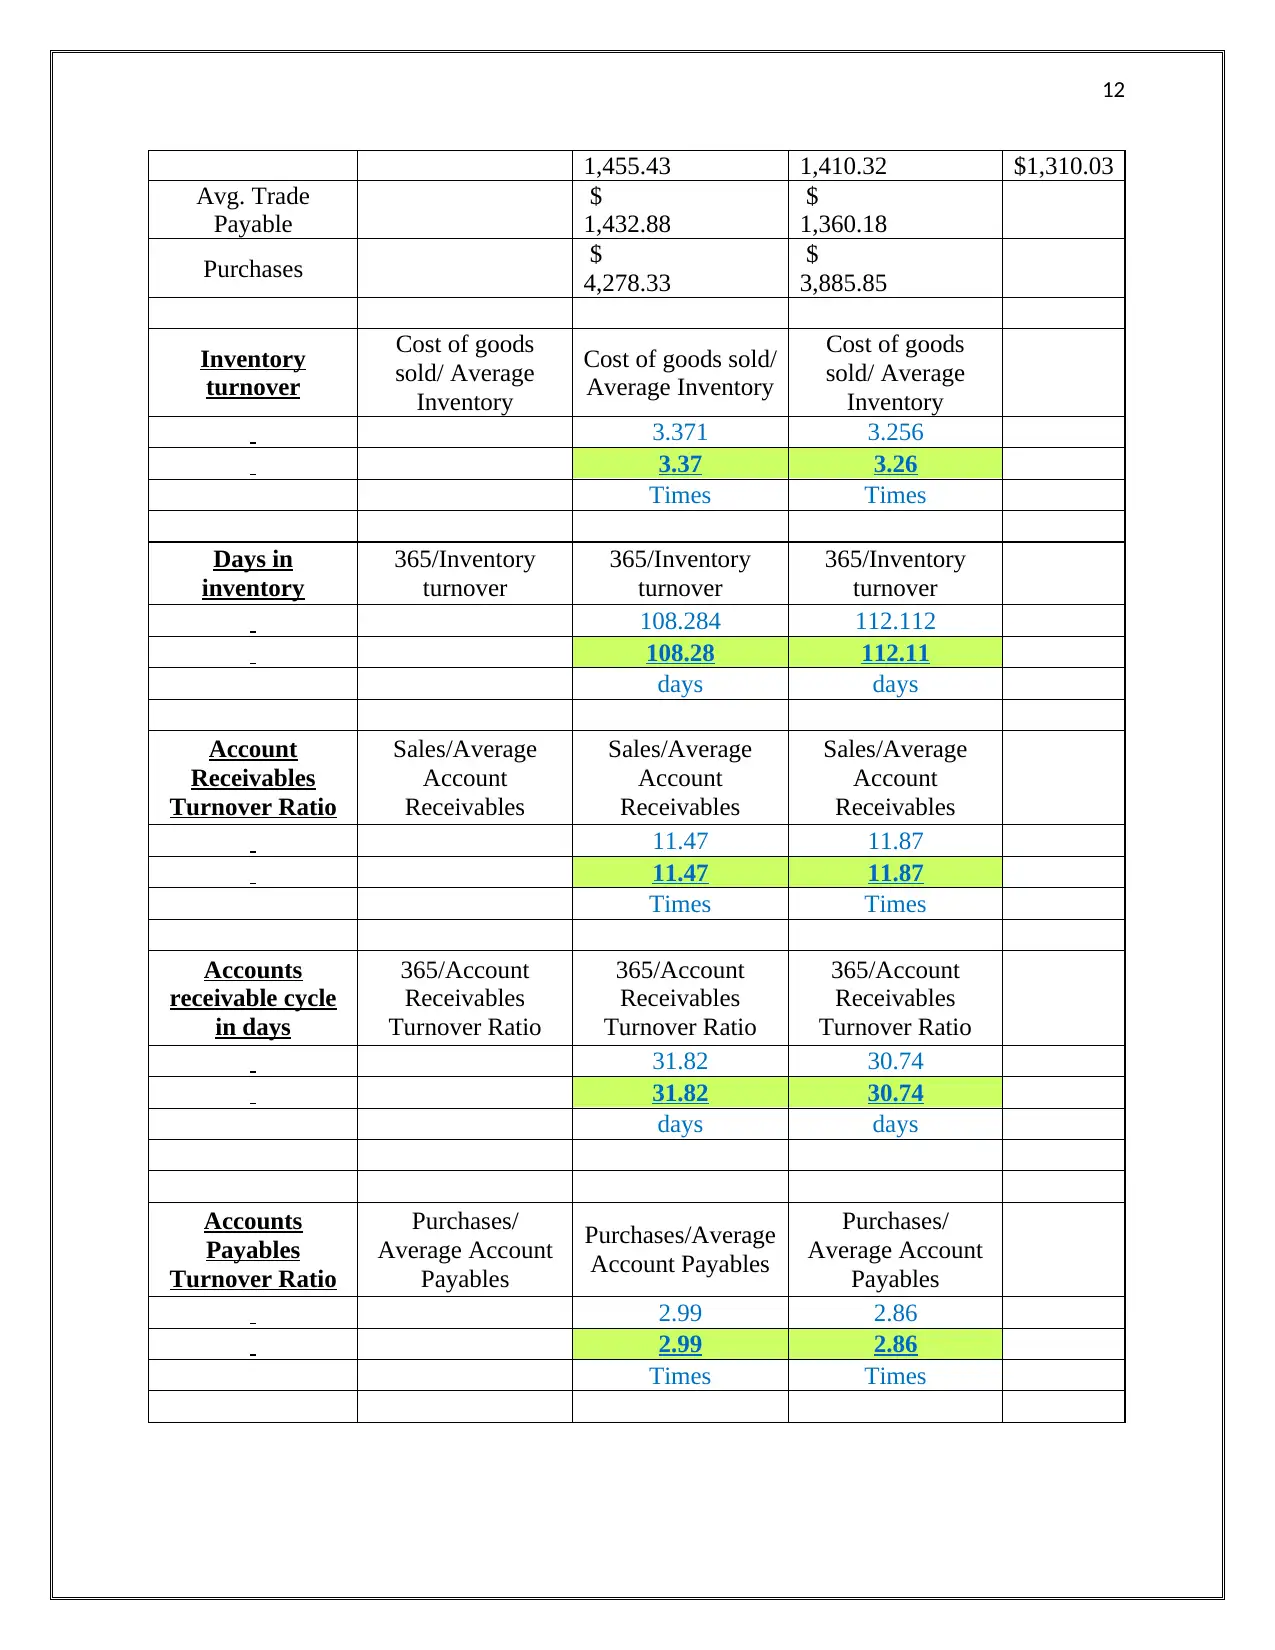
This report presents a financial analysis of Dabur India Limited, examining its consolidated profit and loss statement and statement of financial position for the years 2018 and 2019. The analysis includes vertical analysis (common size statements) to assess the proportion of each item relative to the total, and a detailed ratio analysis. The ratio analysis covers liquidity ratios (current ratio, quick ratio), solvency ratios (debt to equity, debt ratio), profitability ratios (return on assets, return on equity), and activity ratios (inventory turnover, days in inventory, accounts receivable turnover, accounts payable turnover). The report interprets the trends and changes in these ratios, providing insights into Dabur India's financial performance, including its ability to meet short-term obligations, manage debt, generate profits, and efficiently utilize assets and manage working capital. The analysis reveals insights such as decreasing current and quick ratios suggesting a slight decrease in current asset resources and cash resources, respectively; a relatively constant debt ratio and decreasing debt-to-equity ratio indicating stable debt financing and a decreased reliance on debt compared to equity; and improvements in return on assets and equity, indicating enhanced profitability. The report concludes with an assessment of Dabur's financial health based on the observed trends in key financial metrics.
Document Page
1
Financial Analysis of Dabur India Limited
tabler-icon-diamond-filled.svg

Paraphrase This Document

Need a fresh take? Get an instant paraphrase of this document with our AI Paraphraser
Document Page
2
Financial Statements of Dabur India Limited for year 2018 and 2019
Consolidated Profit and Loss Statement of Dabur India Limited Year 2018-19
Particulars 31-Mar-18 31-Mar-19
Amount in Rupee in Crores
Income
Revenue from operations
$
7,748.34 $ 8,533.05
Other income
$
305.18 $ 296.17
Total income
$
8,053.52 $ 8,829.22
Expenses
Cost of materials consumed
$
3,220.05 $ 3,475.35
Excise duty
$
26.49 $ 18.06
Purchases of stock-in-trade
$
665.80 $ 802.98
Changes in inventories of finished goods, stock-in-
trade and work-in-progress
-$
65.93 $ 12.64
Employee benefits expense
$
792.79 $ 937.91
Finance costs
$
53.05 $ 59.58
Depreciation and amortisation expense
$
162.18 $ 176.90
Other expenses
Advertisement and publicity
$
606.71 $ 608.33
Others
$
884.99 $ 938.22
Total expenses
$
6,346.13 $ 7,029.97
Profit before exceptional items and tax
$
1,707.39 $ 1,799.25
Less: Exceptional items
$
14.30 $ 74.38
Profit before tax
$
1,693.09 $ 1,724.87
Tax expense
Current tax
$
371.34 $ 406.99
Deferred tax -$ -$ 128.37
Document Page
3
35.99
Total tax expense
$
335.35 $ 278.62
Net profit for the year
$
1,357.74 $ 1,446.25
(Annual Report, 2019)
Consolidated Statement of Financial Position of Dabur India Limited Year 2018-19
Particulars 31-Mar-18 31-Mar-19
Amount in Rupee in Crores
ASSETS
Non-current assets
Property, plant and equipment
$
1,552.10 $ 1,547.97
Capital work-in-progress
$
41.51 $ 63.76
Investment property
$
54.16 $ 52.10
Goodwill
$
411.54 $ 336.07
Other intangible assets
$
10.31 $ 32.92
Financial assets
Investments
$
3,091.78 $ 2,633.35
loans
$
18.96 $ 17.56
others
$
4.11 $ 77.66
Other current tax assets
$
3.33 $ 0.89
Other non-current assets
$
74.08 $ 88.13
Total non-current assets
$
5,261.88 $ 4,850.41
Current assets
Inventories
$
1,256.18 $ 1,300.53
Financial assets
Investments
$
713.39 $ 725.41
trade receivable
$
706.08 $ 833.56
Cash and cash equivalents $ $ 107.69
Document Page
4
153.80
Bank balances other than (iii) above
$
152.26 $ 220.47
Loans
$
34.88 $ 11.04
Others
$
28.27 $ 26.47
Current tax assets (net)
$
1.96 $ 1.32
Other current assets
$
391.01 $ 359.50
Asset held for sale
$
1.92 $ 0.24
Total current asset
$
3,439.75 $ 3,586.23
Total assets
$
8,701.63 $ 8,436.64
EQUITY AND LIABILITIES
Equity
Equity share capital
$
176.15 $ 176.63
Other Equity
$
5,530.37 $ 5,455.05
Non controlling interest
$
26.53 $ 31.38
Total Equity
$
5,733.05 $ 5,663.06
Liability
Non-current liabilities
Financial liabilities
Borrowings
$
364.34 $ 26.05
Other financial liabilities
$
4.25 $ 4.56
Provisions
$
56.50 $ 59.52
Deferred tax liabilities (net)
$
109.05 $ 23.14
Total non-current liabilities
$
534.14 $ 113.27
Current liabilities
Financial liabilities
tabler-icon-diamond-filled.svg

Paraphrase This Document

Need a fresh take? Get an instant paraphrase of this document with our AI Paraphraser
Document Page
5
Borrowings
$
464.49 $ 498.23
Trade payables
$
1,410.32 $ 1,455.43
Other financial liabilities
$
238.20 $ 327.62
Other current liabilities
$
173.03 $ 198.14
Provisions
$
107.47 $ 130.24
Current tax liabilities (net)
$
40.93 $ 50.65
Total current liabilities
$
2,434.44 $ 2,660.31
Total liabilities
$
2,968.58 $ 2,773.58
Total equity and liabilities
$
8,701.63 $ 8,436.64
(Annual Report, 2019)
Vertical Analysis of Dabur India Limited
Common Size Profit and Loss Statement of Dabur India Limited Year 2018-19
Particulars Absolute Amount Percentage of
Balance Sheet
Total
Amount in Rupee in Crores
31-Mar-18 31-Mar-19 31-Mar-
18
31-Mar-
19
Income
Revenue from operations
$
7,748.34 $ 8,533.05 96.21% 96.65%
Other income
$
305.18 $ 296.17 3.79% 3.35%
Total income
$
8,053.52 $ 8,829.22 100.00% 100.00%
Expenses
Cost of materials consumed
$
3,220.05 $ 3,475.35 39.98% 39.36%
Excise duty
$
26.49 $ 18.06 0.33% 0.20%
Purchases of stock-in-trade
$
665.80 $ 802.98 8.27% 9.09%
Document Page
6
Changes in inventories of finished
goods, stock-in-trade and work-in-
progress
-$
65.93 $ 12.64 -0.82% 0.14%
Employee benefits expense
$
792.79 $ 937.91 9.84% 10.62%
Finance costs
$
53.05 $ 59.58 0.66% 0.67%
Depreciation and amortisation
expense
$
162.18 $ 176.90 2.01% 2.00%
Other expenses 0.00% 0.00%
Advertisement and publicity
$
606.71 $ 608.33 7.53% 6.89%
Others
$
884.99 $ 938.22 10.99% 10.63%
Total expenses
$
6,346.13 $ 7,029.97 78.80% 79.62%
Profit before exceptional items
and tax
$
1,707.39 $ 1,799.25 21.20% 20.38%
Less: Exceptional items
$
14.30 $ 74.38 0.18% 0.84%
Profit before tax
$
1,693.09 $ 1,724.87 21.02% 19.54%
Tax expense 0.00% 0.00%
Current tax
$
371.34 $ 406.99 4.61% 4.61%
Deferred tax
-$
35.99 -$ 128.37 -0.45% -1.45%
Total tax expense
$
335.35 $ 278.62 4.16% 3.16%
Net profit for the year
$
1,357.74 $ 1,446.25 16.86% 16.38%
(Annual Report, 2019)
Common Size Statement of Financial Position of Dabur India Limited Year 2018-19
Particulars Absolute Amounts Percentage of balance
sheet total
31-Mar-
18 31-Mar-19 31-Mar-
18
31-Mar-
19
ASSETS
Non-current assets
Property, plant and equipment
$
1,552.10 $ 1,547.97 17.84% 18.35%
Capital work-in-progress
$
41.51 $ 63.76 0.48% 0.76%
Investment property $ $ 52.10 0.62% 0.62%
Document Page
7
54.16
Goodwill
$
411.54 $ 336.07 4.73% 3.98%
Other intangible assets
$
10.31 $ 32.92 0.12% 0.39%
Financial assets
Investments
$
3,091.78 $ 2,633.35 35.53% 31.21%
loans
$
18.96 $ 17.56 0.22% 0.21%
others
$
4.11 $ 77.66 0.05% 0.92%
Other current tax assets
$
3.33 $ 0.89 0.04% 0.01%
Other non-current assets
$
74.08 $ 88.13 0.85% 1.04%
Total non-current assets
$
5,261.88 $ 4,850.41 60.47% 57.49%
Current assets
Inventories
$
1,256.18 $ 1,300.53 14.44% 15.42%
Financial assets
Investments
$
713.39 $ 725.41 8.20% 8.60%
trade receivable
$
706.08 $ 833.56 8.11% 9.88%
Cash and cash equivalents
$
153.80 $ 107.69 1.77% 1.28%
Bank balances other than (iii)
above
$
152.26 $ 220.47 1.75% 2.61%
Loans
$
34.88 $ 11.04 0.40% 0.13%
Others
$
28.27 $ 26.47 0.32% 0.31%
Current tax assets (net)
$
1.96 $ 1.32 0.02% 0.02%
Other current assets
$
391.01 $ 359.50 4.49% 4.26%
Asset held for sale
$
1.92 $ 0.24 0.02% 0.00%
Total current asset
$
3,439.75 $ 3,586.23 39.53% 42.51%
Total assets $ $ 8,436.64 100.00% 100.00%
tabler-icon-diamond-filled.svg

Paraphrase This Document

Need a fresh take? Get an instant paraphrase of this document with our AI Paraphraser
Document Page
8
8,701.63
EQUITY AND LIABILITIES
Equity
Equity share capital
$
176.15 $ 176.63 2.02% 2.09%
Other Equity
$
5,530.37 $ 5,455.05 63.56% 64.66%
Non controlling interest
$
26.53 $ 31.38 0.30% 0.37%
Total Equity
$
5,733.05 $ 5,663.06 65.88% 67.12%
Liability
Non-current liabilities
Financial liabilities
Borrowings
$
364.34 $ 26.05 4.19% 0.31%
Other financial liabilities
$
4.25 $ 4.56 0.05% 0.05%
Provisions
$
56.50 $ 59.52 0.65% 0.71%
Deferred tax liabilities (net)
$
109.05 $ 23.14 1.25% 0.27%
Total non-current liabilities
$
534.14 $ 113.27 6.14% 1.34%
Current liabilities
Financial liabilities
Borrowings
$
464.49 $ 498.23 5.34% 5.91%
Trade payables
$
1,410.32 $ 1,455.43 16.21% 17.25%
Other financial liabilities
$
238.20 $ 327.62 2.74% 3.88%
Other current liabilities
$
173.03 $ 198.14 1.99% 2.35%
Provisions
$
107.47 $ 130.24 1.24% 1.54%
Current tax liabilities (net)
$
40.93 $ 50.65 0.47% 0.60%
Total current liabilities
$
2,434.44 $ 2,660.31 27.98% 31.53%
Total liabilities
$
2,968.58 $ 2,773.58 34.12% 32.88%
Document Page
9
Total equity and liabilities
$
8,701.63 $ 8,436.64 100.00% 100.00%
(Annual Report, 2019)
Financial Analysis using ratio analysis
Liquidity Analysis
Liquidity Ratios of Dabur India Limited for years 2018 and 2019
Liquidity Ratios Formula 2019 2018
Amount in Rupee in Crores
Current Assets $ 3,586.23 $ 3,439.75
Current Liabilities $ 2,660.31 $ 2,434.44
Inventory $ 1,300.53 $ 1,256.18
Current Ratio Total current assets /
Total current liabilities
Total current
assets / Total
current liabilities
Total current
assets / Total
current liabilities
1.35 1.41
1.35 1.41
Times Times
Quick Ratio
(Total current assets -
Inventory) / Total
current liabilities
(Total current assets
- Inventory) / Total
current liabilities
(Total current assets
- Inventory) / Total
current liabilities
0.86 0.90
0.86 0.90
Times Times
(Annual Report, 2019)
Current Ratio: This liquidity ratio provides a measure of the ability of a company to meet its
short-term obligations due within a year. It has decreased from 1.41 to 1.35 during the financial
period 2018-2019 which means that there is slight decrease in the current asset resources over
the selected period.
Quick Ratio: This ratio provides a depiction of the effectiveness of a company to use its cash
resources for meeting its current liabilities. This ratio has also slightly decreased from 0.90 to
0.86 over the financial years 2018-2019 which means that there is decrease in the cash resources
over the selected period (Davies & Crawford, 2011).
Solvency Ratios
Document Page
10
Solvency Ratios of Dabur India Limited for years 2018 and 2019
Gearing Ratios Formula 2019 2018
Amount in Rupee in Crores
Long Term
Liabilities/debt $ 2,773.58 $ 2,968.58
Shareholder's
Funds/equity $ 5,663.06 $ 5,733.05
Total Assets $ 8,436.64 $ 8,701.63
Debt to Equity Debt/ equity Debt/ equity Debt/ equity
0.490 0.518
0.49 0.52
In Times In Times
Debt ratio Debt/Total Assets Debt/Total Assets Debt/Total Assets
0.33 0.34
0.33 0.34
In Times In Times
(Annual Report, 2019)
Debt Ratio: It depicts the proportion of company assets that are financed by the debt sources.
The ratio for the company has remained relatively constant between the two years 2018-2019 to
0.34 which means that it has not increased financing from debt sources.
Debt to equity ratio: It depicts the equity and debt proportion that is used for financing the
assets of a company. The ratio has decreased from 0.52 to 0.49 over the financial years 2018-
2019 which means that it has decreased the proportion of debt resources as compared to equity
within its capital structure (Davies & Crawford, 2011).
Profitability ratio
Profitability of Dabur India Limited for years 2018 and 2019
Profitability and
Market Ratios Formula 2019 2018
Amount in Rupee in Crores
Net profit $
1,446.25
$
1,357.74
Shareholder's
Funds/equity $ 5,663.06 $ 5,733.05
Total Assets $ 8,436.64 $ 8,701.63
tabler-icon-diamond-filled.svg

Paraphrase This Document

Need a fresh take? Get an instant paraphrase of this document with our AI Paraphraser
Document Page
11
$
-
$
-
Return on assets Net Profit/Total
Assets
Net Profit/Total
Assets
Net Profit/Total
Assets
0.17 0.16
17.14% 15.60%
In % In %
Return on equity
Net profit /
Shareholder's
equity
Net profit /
Shareholder's equity
Net profit /
Shareholder's equity
0.26 0.24
25.54% 23.68%
In % In %
(Annual Report, 2019)
Return on assets: The ratio provides the percentage of profit that a company realized by the use
of its asset resources. It has decreased from 15.60% to 17.14% over the financial years 2018-
2019 which means that it has improved profits realized with the use of asset resources.
Return on equity: It illustrates the effectiveness of a company in using its investments for
generating earnings and supporting its long-term growth. The ratio has increased from 23.68% to
25.54% between the financial years 2018-2019 which means that the company is bale to increase
its profit by effectively deploying the shareholder’s capital (Davies & Crawford, 2011).
Activity Ratio
Activity Ratios of Dabur India Limited for years 2018 and 2019
Efficiency Ratios Formula 2019 2018 2017
Amount in Rupee in Crores
Sales Revenue $
8,829.22
$
8,053.52
Inventory $
1,300.53
$
1,256.18
$
1,106.71
Average
Inventory
$
1,278.36
$
1,181.45
Cost of goods sold $
4,309.03
$
3,846.41
Trade Receivables $
833.56
$
706.08
$
650.42
Avg. Trade
Receivables
$
769.82
$
678.25
Account Payables $ $
Document Page
12
1,455.43 1,410.32 $1,310.03
Avg. Trade
Payable
$
1,432.88
$
1,360.18
Purchases $
4,278.33
$
3,885.85
Inventory
turnover
Cost of goods
sold/ Average
Inventory
Cost of goods sold/
Average Inventory
Cost of goods
sold/ Average
Inventory
3.371 3.256
3.37 3.26
Times Times
Days in
inventory
365/Inventory
turnover
365/Inventory
turnover
365/Inventory
turnover
108.284 112.112
108.28 112.11
days days
Account
Receivables
Turnover Ratio
Sales/Average
Account
Receivables
Sales/Average
Account
Receivables
Sales/Average
Account
Receivables
11.47 11.87
11.47 11.87
Times Times
Accounts
receivable cycle
in days
365/Account
Receivables
Turnover Ratio
365/Account
Receivables
Turnover Ratio
365/Account
Receivables
Turnover Ratio
31.82 30.74
31.82 30.74
days days
Accounts
Payables
Turnover Ratio
Purchases/
Average Account
Payables
Purchases/Average
Account Payables
Purchases/
Average Account
Payables
2.99 2.86
2.99 2.86
Times Times
chevron_up_icon
1 out of 15
circle_padding
hide_on_mobile
zoom_out_icon
[object Object]