Analyzing Daniel's Portfolio: Risk, Return, and Beta Calculations

Verified

Added on  2022/08/14

|4
|947
|12
Project
AI Summary
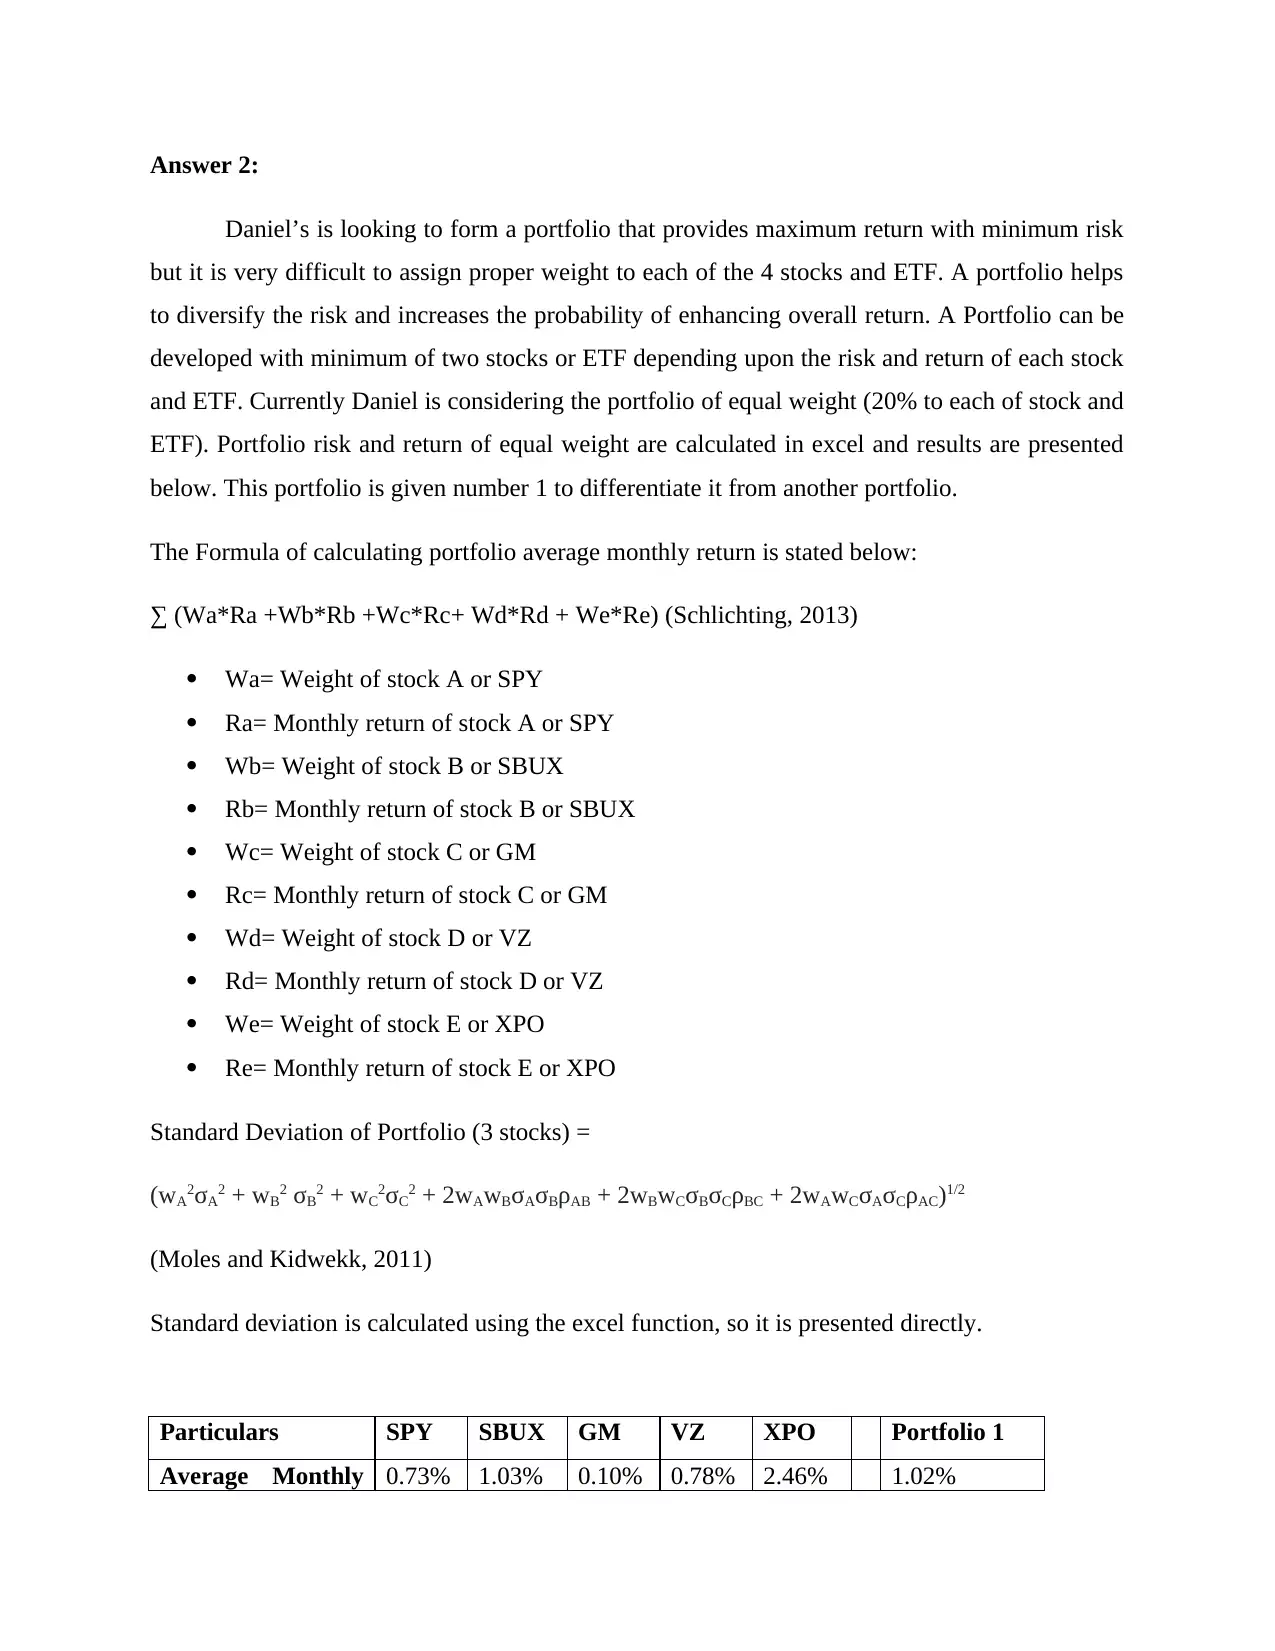
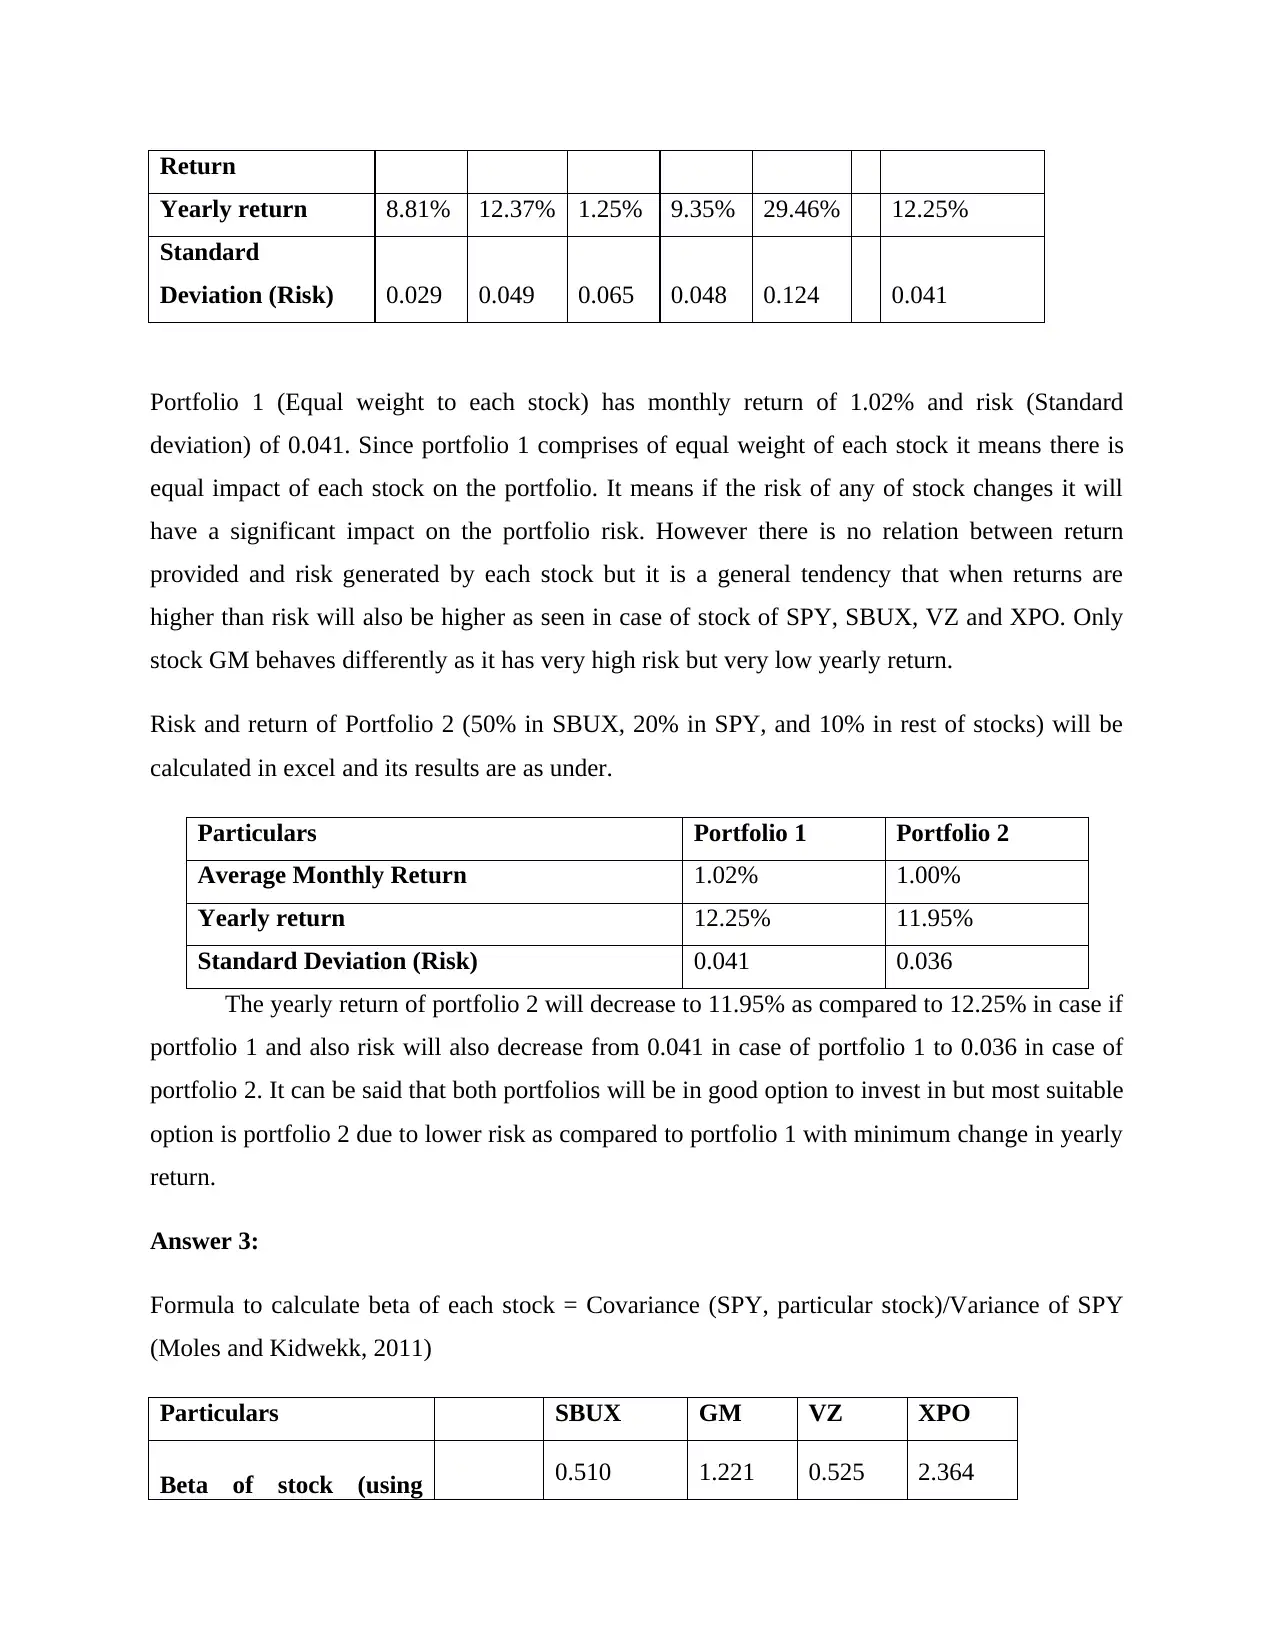
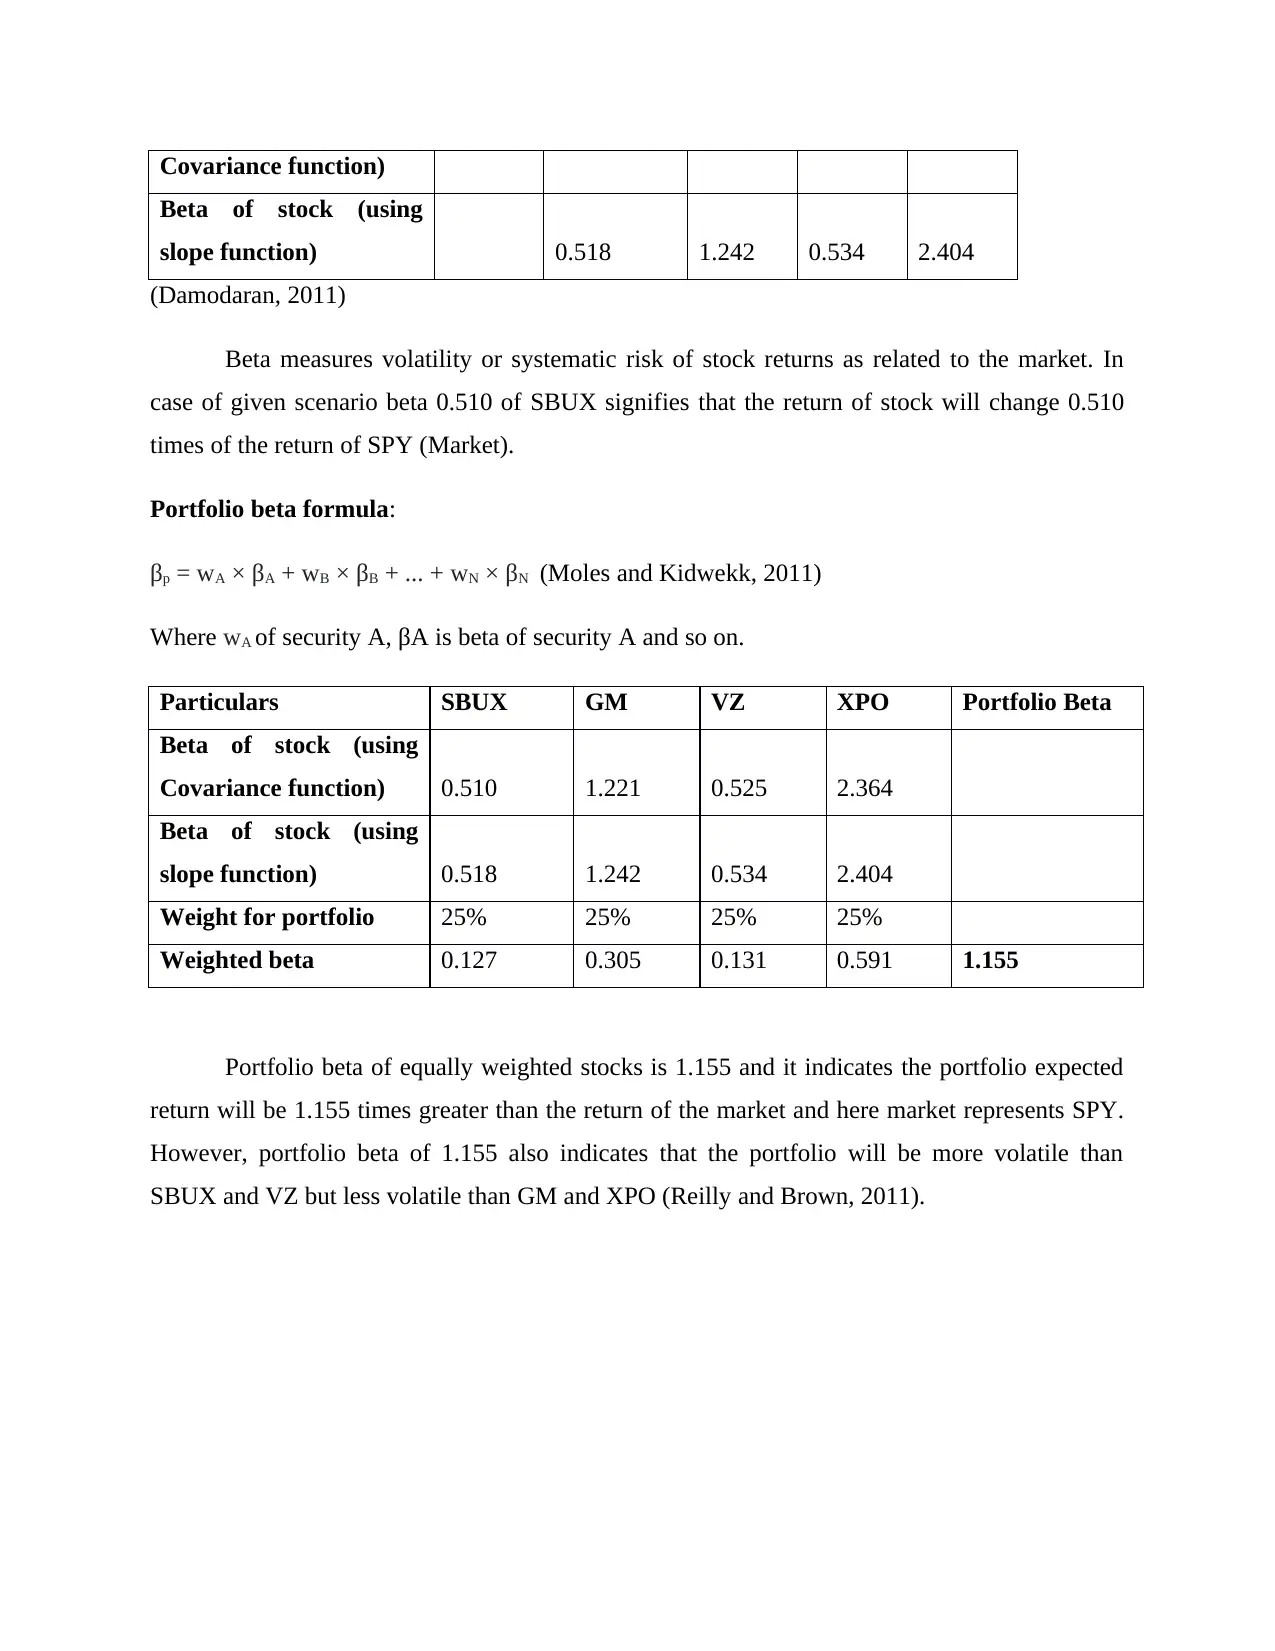
This project analyzes Daniel's portfolio, a case study involving a finance student's investments. The assignment calculates and compares the risk and return of two different portfolios, one with equal weight allocation and another with a modified allocation favoring Starbucks stock. It uses formulas to determine average monthly and yearly returns, as well as standard deviation (risk). The project further calculates the beta of individual stocks within the portfolio, using both covariance and slope functions, and determines the overall portfolio beta. The analysis aims to identify the portfolio with the optimal balance of risk and return, demonstrating key concepts in portfolio management, diversification, and the significance of beta in assessing stock volatility. The project also includes references to relevant financial literature.
Document Page
Answer 2:
Daniel’s is looking to form a portfolio that provides maximum return with minimum risk
but it is very difficult to assign proper weight to each of the 4 stocks and ETF. A portfolio helps
to diversify the risk and increases the probability of enhancing overall return. A Portfolio can be
developed with minimum of two stocks or ETF depending upon the risk and return of each stock
and ETF. Currently Daniel is considering the portfolio of equal weight (20% to each of stock and
ETF). Portfolio risk and return of equal weight are calculated in excel and results are presented
below. This portfolio is given number 1 to differentiate it from another portfolio.
The Formula of calculating portfolio average monthly return is stated below:
∑ (Wa*Ra +Wb*Rb +Wc*Rc+ Wd*Rd + We*Re) (Schlichting, 2013)
Wa= Weight of stock A or SPY
Ra= Monthly return of stock A or SPY
Wb= Weight of stock B or SBUX
Rb= Monthly return of stock B or SBUX
Wc= Weight of stock C or GM
Rc= Monthly return of stock C or GM
Wd= Weight of stock D or VZ
Rd= Monthly return of stock D or VZ
We= Weight of stock E or XPO
Re= Monthly return of stock E or XPO
Standard Deviation of Portfolio (3 stocks) =
(wA2σA2 + wB2 σB2 + wC2σC2 + 2wAwBσAσBρAB + 2wBwCσBσCρBC + 2wAwCσAσCρAC)1/2
(Moles and Kidwekk, 2011)
Standard deviation is calculated using the excel function, so it is presented directly.
Particulars SPY SBUX GM VZ XPO Portfolio 1
Average Monthly 0.73% 1.03% 0.10% 0.78% 2.46% 1.02%
tabler-icon-diamond-filled.svg

Paraphrase This Document

Need a fresh take? Get an instant paraphrase of this document with our AI Paraphraser
Document Page
Return
Yearly return 8.81% 12.37% 1.25% 9.35% 29.46% 12.25%
Standard
Deviation (Risk) 0.029 0.049 0.065 0.048 0.124 0.041
Portfolio 1 (Equal weight to each stock) has monthly return of 1.02% and risk (Standard
deviation) of 0.041. Since portfolio 1 comprises of equal weight of each stock it means there is
equal impact of each stock on the portfolio. It means if the risk of any of stock changes it will
have a significant impact on the portfolio risk. However there is no relation between return
provided and risk generated by each stock but it is a general tendency that when returns are
higher than risk will also be higher as seen in case of stock of SPY, SBUX, VZ and XPO. Only
stock GM behaves differently as it has very high risk but very low yearly return.
Risk and return of Portfolio 2 (50% in SBUX, 20% in SPY, and 10% in rest of stocks) will be
calculated in excel and its results are as under.
Particulars Portfolio 1 Portfolio 2
Average Monthly Return 1.02% 1.00%
Yearly return 12.25% 11.95%
Standard Deviation (Risk) 0.041 0.036
The yearly return of portfolio 2 will decrease to 11.95% as compared to 12.25% in case if
portfolio 1 and also risk will also decrease from 0.041 in case of portfolio 1 to 0.036 in case of
portfolio 2. It can be said that both portfolios will be in good option to invest in but most suitable
option is portfolio 2 due to lower risk as compared to portfolio 1 with minimum change in yearly
return.
Answer 3:
Formula to calculate beta of each stock = Covariance (SPY, particular stock)/Variance of SPY
(Moles and Kidwekk, 2011)
Particulars SBUX GM VZ XPO
Beta of stock (using 0.510 1.221 0.525 2.364
Document Page
Covariance function)
Beta of stock (using
slope function) 0.518 1.242 0.534 2.404
(Damodaran, 2011)
Beta measures volatility or systematic risk of stock returns as related to the market. In
case of given scenario beta 0.510 of SBUX signifies that the return of stock will change 0.510
times of the return of SPY (Market).
Portfolio beta formula:
βp = wA × βA + wB × βB + ... + wN × βN (Moles and Kidwekk, 2011)
Where wA of security A, βA is beta of security A and so on.
Particulars SBUX GM VZ XPO Portfolio Beta
Beta of stock (using
Covariance function) 0.510 1.221 0.525 2.364
Beta of stock (using
slope function) 0.518 1.242 0.534 2.404
Weight for portfolio 25% 25% 25% 25%
Weighted beta 0.127 0.305 0.131 0.591 1.155
Portfolio beta of equally weighted stocks is 1.155 and it indicates the portfolio expected
return will be 1.155 times greater than the return of the market and here market represents SPY.
However, portfolio beta of 1.155 also indicates that the portfolio will be more volatile than
SBUX and VZ but less volatile than GM and XPO (Reilly and Brown, 2011).
Document Page
References
Damodaran, A, 2011. Applied corporate finance. USA: John Wiley & sons.
Moles, P. and Kidwekk, D. 2011. Corporate finance. USA: John Wiley &sons.
Reilly.F.K. and Brown.K.C. 2011. Investment analysis & portfolio management. UK: South
western Cengage learning.
Schlichting, T. 2013. Fundamental Analysis, Behavioral Finance and Technical Analysis on the
Stock Market. Australia: GRIN Verlag.
chevron_up_icon
1 out of 4
circle_padding
hide_on_mobile
zoom_out_icon
[object Object]