DAP Fertilizer Procurement and Delivery Project Analysis
VerifiedAdded on 2021/04/17
|7
|1599
|37
Project
AI Summary
This project analyzes the procurement and delivery of Di-Ammonium Phosphate (DAP) fertilizer for Kenya and Rwanda, focusing on the 2018 seasons. The objectives include comparing supplier prices and payment terms, creating a project schedule, and developing Key Performance Indicators (KPIs) for performance evaluation. The project involves delivering 2100 metric tons to Rwanda by January 7, 2018, and 3500 metric tons to Kenya by December 15, 2017. The analysis covers price comparisons, weekly activity schedules, transportation logistics, and warehousing. The project highlights the importance of timely delivery, cost-effectiveness, and efficient warehousing, including inventory accuracy, dock-to-stock time, on-time shipping, and order accuracy. The study considers factors like transportation costs, taxes, and the impact of logistics on project success, especially in developing nations.

DAP Delivery Project
Name
Date
Name
Date
Paraphrase This Document
Need a fresh take? Get an instant paraphrase of this document with our AI Paraphraser
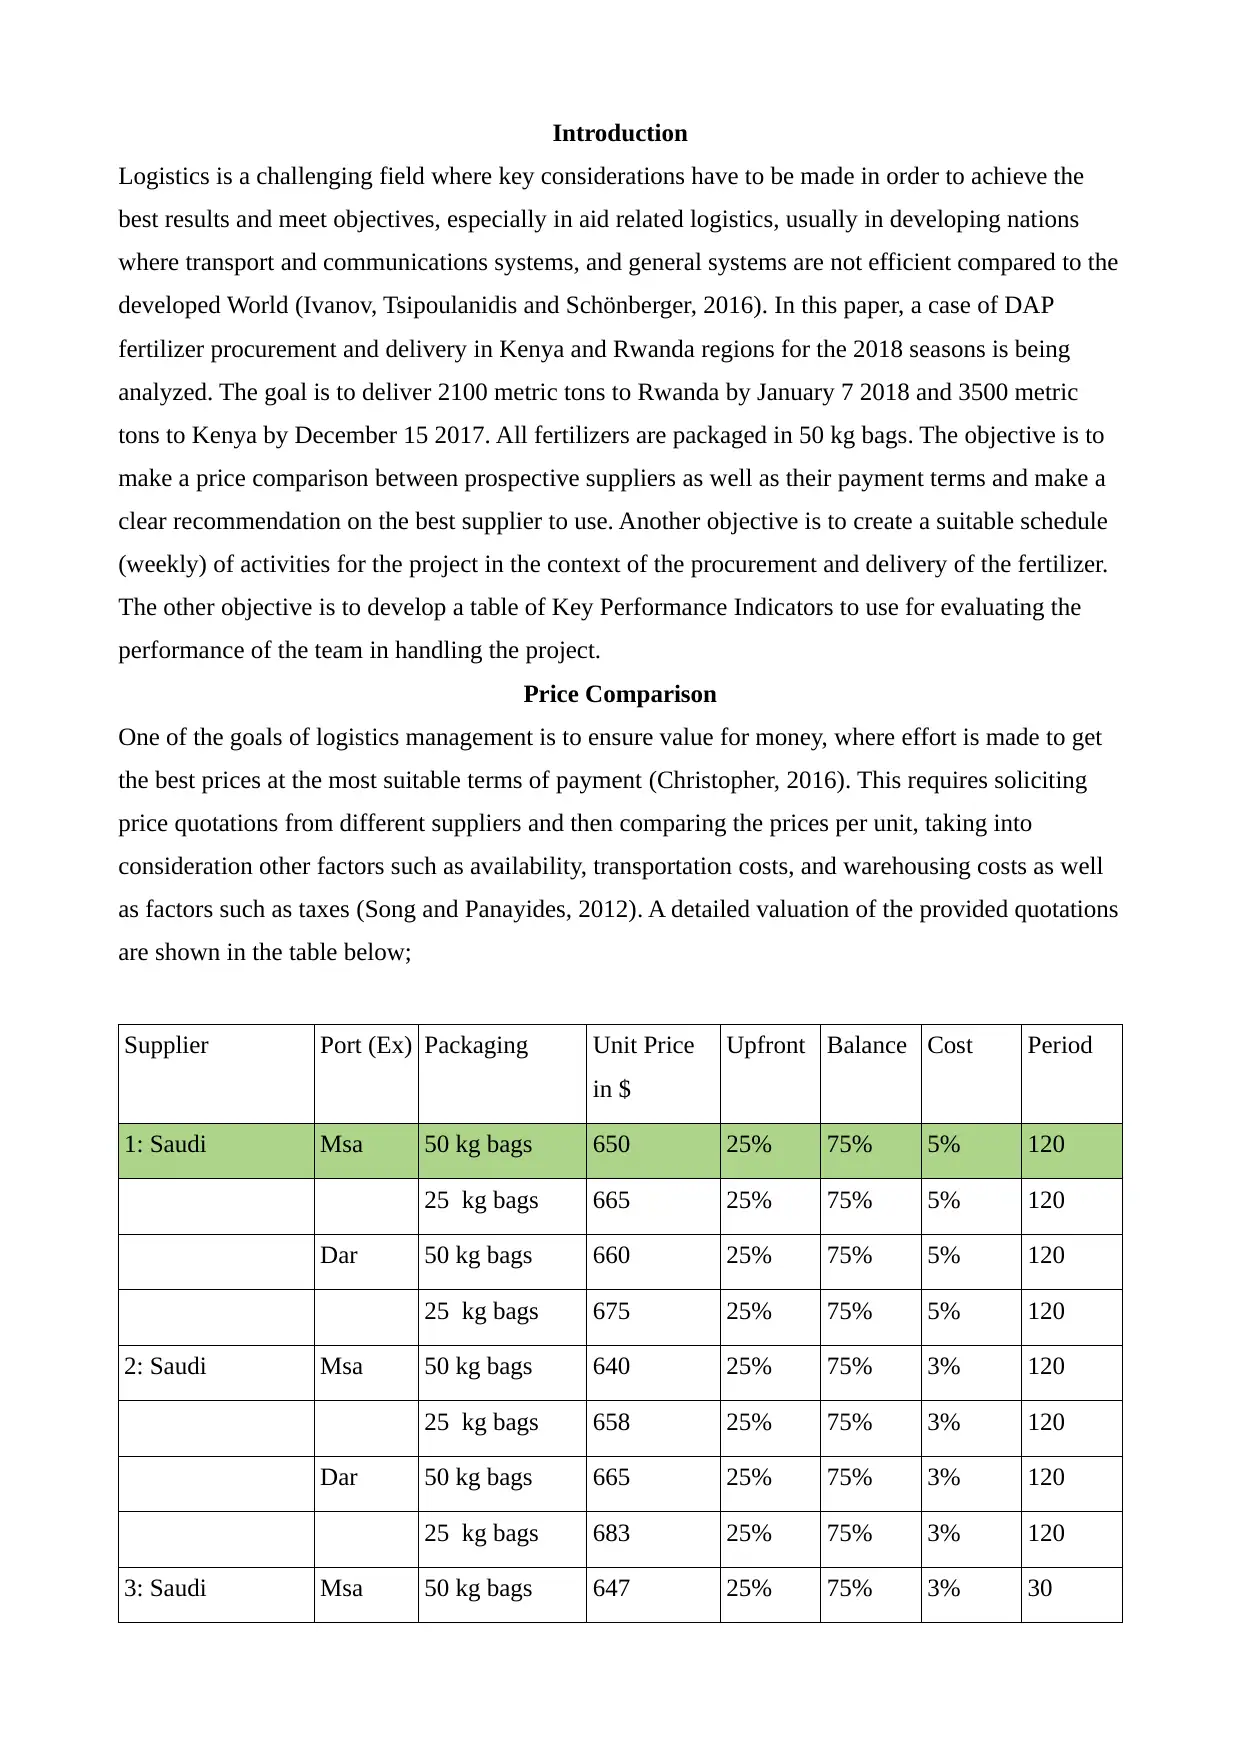
Introduction
Logistics is a challenging field where key considerations have to be made in order to achieve the
best results and meet objectives, especially in aid related logistics, usually in developing nations
where transport and communications systems, and general systems are not efficient compared to the
developed World (Ivanov, Tsipoulanidis and Schönberger, 2016) . In this paper, a case of DAP
fertilizer procurement and delivery in Kenya and Rwanda regions for the 2018 seasons is being
analyzed. The goal is to deliver 2100 metric tons to Rwanda by January 7 2018 and 3500 metric
tons to Kenya by December 15 2017. All fertilizers are packaged in 50 kg bags. The objective is to
make a price comparison between prospective suppliers as well as their payment terms and make a
clear recommendation on the best supplier to use. Another objective is to create a suitable schedule
(weekly) of activities for the project in the context of the procurement and delivery of the fertilizer.
The other objective is to develop a table of Key Performance Indicators to use for evaluating the
performance of the team in handling the project.
Price Comparison
One of the goals of logistics management is to ensure value for money, where effort is made to get
the best prices at the most suitable terms of payment (Christopher, 2016). This requires soliciting
price quotations from different suppliers and then comparing the prices per unit, taking into
consideration other factors such as availability, transportation costs, and warehousing costs as well
as factors such as taxes (Song and Panayides, 2012). A detailed valuation of the provided quotations
are shown in the table below;
Supplier Port (Ex) Packaging Unit Price
in $
Upfront Balance Cost Period
1: Saudi Msa 50 kg bags 650 25% 75% 5% 120
25 kg bags 665 25% 75% 5% 120
Dar 50 kg bags 660 25% 75% 5% 120
25 kg bags 675 25% 75% 5% 120
2: Saudi Msa 50 kg bags 640 25% 75% 3% 120
25 kg bags 658 25% 75% 3% 120
Dar 50 kg bags 665 25% 75% 3% 120
25 kg bags 683 25% 75% 3% 120
3: Saudi Msa 50 kg bags 647 25% 75% 3% 30
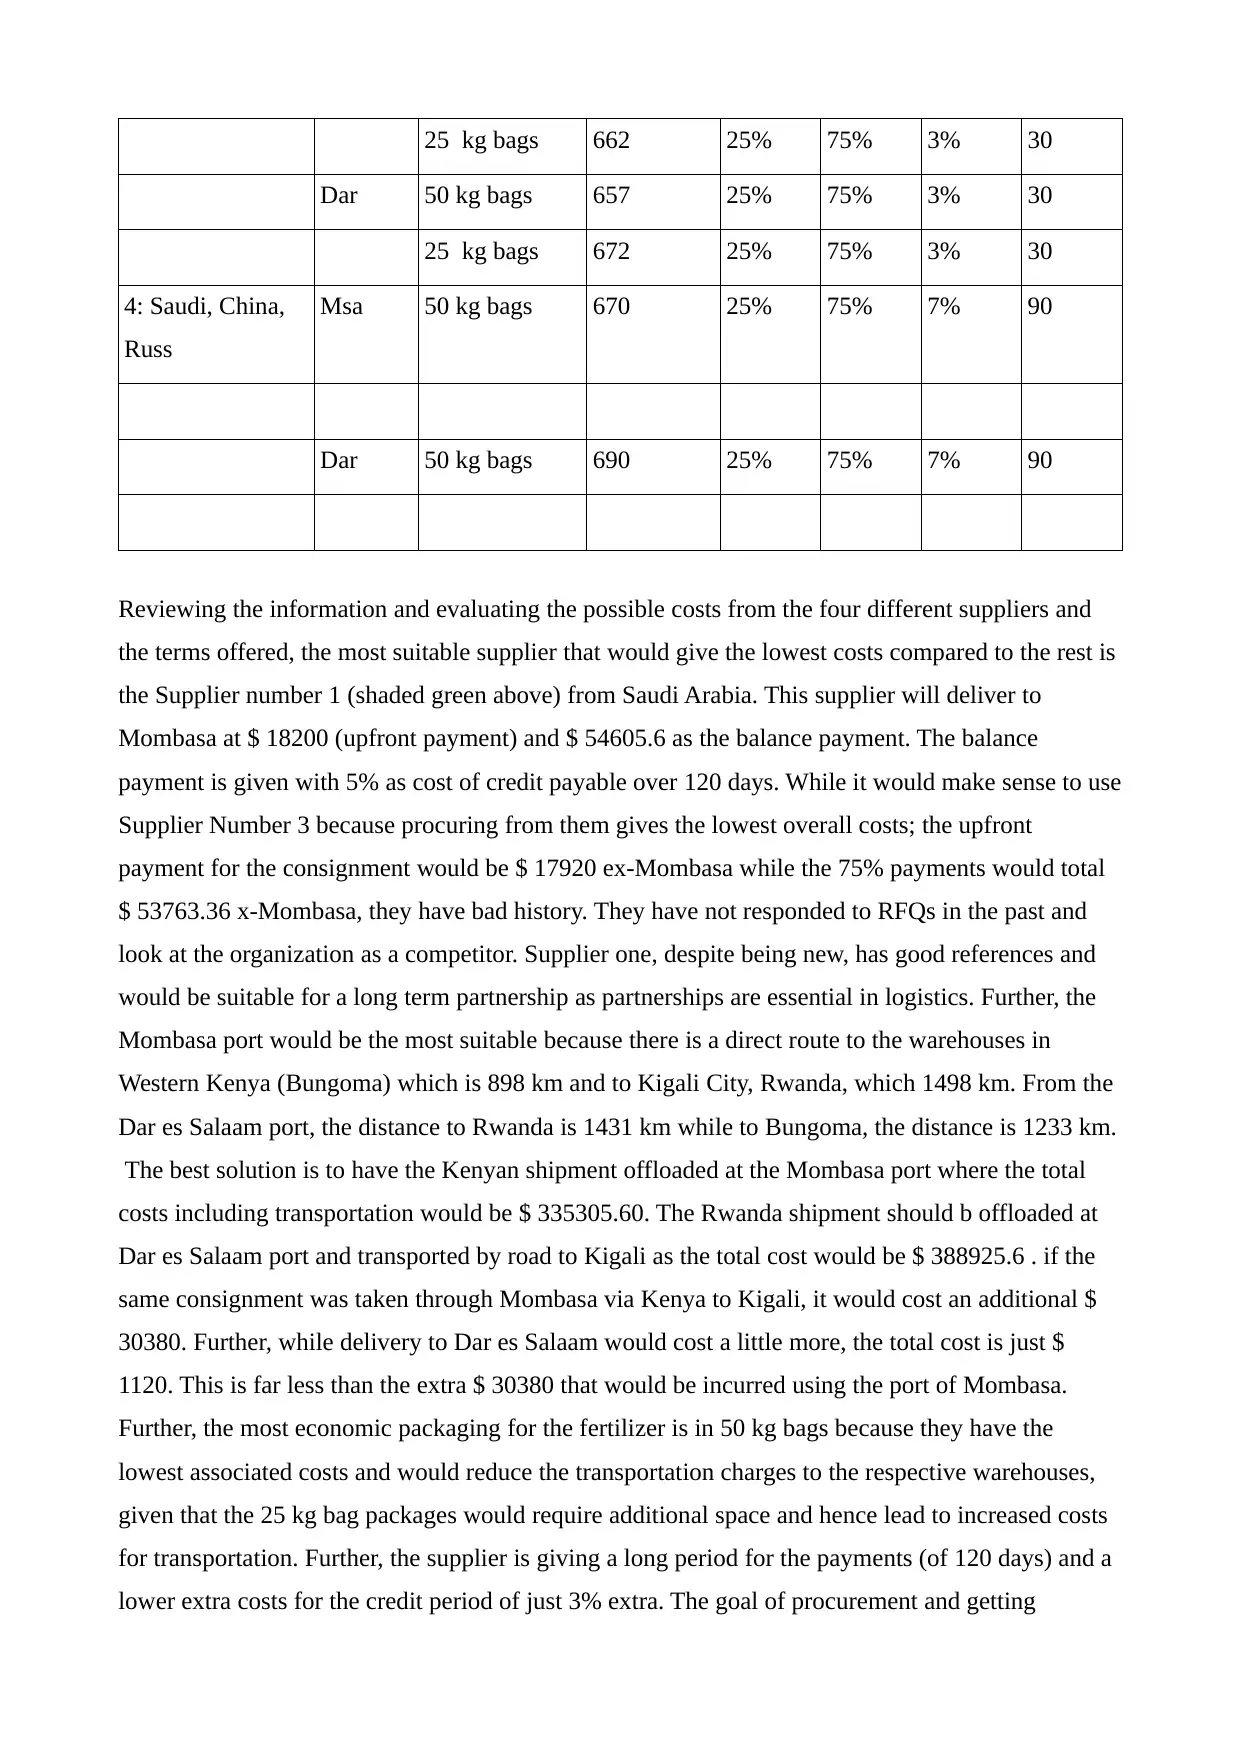
25 kg bags 662 25% 75% 3% 30
Dar 50 kg bags 657 25% 75% 3% 30
25 kg bags 672 25% 75% 3% 30
4: Saudi, China,
Russ
Msa 50 kg bags 670 25% 75% 7% 90
Dar 50 kg bags 690 25% 75% 7% 90
Reviewing the information and evaluating the possible costs from the four different suppliers and
the terms offered, the most suitable supplier that would give the lowest costs compared to the rest is
the Supplier number 1 (shaded green above) from Saudi Arabia. This supplier will deliver to
Mombasa at $ 18200 (upfront payment) and $ 54605.6 as the balance payment. The balance
payment is given with 5% as cost of credit payable over 120 days. While it would make sense to use
Supplier Number 3 because procuring from them gives the lowest overall costs; the upfront
payment for the consignment would be $ 17920 ex-Mombasa while the 75% payments would total
$ 53763.36 x-Mombasa, they have bad history. They have not responded to RFQs in the past and
look at the organization as a competitor. Supplier one, despite being new, has good references and
would be suitable for a long term partnership as partnerships are essential in logistics. Further, the
Mombasa port would be the most suitable because there is a direct route to the warehouses in
Western Kenya (Bungoma) which is 898 km and to Kigali City, Rwanda, which 1498 km. From the
Dar es Salaam port, the distance to Rwanda is 1431 km while to Bungoma, the distance is 1233 km.
The best solution is to have the Kenyan shipment offloaded at the Mombasa port where the total
costs including transportation would be $ 335305.60. The Rwanda shipment should b offloaded at
Dar es Salaam port and transported by road to Kigali as the total cost would be $ 388925.6 . if the
same consignment was taken through Mombasa via Kenya to Kigali, it would cost an additional $
30380. Further, while delivery to Dar es Salaam would cost a little more, the total cost is just $
1120. This is far less than the extra $ 30380 that would be incurred using the port of Mombasa.
Further, the most economic packaging for the fertilizer is in 50 kg bags because they have the
lowest associated costs and would reduce the transportation charges to the respective warehouses,
given that the 25 kg bag packages would require additional space and hence lead to increased costs
for transportation. Further, the supplier is giving a long period for the payments (of 120 days) and a
lower extra costs for the credit period of just 3% extra. The goal of procurement and getting
⊘ This is a preview!⊘
Do you want full access?
Subscribe today to unlock all pages.
Trusted by 1+ million students worldwide
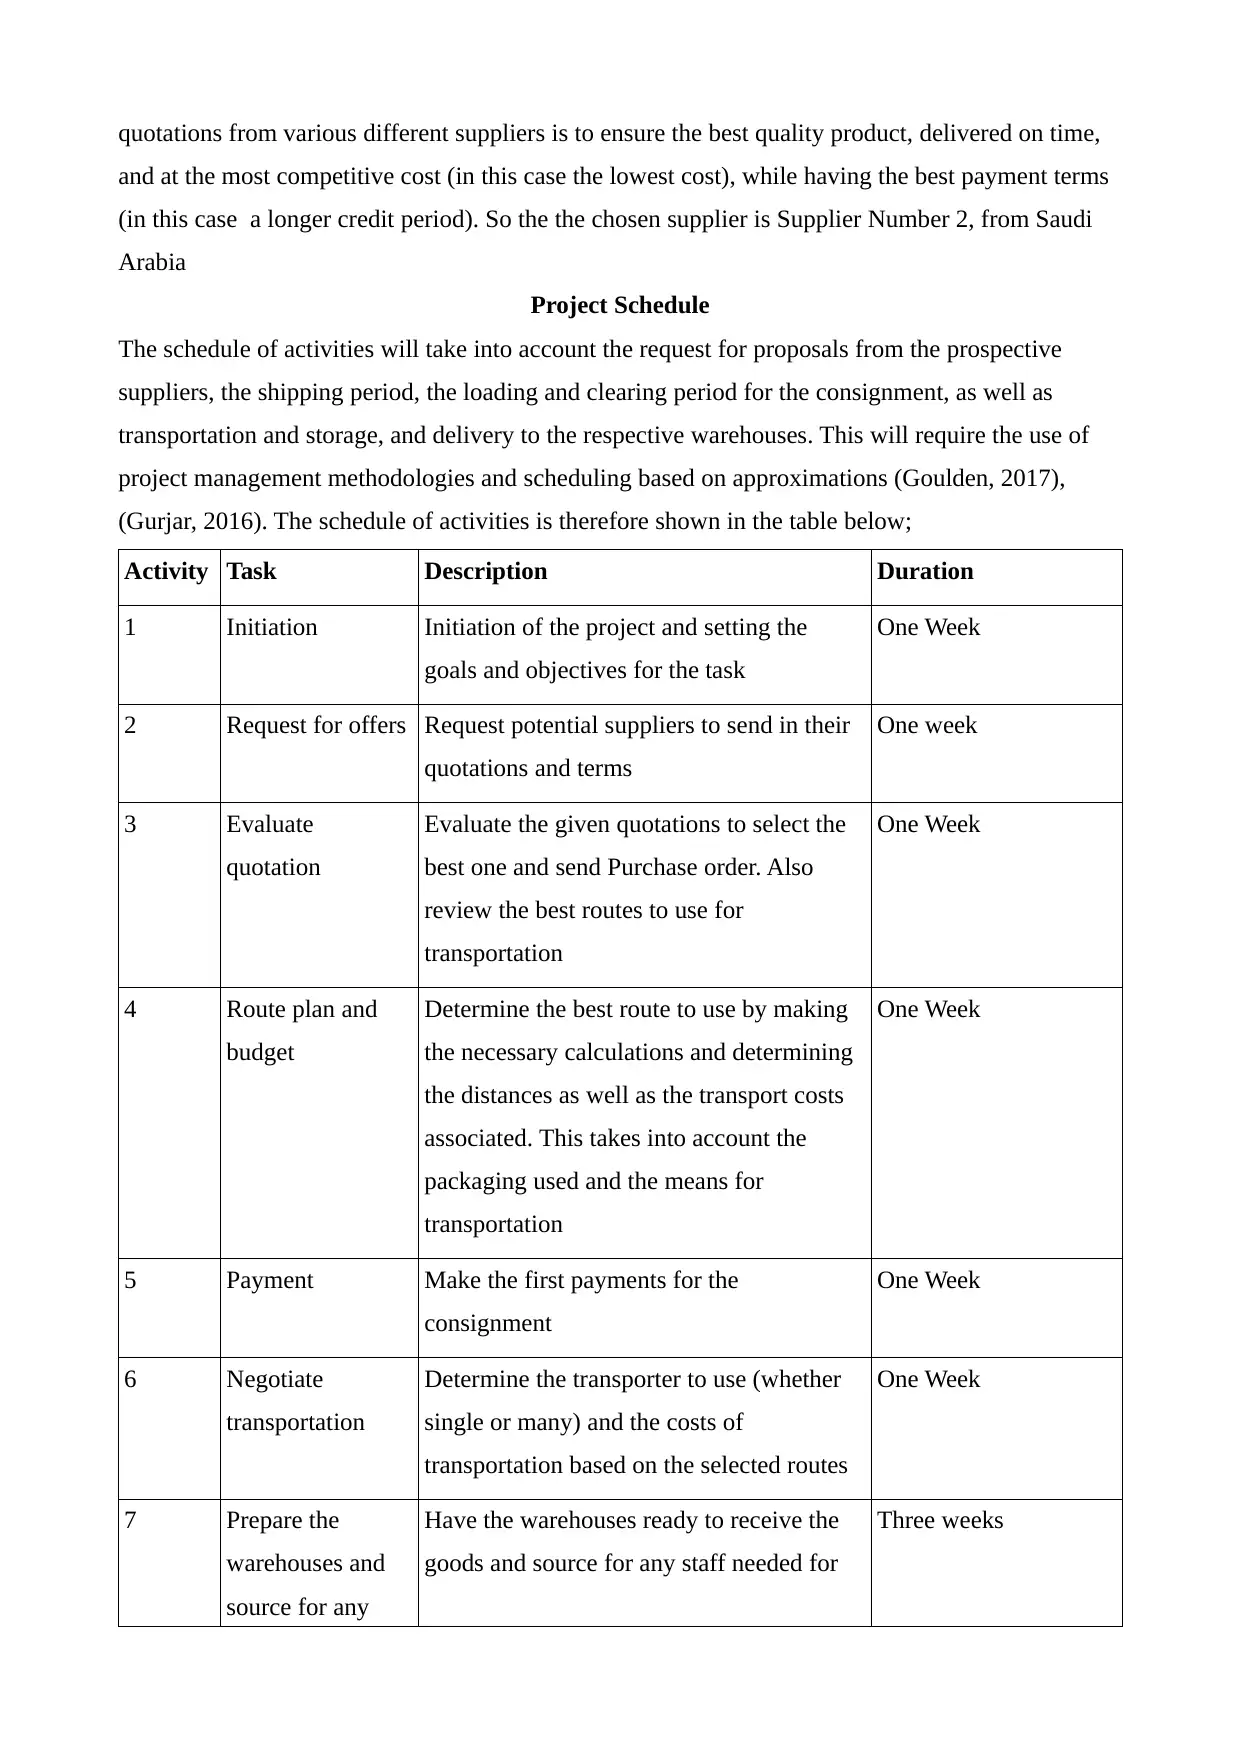
quotations from various different suppliers is to ensure the best quality product, delivered on time,
and at the most competitive cost (in this case the lowest cost), while having the best payment terms
(in this case a longer credit period). So the the chosen supplier is Supplier Number 2, from Saudi
Arabia
Project Schedule
The schedule of activities will take into account the request for proposals from the prospective
suppliers, the shipping period, the loading and clearing period for the consignment, as well as
transportation and storage, and delivery to the respective warehouses. This will require the use of
project management methodologies and scheduling based on approximations (Goulden, 2017),
(Gurjar, 2016). The schedule of activities is therefore shown in the table below;
Activity Task Description Duration
1 Initiation Initiation of the project and setting the
goals and objectives for the task
One Week
2 Request for offers Request potential suppliers to send in their
quotations and terms
One week
3 Evaluate
quotation
Evaluate the given quotations to select the
best one and send Purchase order. Also
review the best routes to use for
transportation
One Week
4 Route plan and
budget
Determine the best route to use by making
the necessary calculations and determining
the distances as well as the transport costs
associated. This takes into account the
packaging used and the means for
transportation
One Week
5 Payment Make the first payments for the
consignment
One Week
6 Negotiate
transportation
Determine the transporter to use (whether
single or many) and the costs of
transportation based on the selected routes
One Week
7 Prepare the
warehouses and
source for any
Have the warehouses ready to receive the
goods and source for any staff needed for
Three weeks
Paraphrase This Document
Need a fresh take? Get an instant paraphrase of this document with our AI Paraphraser
staff that may be
needed
the entire project
8 Nominate agents Nominate a logistics company / agent to
handle import and clearance
One week
9 Documentation Prepare the necessary documentation,
including the Import Declaration Document
based on sent proforma Invoice and local
regulations
One Week
10 Delivery Receive the consignment at the port of
Mombasa and do an inspection to ensure
the consignment meets KEBS standards
and that there are no damages.
Two Weeks (Note that
shipping takes on
average 11 days form
Jeddah, Saudi Arabia to
Mombasa) and clearing
another four to seven
days
11 Delivery Receiving consignment at Dar es Salaam
port
Two and a half Weeks
12 Loading Loading of fertilizer into trucks Three weeks (total)
13 Transportation Transportation of fertilizer to the respective
warehouses
Four weeks
The transportation of the fertilizer to the respective warehouses will take a total of four weeks to
complete, operating at maximum efficiency. This is because it takes one hour to fill one 35 metric
tonne truck at the port. The transportation time from Mombasa to Bungoma, operating non stop and
taking into account average traffic conditions will take at least 16.5 hours, so the total average time
to deliver the fertilizer to Mombasa for every truck is about 24 hours, taking into account loading
and offloading times. The transportation time to Kigali Rwanda will take 25 hours, taking into
account loading and offloading time, the total average time is 31 hours, through Tanzania. The
transportation time also takes into account how much can be transported by road by a single truck:
the Kenyan laws place a maximum limit of 35 metric tons for every 40 foot truck carrier with three
axles drawn by a three axle prime mover that does not exceed 18 metric tons as its tare weight. In
this case, the number of trips (trucks) needed to transport fertilizer to Bungoma are 100 and to
Kigali are 60 trucks.
Key Performance Indicators (KPIs)
KPIs are values that are measurable that demonstrate the achievement of key business objectives.
KPIs are used by organizations to analyze their success (or failure) in attaining some set targets. For
the logistics sector, there are various cross functional KPIs that determine performance. One of the
most important KPIs in this project is transportation that includes shipping and road transport,
handling (loading and offloading), and warehousing. Another KPI that is of importance is
procurement, in the context of procurement costs and timely delivery (Coyle at al., 2017). For
transportation, the KPI is timely delivery of the consignment. The on time final delivery is a KPI
that shows the ability of the consignment carrier to deliver the consignment n time successfully.
This delivery is to the scheduled date of arrival and at the appointed time and location. An accurate
delivery time is critical for success of the project, given the seasonal nature of fertilizer use and the
required times for both Rwanda and Kenya. The desired success rate is stated in the table below.
Cost per unit weight is another important transportation metric. The quotes show delivery ex
Mombasa. The consignment has to undergo clearance, loading and, transportation to the destination.
The gross net and total weight to be moved must be measured for each week and is important in
ensuring the costs are kept low while delivery targets are achieved.
Another important KPI is warehousing and in this case, there are four KPIs namely: accuracy of
inventory, dock to stock, on time shipping, and order accuracy.
Inventory Accuracy: This is a measure of of workers in the warehouse when preparing products.
The desire is a high accuracy to ensure the right products reach the right customers. In this case, the
product is homogeneous so 100% accuracy is desired and achievable.
Dock-t-Stock: Tis is a measure of the cycle time from the commencement of a receipt to the time
when it is put away. This KPI is important for measuring inbound activity efficiencies to ensure
availability when required
On-Time Shipping: This depends on the supplier but is a metric to show percentage shipments
leaving the warehouse on time. It also shows percentage arriving at the warehouses on time
order accuracy: A KPI that shows order accuracy; this again should be 100 percent given the
product is homogeneous.
⊘ This is a preview!⊘
Do you want full access?
Subscribe today to unlock all pages.
Trusted by 1+ million students worldwide
References
Christopher, M. (2016). Marketing logistics. [Place of publication not identified]: Routledge, p.144.
Coyle, J., Langley, C., Novack, R. and Gibson, B. (2017). Supply chain management. Boston, Mass:
Cengage Learning.
Goulden, D. (2017). How to Manage the Logistics Behind Project Management in Enterprise
Business - Clarizen. [online] Clarizen. Available at: https://www.clarizen.com/manage-logistics-
behind-project-management-in-enterprise-business/ [Accessed 7 Mar. 2018].
Gurjar, N. (2016). A forward looking approach to project management : tools, trends, and the
impact of disruptive technologies. London: Springer.
Ivanov, D., Tsipoulanidis, A. and Schönberger, J. (2016). Global supply chain and operations
management. New York: Springer, pp.25 -26.
Song, D. and Panayides, P. (2012). Maritime logistics. Bingley: Emerald.
1 out of 7

Your All-in-One AI-Powered Toolkit for Academic Success.
+13062052269
info@desklib.com
Available 24*7 on WhatsApp / Email
![[object Object]](/_next/static/media/star-bottom.7253800d.svg)
Unlock your academic potential
Copyright © 2020–2026 A2Z Services. All Rights Reserved. Developed and managed by ZUCOL.