Geographic Inquiry on Darwin's City Climate Change and Land Use

Verified

Added on  2023/06/03

|8
|1536
|154
Project
AI Summary
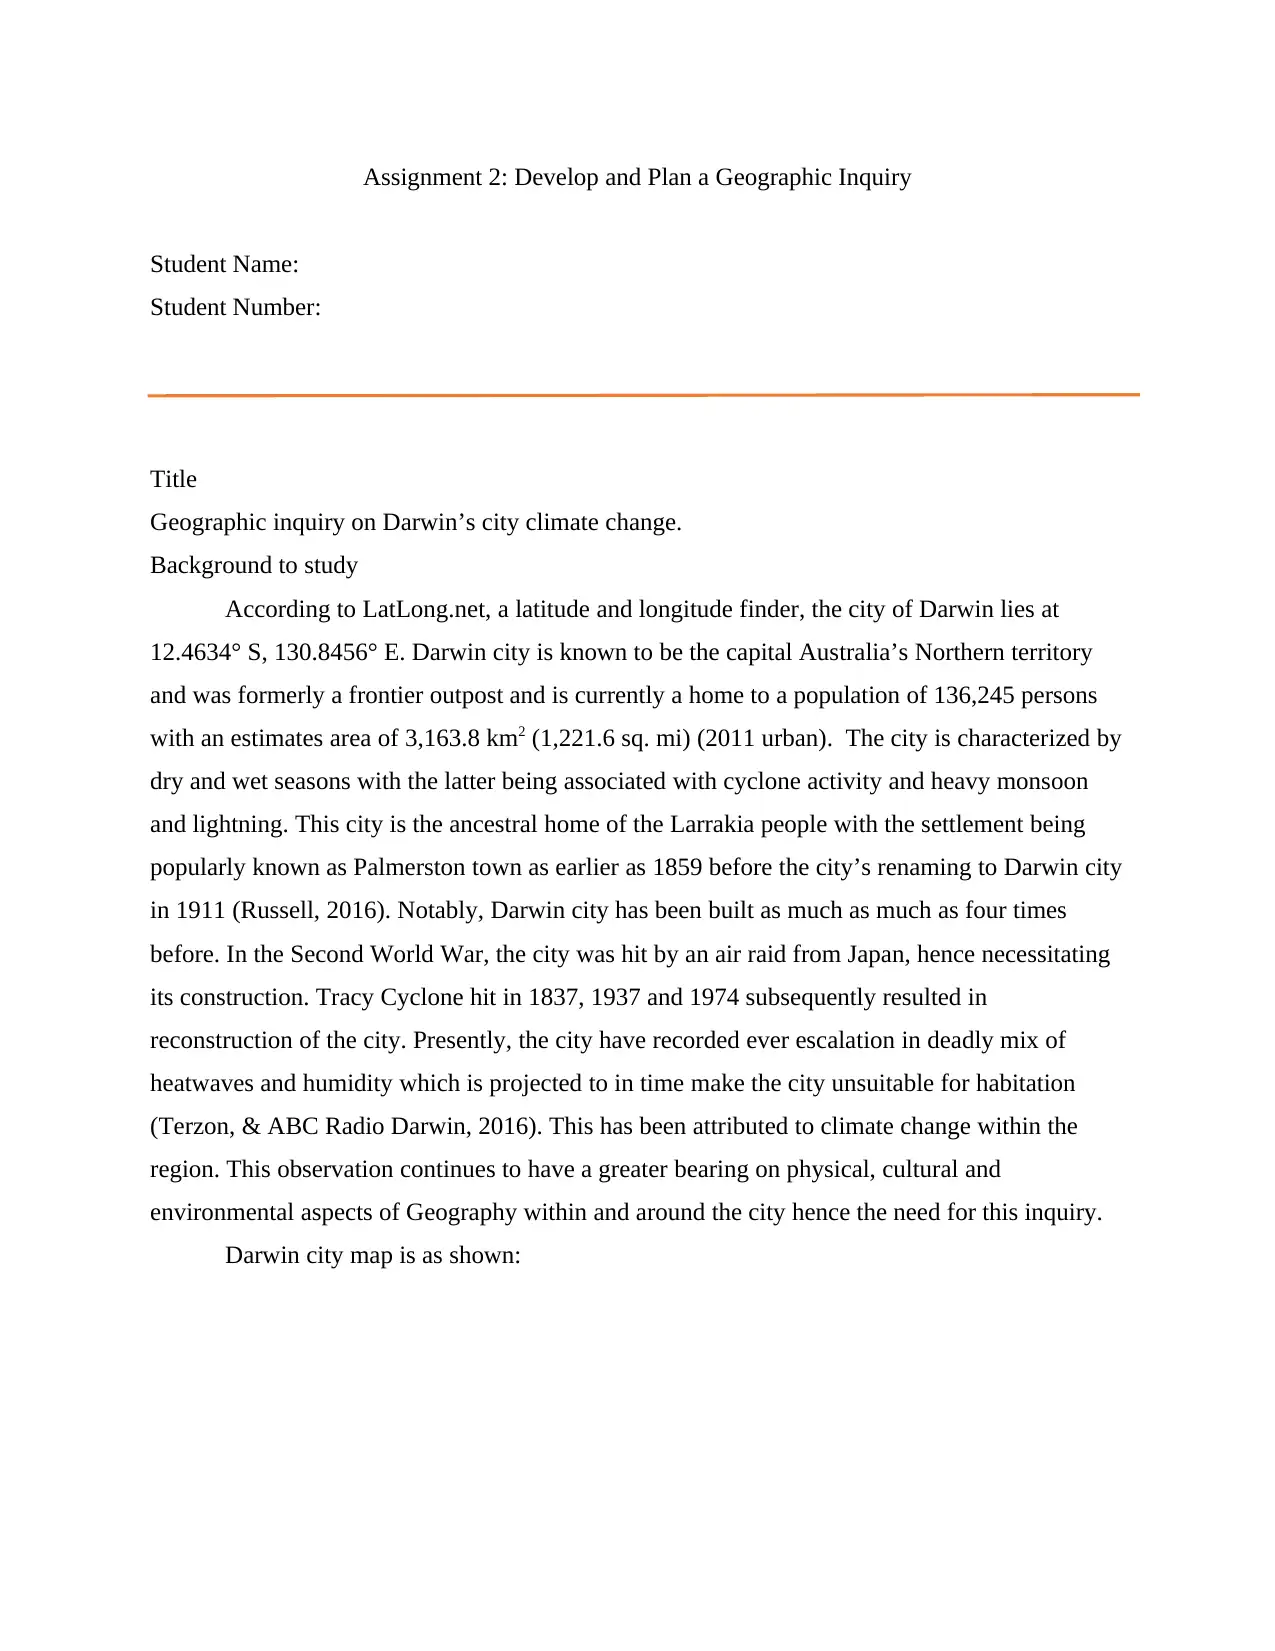
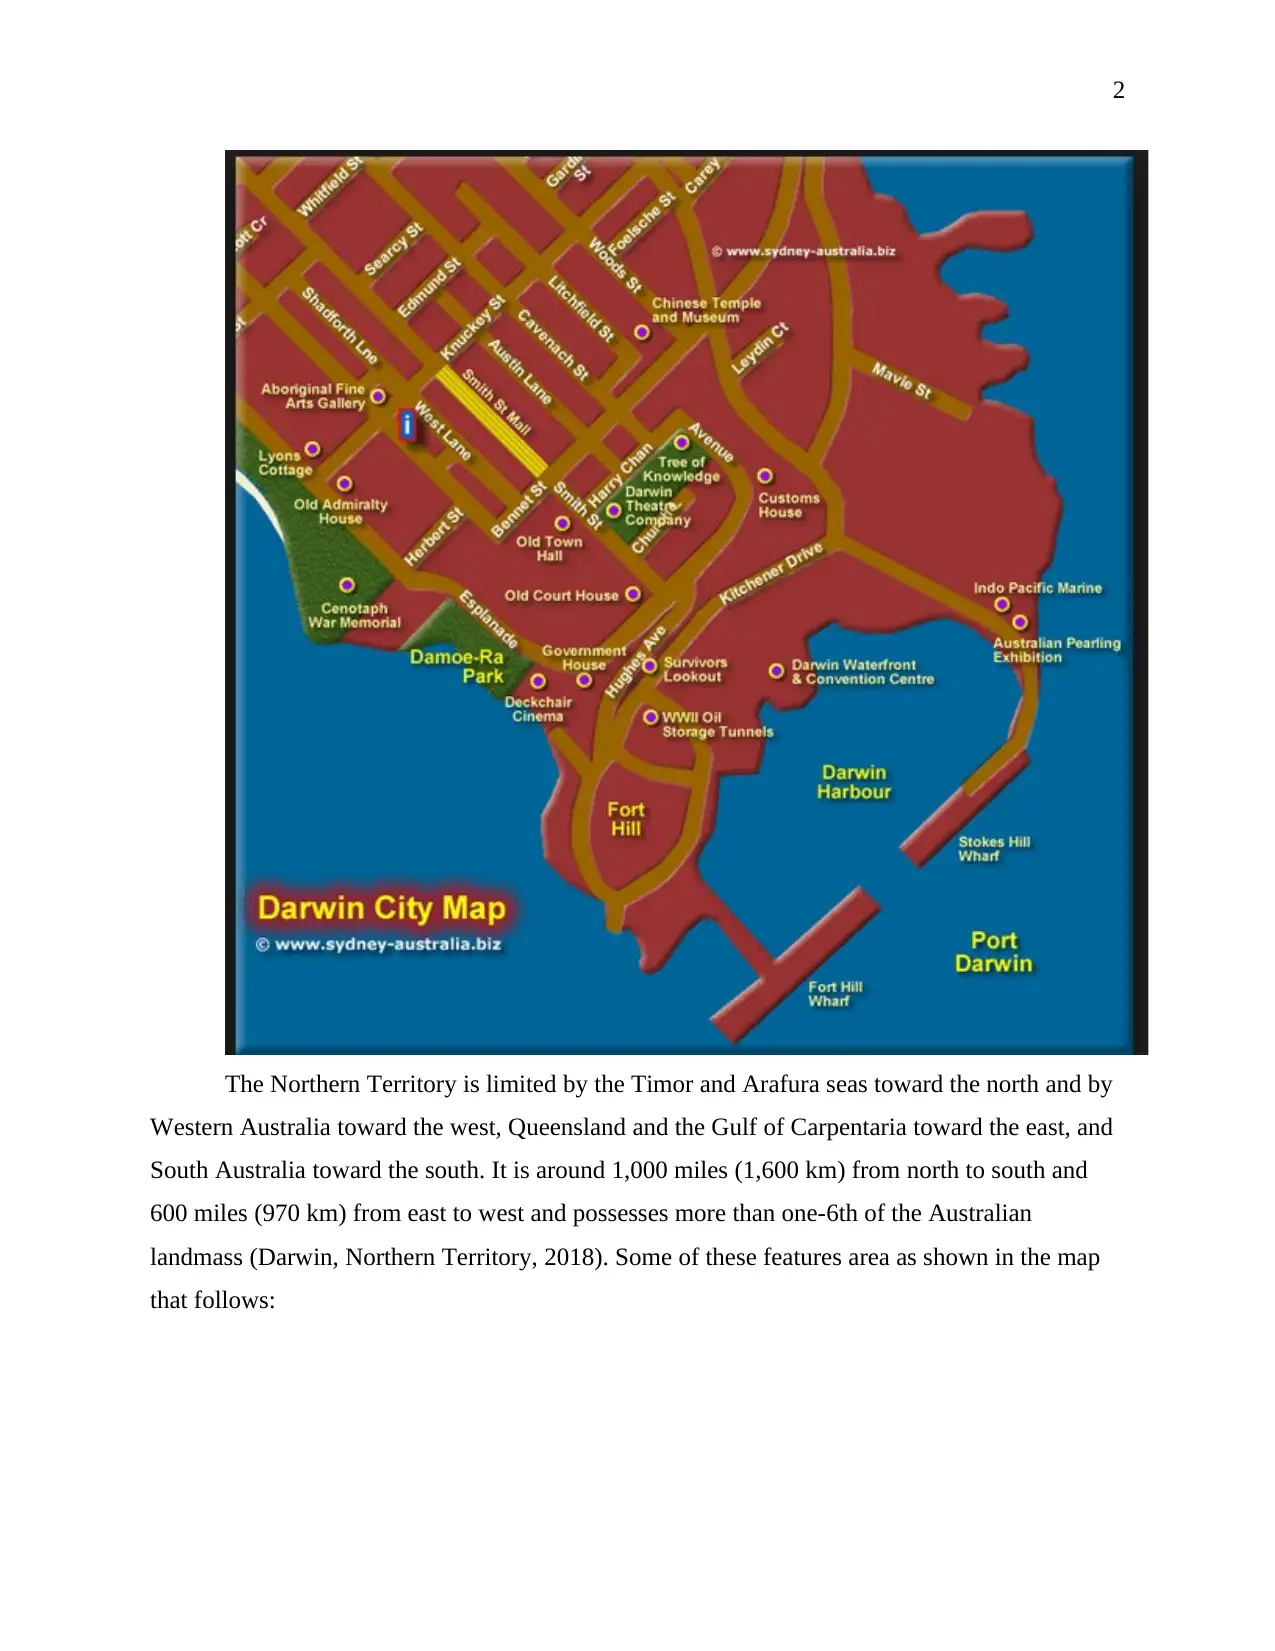
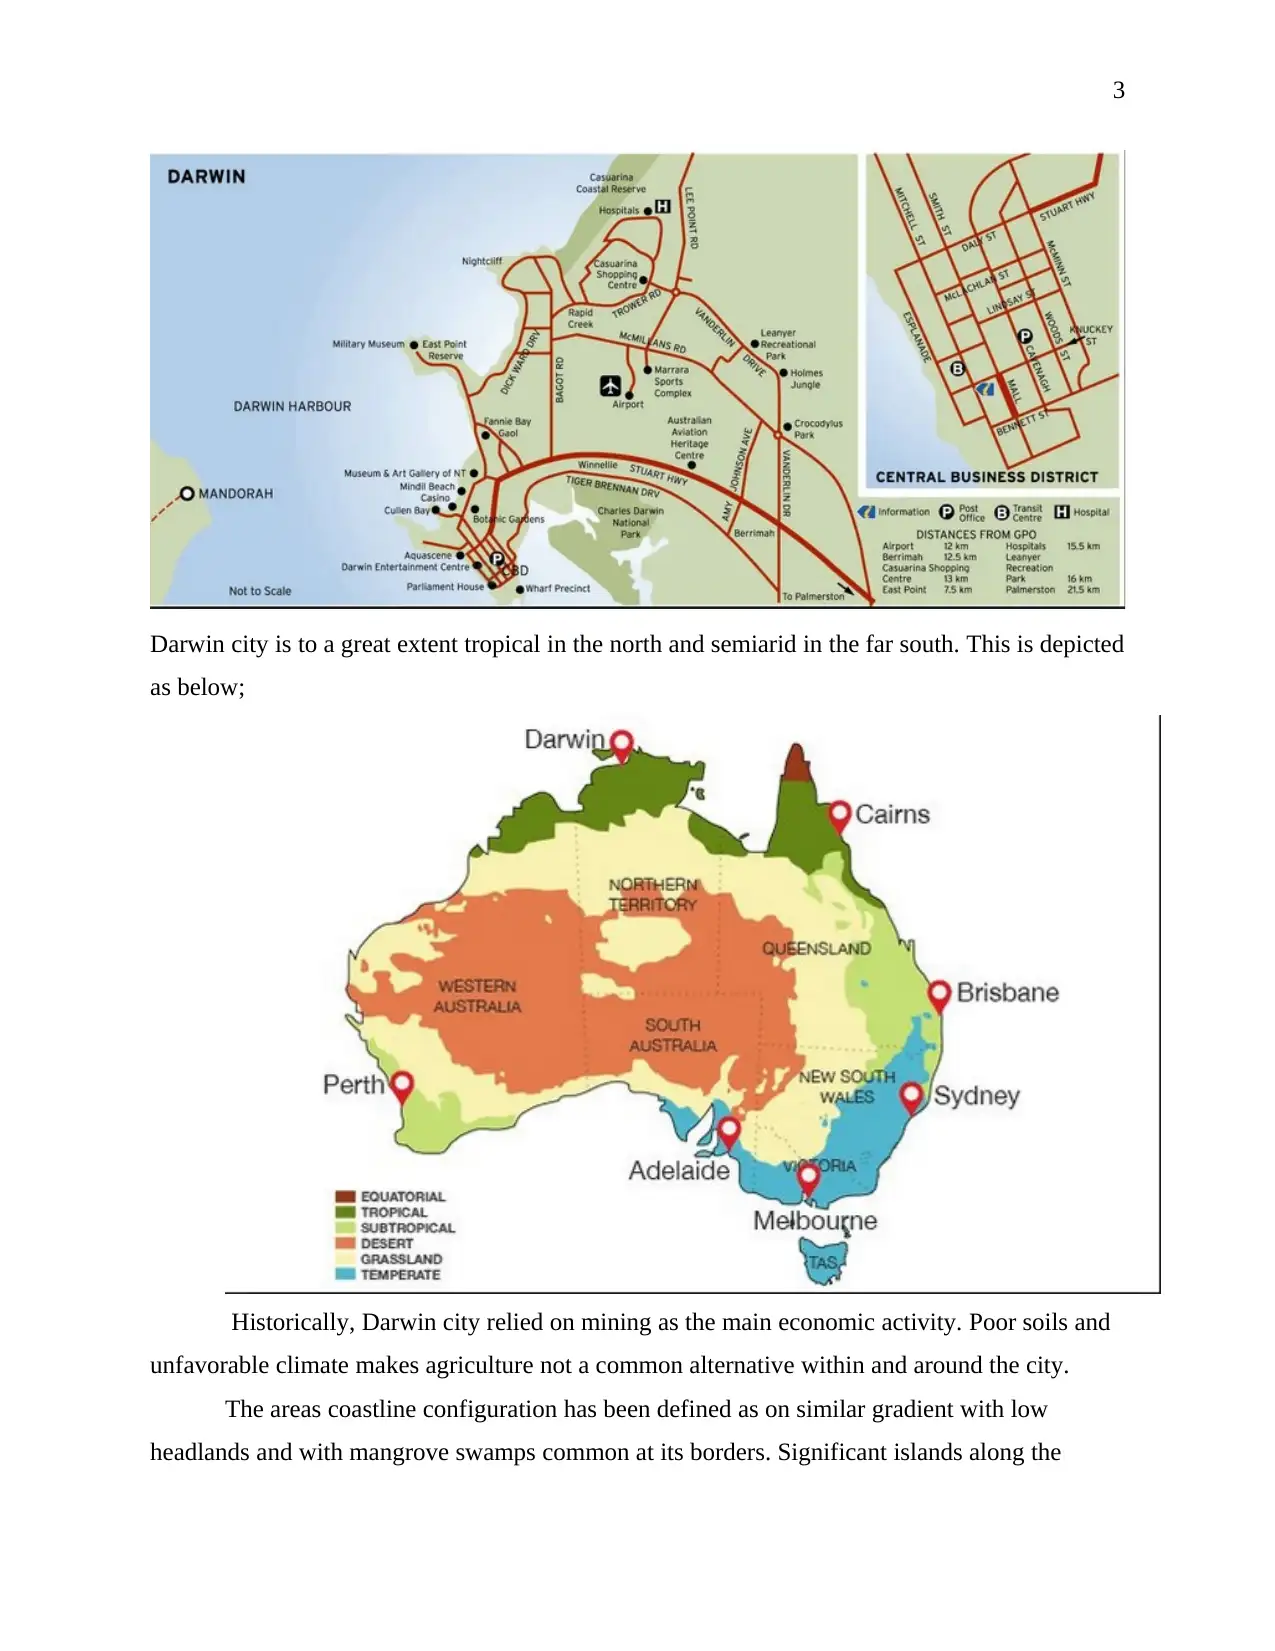
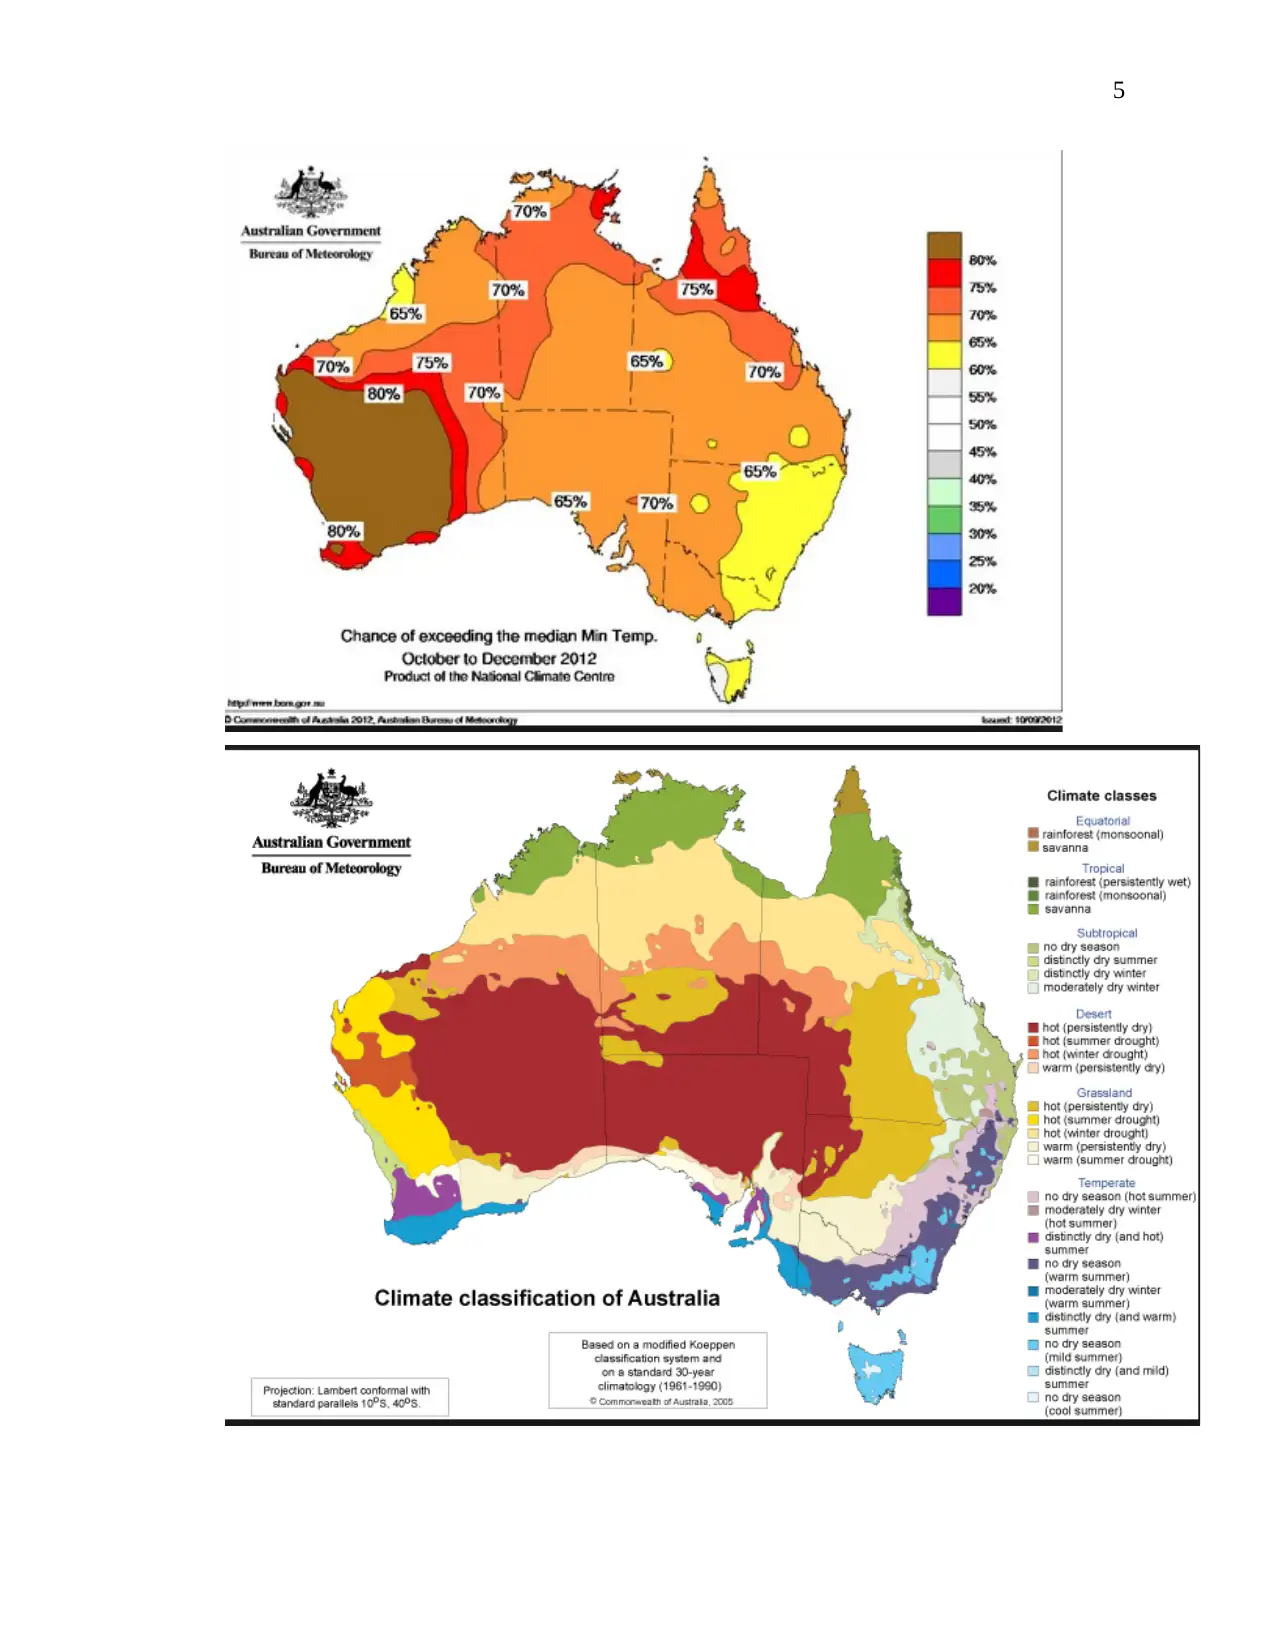
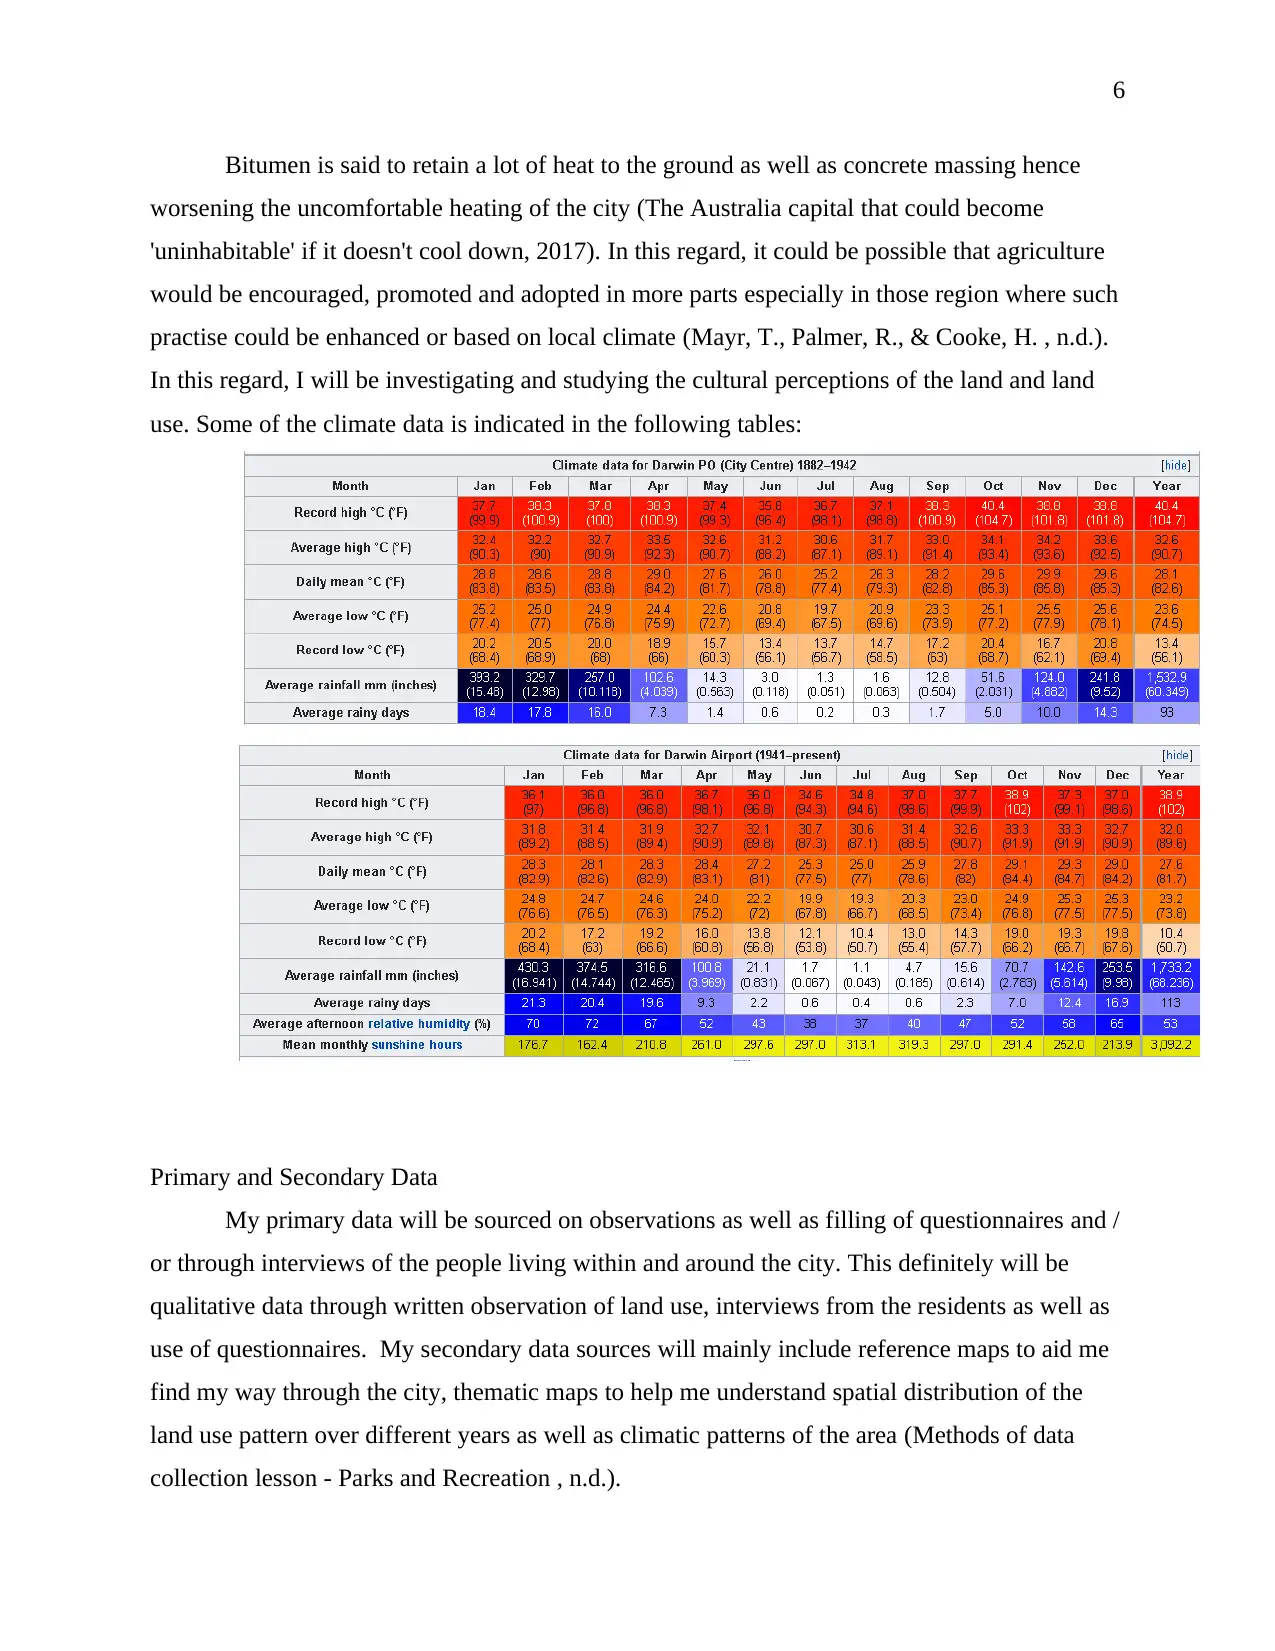
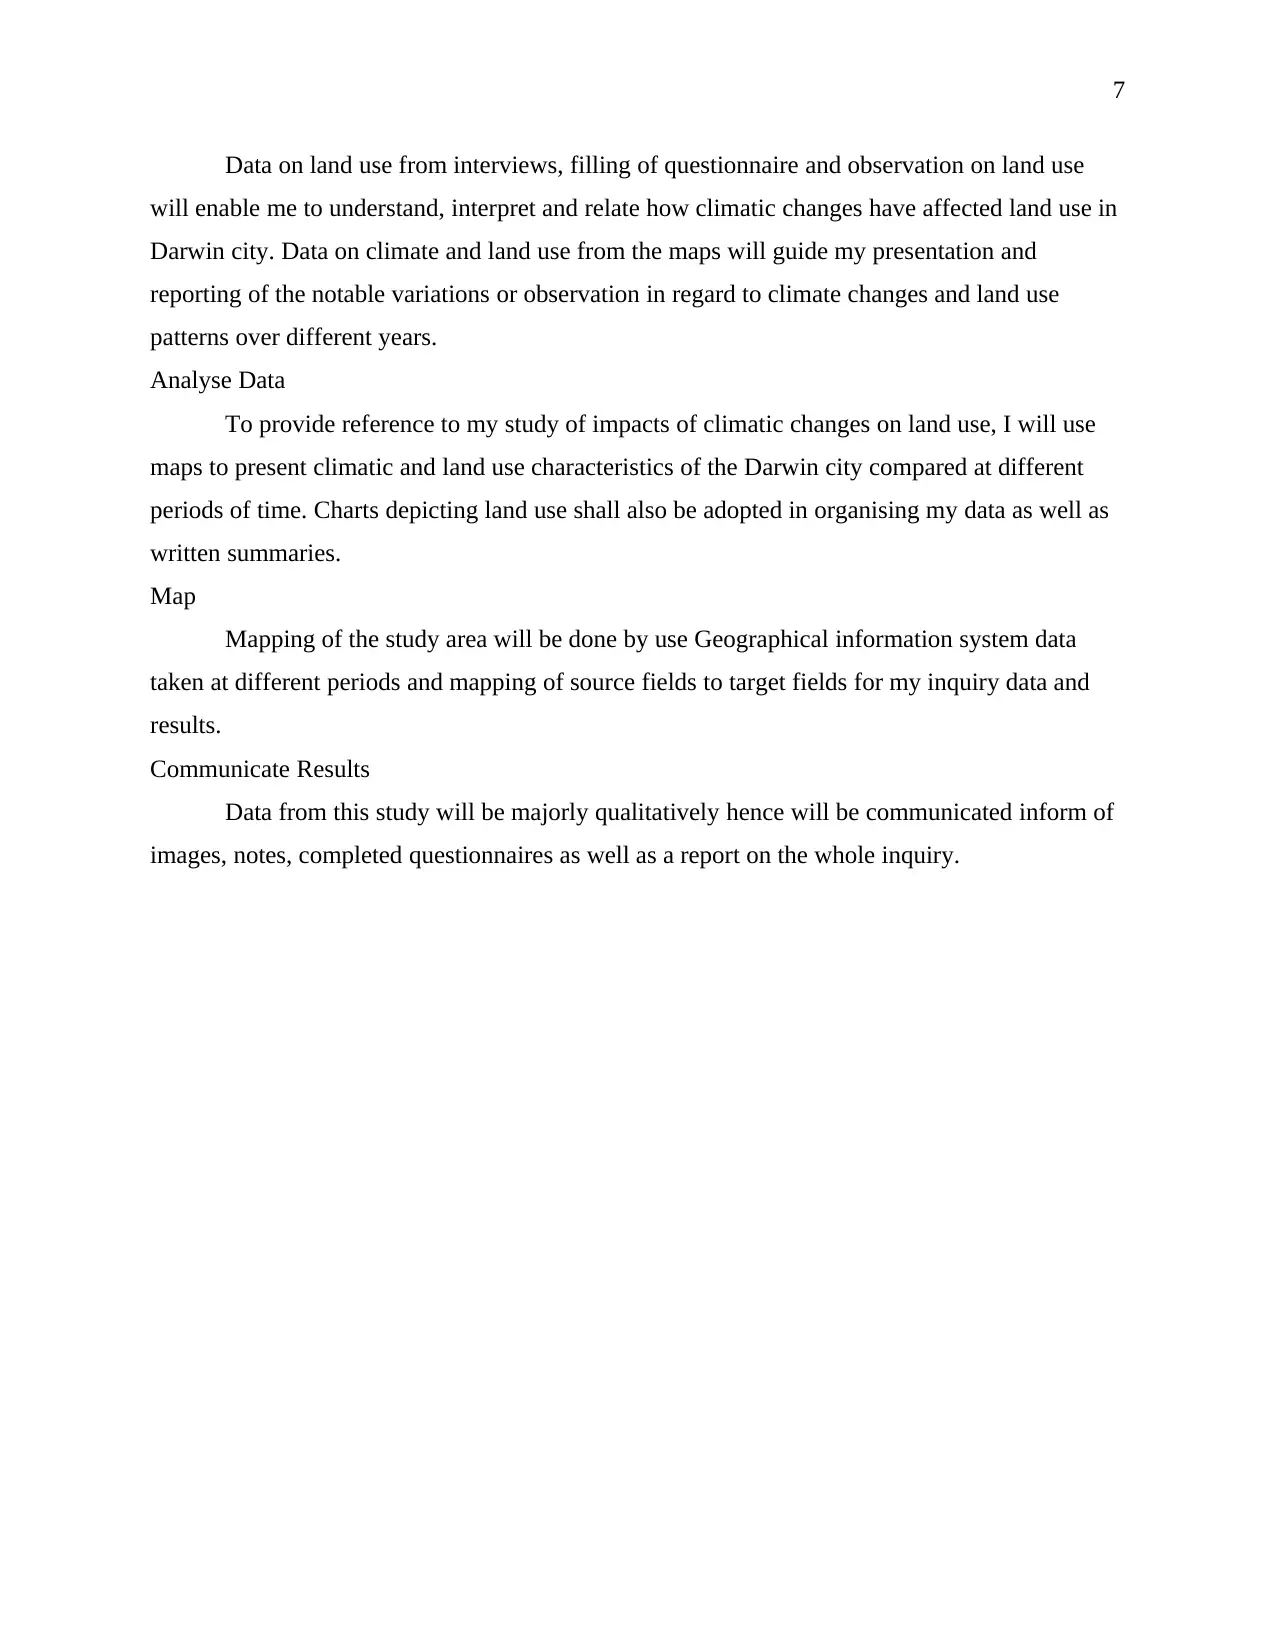
This assignment details a geographic inquiry into the impacts of climate change on land use in Darwin City, Australia. The study begins with a background on Darwin's location, climate, and history, highlighting its vulnerability to climate change, including heatwaves, humidity, and cyclone activity. The core of the inquiry focuses on the geographic question: How has climate change impacted land use in Darwin city? The student plans to investigate varying cultural perceptions of land use, comparing urbanization and agriculture. The methodology involves collecting primary data through observations, questionnaires, and interviews, alongside secondary data from maps and climate records. Data analysis will involve mapping, charts, and written summaries to communicate results effectively. The project aims to understand how climatic changes have affected land use patterns over time, providing insights into the city's environmental challenges and potential solutions. The inquiry is planned as a precursor to a more comprehensive investigation, with feedback from this assignment informing the execution of the actual inquiry in a subsequent assignment.
Document Page
Assignment 2: Develop and Plan a Geographic Inquiry
Student Name:
Student Number:
Title
Geographic inquiry on Darwin’s city climate change.
Background to study
According to LatLong.net, a latitude and longitude finder, the city of Darwin lies at
12.4634° S, 130.8456° E. Darwin city is known to be the capital Australia’s Northern territory
and was formerly a frontier outpost and is currently a home to a population of 136,245 persons
with an estimates area of 3,163.8 km2 (1,221.6 sq. mi) (2011 urban). The city is characterized by
dry and wet seasons with the latter being associated with cyclone activity and heavy monsoon
and lightning. This city is the ancestral home of the Larrakia people with the settlement being
popularly known as Palmerston town as earlier as 1859 before the city’s renaming to Darwin city
in 1911 (Russell, 2016). Notably, Darwin city has been built as much as much as four times
before. In the Second World War, the city was hit by an air raid from Japan, hence necessitating
its construction. Tracy Cyclone hit in 1837, 1937 and 1974 subsequently resulted in
reconstruction of the city. Presently, the city have recorded ever escalation in deadly mix of
heatwaves and humidity which is projected to in time make the city unsuitable for habitation
(Terzon, & ABC Radio Darwin, 2016). This has been attributed to climate change within the
region. This observation continues to have a greater bearing on physical, cultural and
environmental aspects of Geography within and around the city hence the need for this inquiry.
Darwin city map is as shown:
tabler-icon-diamond-filled.svg

Secure Best Marks with AI Grader

Need help grading? Try our AI Grader for instant feedback on your assignments.
Document Page
2
The Northern Territory is limited by the Timor and Arafura seas toward the north and by
Western Australia toward the west, Queensland and the Gulf of Carpentaria toward the east, and
South Australia toward the south. It is around 1,000 miles (1,600 km) from north to south and
600 miles (970 km) from east to west and possesses more than one-6th of the Australian
landmass (Darwin, Northern Territory, 2018). Some of these features area as shown in the map
that follows:
Document Page
3
Darwin city is to a great extent tropical in the north and semiarid in the far south. This is depicted
as below;
Historically, Darwin city relied on mining as the main economic activity. Poor soils and
unfavorable climate makes agriculture not a common alternative within and around the city.
The areas coastline configuration has been defined as on similar gradient with low
headlands and with mangrove swamps common at its borders. Significant islands along the
Document Page
4
coastline include the Bathurst, Melville and the Groote Eylandt. Southward heading towards the
Tenant Creek town at a critical elevation estimated at three hundred to six hundred meters of the
Precambrian shake which extends both west and south into the nearby states. Alice Springs is
situated in the Mac Donnell Ranges, the area popularly occurring alluvial soils. From this point,
Mount Zeil is placed at 1511 meters above the seal level and has been identified as an equally
popular spot within the region (Geographical Information, n.d.).
There are astounding tors (unmistakable rough slopes) two hundred miles (three hundred
and twenty kilometers) southwest of Alice Springs, including Mount Olga occurring at three
thousand five hundred and seven feet [one thousand and sixty nine meters]). This defines the
pinnacle of Kata Tjuta (the Olgas), a gathering of somewhere in the range of 30 stone
monuments and arches, and Uluru/Ayers Rock, a red, ovoid stone monument ascending to a rise
of two thousand eight hundred and forty four feet (eight hundred and sixty seven meters). In the
southeastern corner of this region occurs a great extent desolate Simpson Desert. Simpson Desert
reaches out into the neighboring conditions of Queensland and part of South Australia. Toward
the north of the Simpson besides furthermore extending into Queensland lies the Barkly
Tableland, a verdant highlands by a normal height of a thousand feet (three hundred meters)
(Devine, 2004).
Geographic Question
How has climatic changes impacted land use In Darwin city?
Investigating varying cultural perceptions of the land and land use
The main perception of land use that will encompass my basis of inquiry will include
different land use between urbanisation and agricultural. Based on recent developments, there
has been resentment on increased urbanisation through development of new settlement and
intensive real estate development mainly to accommodate tourism sector within the city as well
as improve local rural settlement. Also, there have been plans to adopt other modes of
development, for instance use of asphalt to tarmac roads as opposed to bitumen which has been
reported to contribute to the soaring heating within the city (Taylor & Powell, 2018). As of 2012,
October, the median mean temperatures were depicted as shown.
tabler-icon-diamond-filled.svg

Secure Best Marks with AI Grader

Need help grading? Try our AI Grader for instant feedback on your assignments.
Document Page
5
Document Page
6
Bitumen is said to retain a lot of heat to the ground as well as concrete massing hence
worsening the uncomfortable heating of the city (The Australia capital that could become
'uninhabitable' if it doesn't cool down, 2017). In this regard, it could be possible that agriculture
would be encouraged, promoted and adopted in more parts especially in those region where such
practise could be enhanced or based on local climate (Mayr, T., Palmer, R., & Cooke, H. , n.d.).
In this regard, I will be investigating and studying the cultural perceptions of the land and land
use. Some of the climate data is indicated in the following tables:
Primary and Secondary Data
My primary data will be sourced on observations as well as filling of questionnaires and /
or through interviews of the people living within and around the city. This definitely will be
qualitative data through written observation of land use, interviews from the residents as well as
use of questionnaires. My secondary data sources will mainly include reference maps to aid me
find my way through the city, thematic maps to help me understand spatial distribution of the
land use pattern over different years as well as climatic patterns of the area (Methods of data
collection lesson - Parks and Recreation , n.d.).
Document Page
7
Data on land use from interviews, filling of questionnaire and observation on land use
will enable me to understand, interpret and relate how climatic changes have affected land use in
Darwin city. Data on climate and land use from the maps will guide my presentation and
reporting of the notable variations or observation in regard to climate changes and land use
patterns over different years.
Analyse Data
To provide reference to my study of impacts of climatic changes on land use, I will use
maps to present climatic and land use characteristics of the Darwin city compared at different
periods of time. Charts depicting land use shall also be adopted in organising my data as well as
written summaries.
Map
Mapping of the study area will be done by use Geographical information system data
taken at different periods and mapping of source fields to target fields for my inquiry data and
results.
Communicate Results
Data from this study will be majorly qualitatively hence will be communicated inform of
images, notes, completed questionnaires as well as a report on the whole inquiry.
tabler-icon-diamond-filled.svg

Paraphrase This Document

Need a fresh take? Get an instant paraphrase of this document with our AI Paraphraser
Document Page
8
References
Russell, L. (2016). Darwin, a city on the edge. Postcolonial Studies, 19(1), 97-99.
doi:10.1080/13688790.2016.1161576
Mayr, T., Palmer, R., & Cooke, H. (n.d.). Digital Soil Mapping Using Legacy Data in the
Eden Valley, UK. Digital Soil Mapping with Limited Data, 291-301.
doi:10.1007/978-1-4020-8592-5_25
Methods of data collection lesson - Parks and Recreation ... (n.d.). Retrieved October 12,
2018, from http://www.prm.nau.edu/prm447/methods_of_data_collection_lesson.htm
Devine, F. (2004, October 1). Brigadoon in the Kimberley. Quadrant.
Terzon, E., & ABC Radio Darwin. (2016, August 25). How will the next NT government
tackle Darwin development? Retrieved October 12, 2018, from
http://www.abc.net.au/news/2016-08-25/how-will-next-nt-government-develop-
darwin/7749102
Taylor, J., & Powell, A. W. (2018, October 08). Northern Territory. Retrieved October 12,
2018, from https://www.britannica.com/place/Northern-Territory
Darwin, Northern Territory. (2018). Retrieved October 12, 2018 from
https://www.latlong.net/place/darwin-northern-territory-5517.html
Geographical Information. (n.d.). Retrieved October 12, 2018, from
http://www.discoverdarwin.com/darwin/geography.html
chevron_up_icon
1 out of 8
circle_padding
hide_on_mobile
zoom_out_icon
logo.png

Your All-in-One AI-Powered Toolkit for Academic Success.

Available 24*7 on WhatsApp / Email

[object Object]