Dashboard Analysis: Performance Metrics & AI in Business Systems

Verified

Added on  2023/06/11

|7
|1491
|450
Report
AI Summary
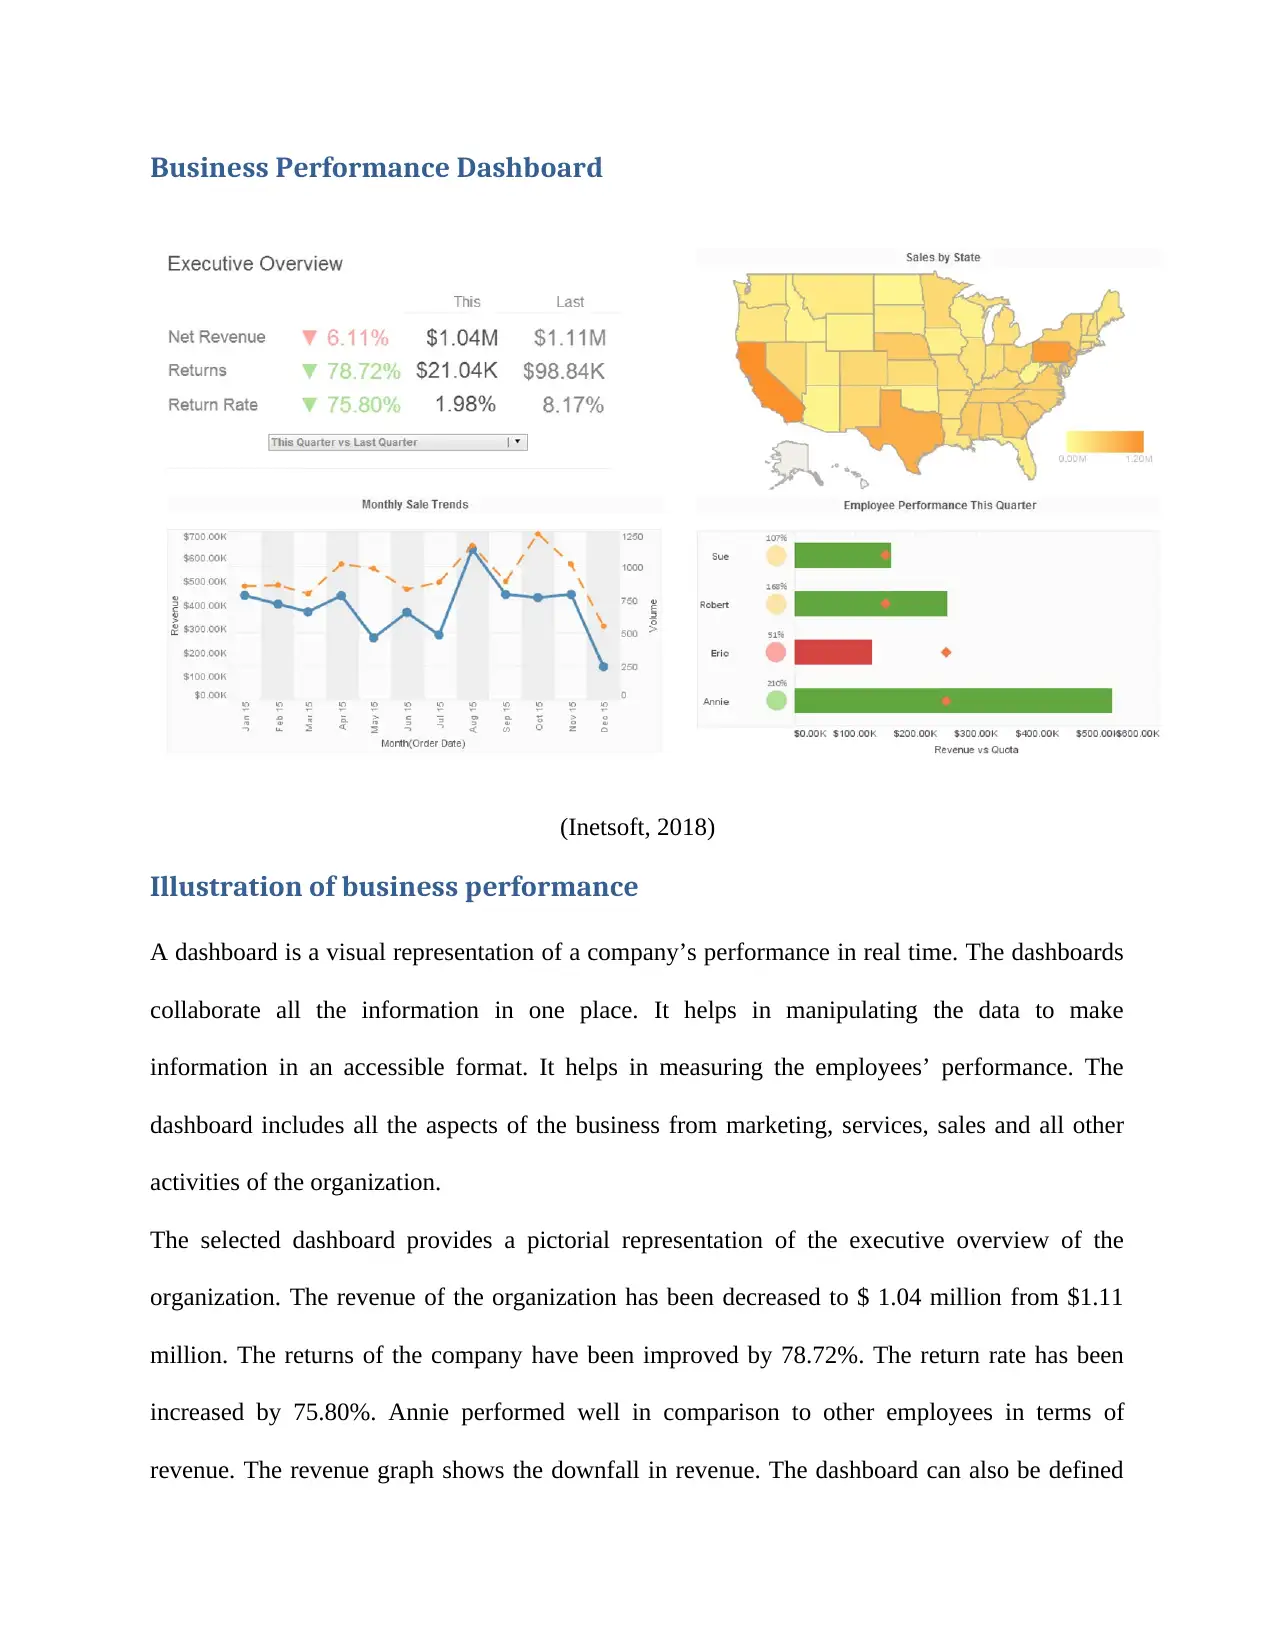
This report provides an analysis of a business performance dashboard, examining its illustration of business performance, the information it provides, visual objects used, and qualitative and quantitative measures reported. It includes a critique of the dashboard's design, suggesting improvements for effective visual data representation and consolidated data overview. Furthermore, the report discusses the importance of artificial intelligence in building smart systems, its role in transforming companies by improving communication, optimizing resource utilization, and automating tasks. It also addresses the limitations of smart systems, such as high implementation costs, maintenance challenges, and the lack of human-like creativity and common sense, while also highlighting the potential risks associated with the misuse of AI.
Document Page
Contents
Business Performance Dashboard...................................................................................................2
Illustration of business performance................................................................................................2
Information provided in the dashboard............................................................................................3
Visual objects used in the dashboard...............................................................................................3
Qualitative and Quantitative measures used in the dashboard........................................................4
Pitfalls in the dashboard design.......................................................................................................4
Ways to improve dashboard designs...............................................................................................4
Importance of Artificial system in building smart systems.............................................................5
Artificial intelligence in transforming companies...........................................................................5
Thread of artificial intelligence and the limitations of smart systems.............................................5
Bibliography....................................................................................................................................6
tabler-icon-diamond-filled.svg

Paraphrase This Document

Need a fresh take? Get an instant paraphrase of this document with our AI Paraphraser
Document Page
Business Performance Dashboard
(Inetsoft, 2018)
Illustration of business performance
A dashboard is a visual representation of a company’s performance in real time. The dashboards
collaborate all the information in one place. It helps in manipulating the data to make
information in an accessible format. It helps in measuring the employees’ performance. The
dashboard includes all the aspects of the business from marketing, services, sales and all other
activities of the organization.
The selected dashboard provides a pictorial representation of the executive overview of the
organization. The revenue of the organization has been decreased to $ 1.04 million from $1.11
million. The returns of the company have been improved by 78.72%. The return rate has been
increased by 75.80%. Annie performed well in comparison to other employees in terms of
revenue. The revenue graph shows the downfall in revenue. The dashboard can also be defined
Document Page
as the progress report of the organization. It provides the profitability details of an organization
(Ridd, 2015).
Information provided in the dashboard
The dashboard demonstrates measurable values of a company’s achievements. The dashboard
provides the marketing operational data. It helps in providing timely information to the
employees and all other key people of the organization. The business dashboard's valuable
information and overview of valuable numbers helps in making better analysis of the business
operations.
The dashboard provides all the information required by the managers in making decisions. The
dashboards information is related to sales, manufacturing, finance and human resources. The
dashboards help the employees in performing their activities efficiently. It includes the key
performance indicators of an organization. The selected dashboard provides the details related to
revenue, returns and rate of return of the organization.
The dashboard provides statewide sales information. It provides details of the sales fluctuations
on a monthly basis of the company. There is also information related to employee performance
quarterly. It helps in evaluating and presenting the company’s profitability (Smartsheet, 2018).
Visual objects used in the dashboard
The dashboard is a visual representation of contextual information about an organization’s
performance. The dashboard contains various visual implications to provide information more
attractively and efficiently. Various sheets, texts, images, graphs and other pictures are used to
prepare the dashboard.
The dashboard contains a table for the representation of revenue and rate of return. The
dashboard provides the sales information in an area graph format. The sales trends are shown in
Document Page
the form of a graph. The bar graph is used to provide information about the employees’
performance.
Qualitative and Quantitative measures used in the dashboard
The dashboards provide both qualitative and quantitative information about an organization. The
qualitative aspect of the business performance dashboard helps in evaluating the individual
effectiveness and the team performance. It helps in evaluating the factors which help the
performance of employees. The qualitative aspects of the dashboard help in measuring the soft
side of an organization.
The quantitative measures of the dashboard involve the visual representation of numeric data. It
includes data like revenue, sales data or loss. It helps in measuring the performance of the
organization in an adequate manner. It includes the numbers indicating the sales and other profit
generating activities. The number of employees can be tracked to evaluate the performance. It
involves the sales fluctuations in a graph format.
Pitfalls in the dashboard design
In designing the dashboard useless decoration is made on the screen. The unappealing visual
display sometimes becomes a major drawback for the dashboard. The design does not provide
the right contextualization. The dashboard does not include the comparison values. The
complexity of the chart creates the need for the users to make an extra effort in understanding the
dashboards. Data is fragmented into segments in separate screens. The use of graphs or pictures,
where tables would work more efficiently (Hennel, 2018).
tabler-icon-diamond-filled.svg

Paraphrase This Document

Need a fresh take? Get an instant paraphrase of this document with our AI Paraphraser
Document Page
Ways to improve dashboard designs
Effective visual designs should be understood to create an effective dashboard. It should provide
accurate visual data reflecting the values. An accurate chart communicating the dataset message
effectively should be used (Few, 2006).
The dashboard should provide the complete data on a single screen. It should provide a
consolidated overview of the data. The designer should show the data that viewers need to see
and intend to use. The emphasis should be on the data that is most important to the viewers by
using color highlights or graphical formats etc. (Pal, 2016)
Importance of Artificial system in building smart systems
Artificial intelligence helps business organizations in improving the communication by
improving individual personalization. It helps in enhancing the focus and increase the
productivity of a firm. Artificial intelligence provides ways to boost the organization’s sales
channels. It helps organizations in optimum utilization of resources. It helps in preventing
medical errors by providing clinical decision support and documenting events in real time. It
helps in removing the cognitive burden of doctors and nurses and increases their confidence. It
helps in enhancing e-commerce business by organizing the visual searches content.
Artificial intelligence in transforming companies
Artificial intelligence will be able to perform various tasks in an organization. It is helpful in
determining the optimal routes. It helps in providing customized experience to the customers. It
helps in developing more holistic platforms. AI has given rise to automation of work. Robots
have replaced the human labor which has reduced the excessive cost of the company. It helps the
organizations and researchers in accessing greater amounts of data (West & Allen, 2018).
Document Page
Thread of artificial intelligence and the limitations of smart systems
The implementation of smart systems requires huge costs as they are complex machines. The
repair and maintenance cost of such machines is also high. The machines are able to perform
repeatable tasks. They can be used in routine works to increase the productivity. The
organization cannot rely for educational oversights of the machines. They cannot be creative like
humans. They do not have common sense like humans. The machine can lead to destruction if
controlled by the wrong people. It inherits the risk of transparency in operations. The use of AI
by wrong people is like a threat to the society. AI could be the cause of extinction of humans on
earth (Alrawashdeh, 2018).
Bibliography
Alrawashdeh, A. (2018) What are the advantages and disadvantages of artificial intelligence?
[Online] Available at:
https://www.researchgate.net/post/What_are_the_advantages_and_disadvantages_of_artificial_in
telligence [Accessed 29 May 2018].
Few, S. (2006) Common Pitfaals in Dashboard Design [online]. Available from:
https://www.perceptualedge.com/articles/Whitepapers/Common_Pitfalls.pdf [Accessed 29 May
2018].
Hennel, P. (2018) Dashboard Design: 5 Pitfalls to Avoid [online]. Available from:
https://www.silvon.com/blog/dashboard-design-5-pitfalls-avoid/ [Accessed 29 May 2018].
Inetsoft (2018) Executive Sales dashboard [online]. Available from:
https://www.inetsoft.com/info/performance_dashboard_examples/ [Accessed 29 May 2018].
Pal, P. (2016) 15 Common Dashboard Design Mistakes [online]. Available from:
https://think360studio.com/15-common-dashboard-design-mistakes/ [Accessed 29 May 2018].
Ridd, C. (2015) Harness the power of Big Data for your small business with the Business
Performance Dashboard [online]. Available from: https://www.xero.com/blog/2015/11/harness-
power-big-data-small-business-business-performance-dashboard/ [Accessed 29 May 2018].
Document Page
Smartsheet (2018) Everything You Need to Know About Executive Dashboards [online].
Available from: https://www.smartsheet.com/everything-you-need-know-about-executive-
dashboards [Accessed 29 May 2018].
West, D.M. & Allen, J.R. (2018) How artificial intelligence is transforming the world [online].
Available from: https://www.brookings.edu/research/how-artificial-intelligence-is-transforming-
the-world/ [Accessed 29 May 2018].
chevron_up_icon
1 out of 7
circle_padding
hide_on_mobile
zoom_out_icon
[object Object]