Data Analytics Report: Analysis of Airline Market Share and Trends

Verified

Added on  2022/12/30

|6
|744
|21
Report
AI Summary
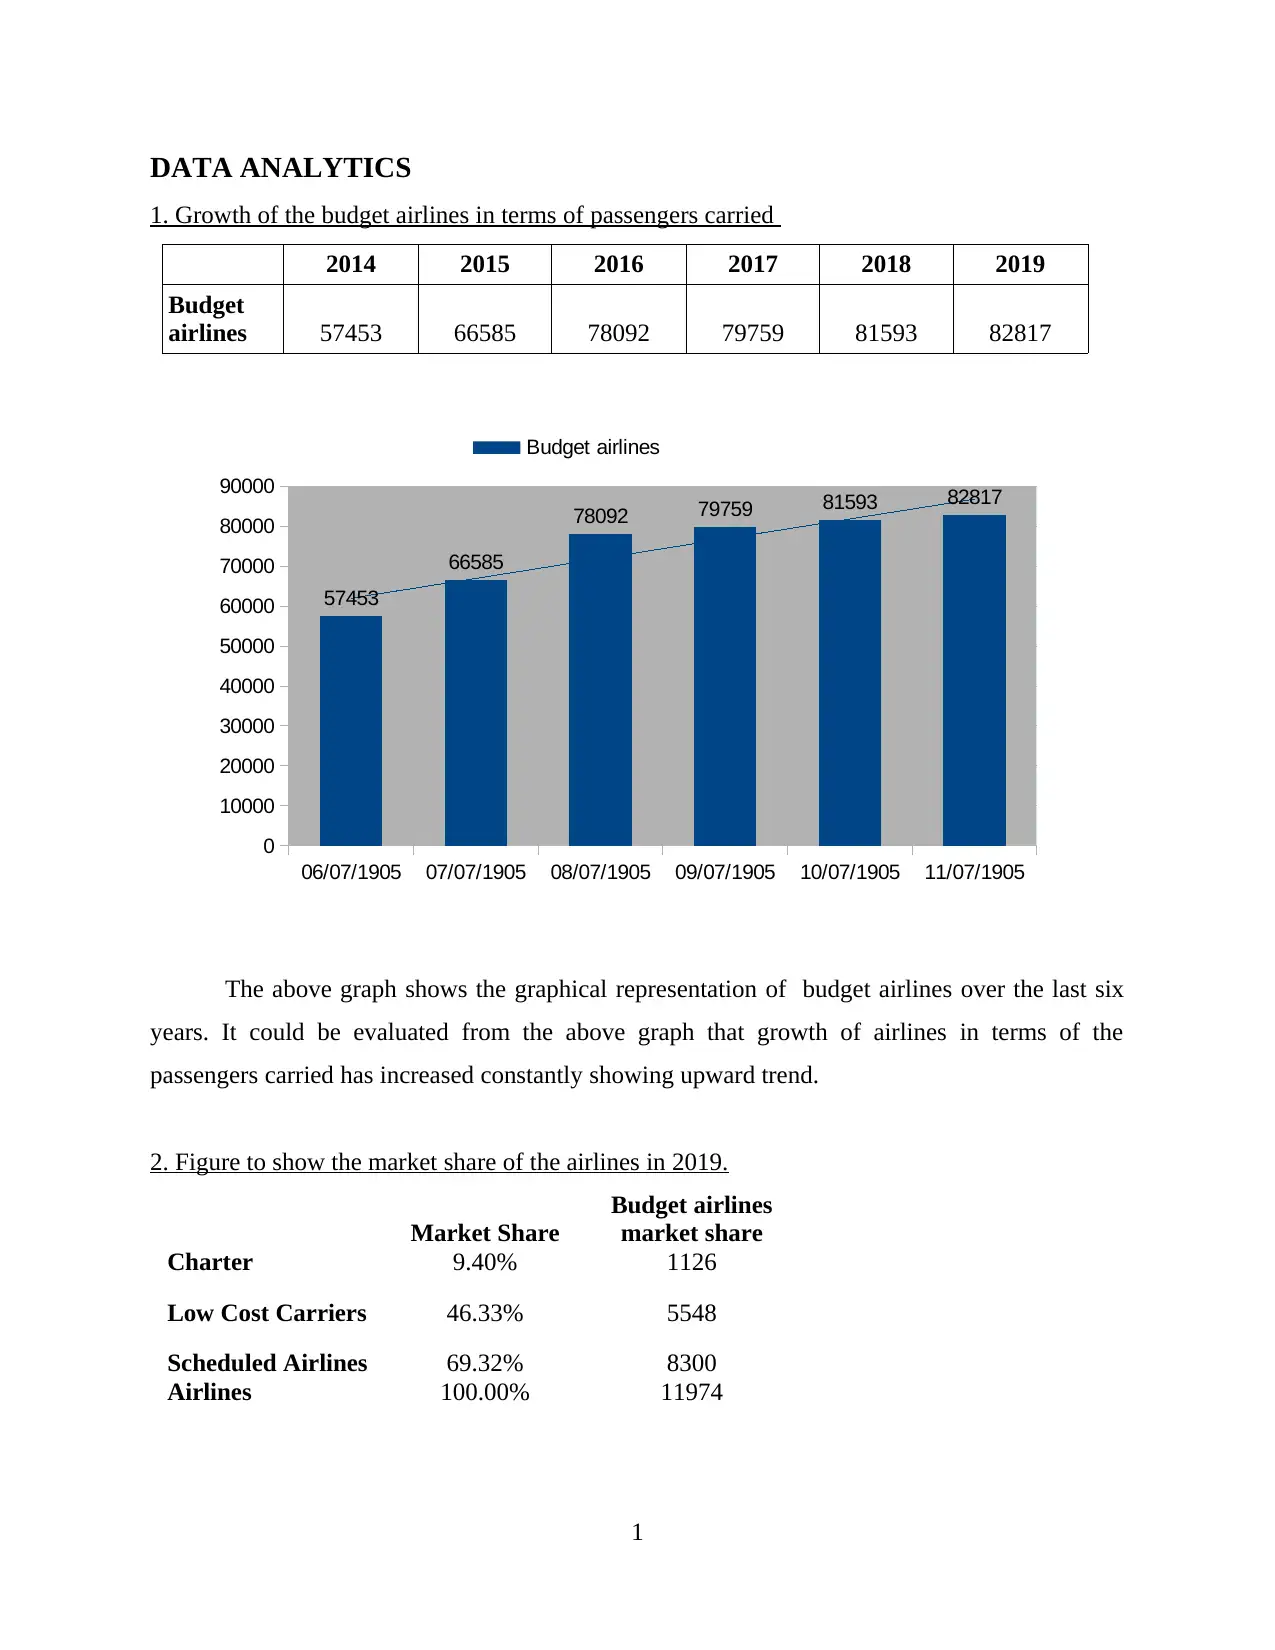
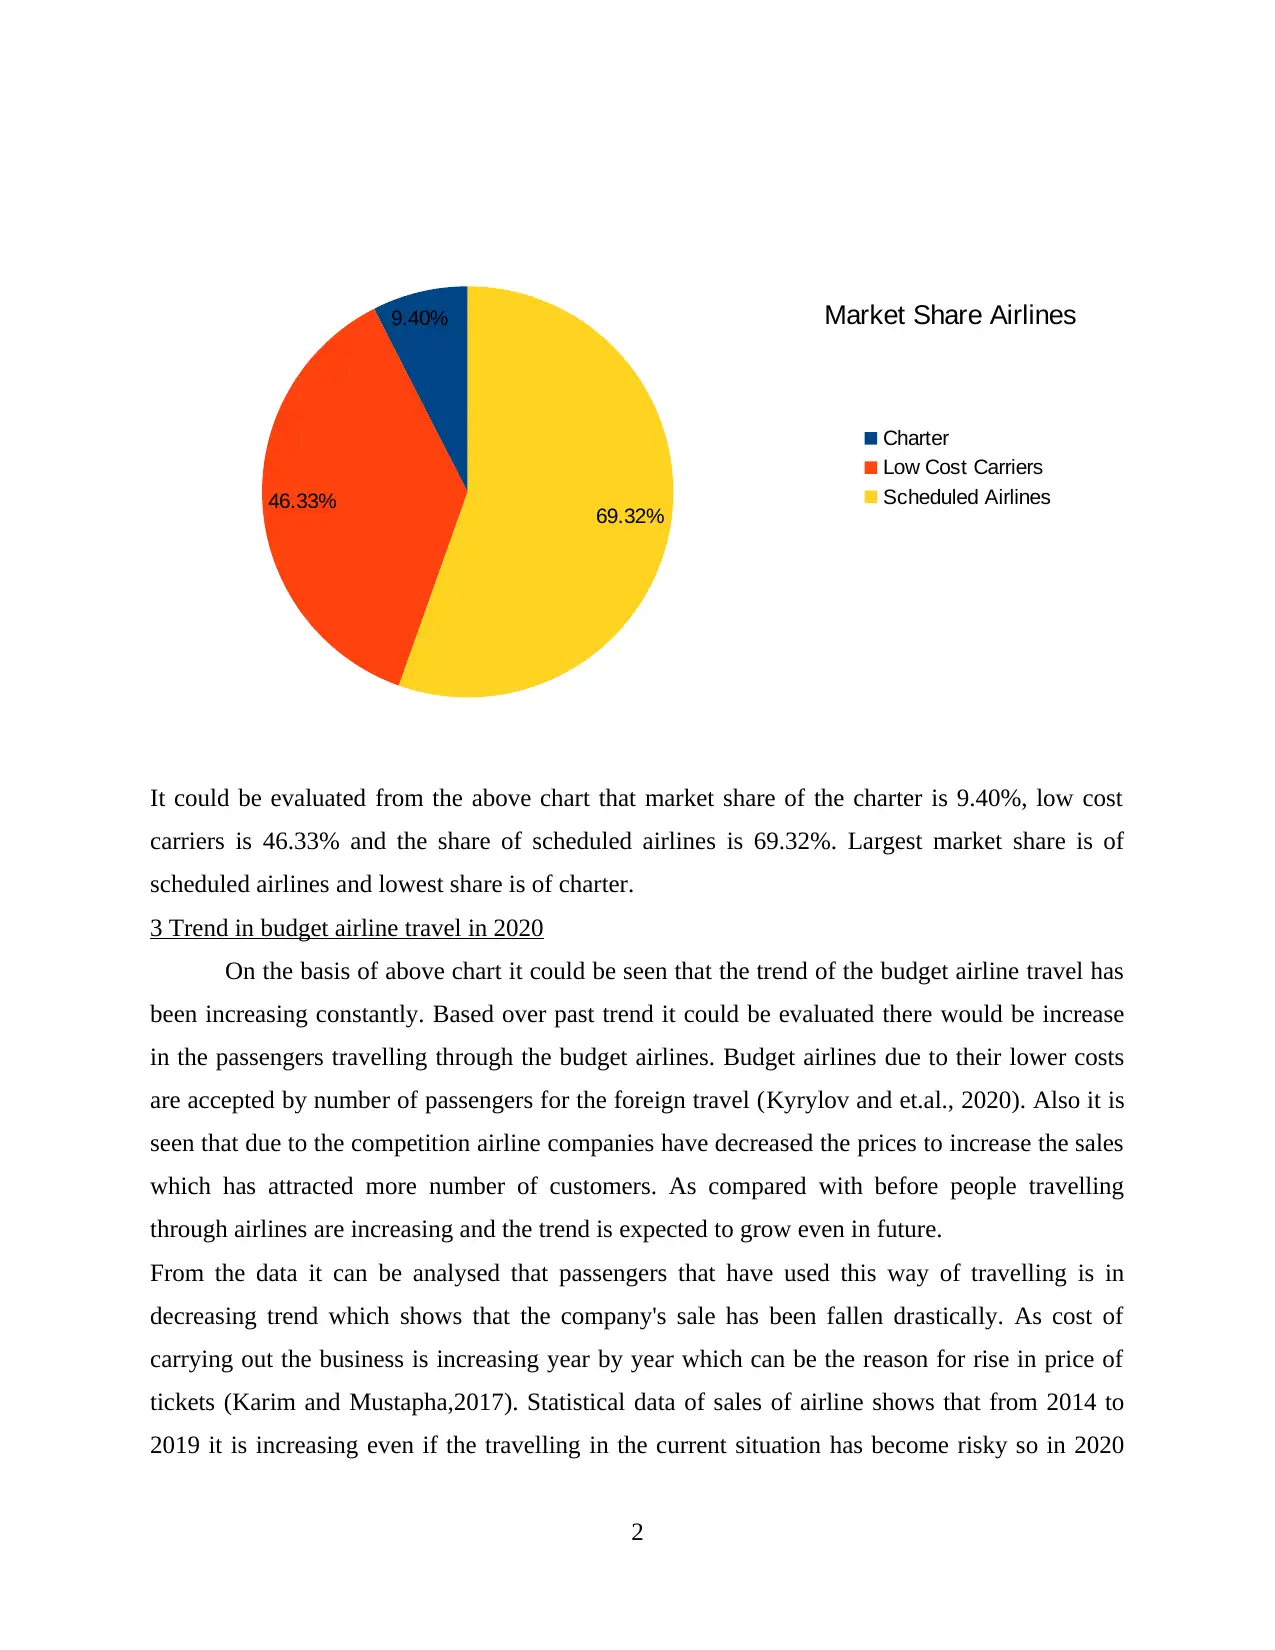
This data analytics report examines the growth of budget airlines from 2014 to 2019, presenting passenger data in a graphical format showing a consistent upward trend. The report also includes a chart illustrating the market share of different airline types in 2019, with scheduled airlines holding the largest share. Further analysis explores the trends in budget airline travel, projecting continued growth based on historical data and the impact of lower costs and competition. The report analyzes the impact of these trends, discusses potential strategies for airlines to improve performance, and references relevant academic sources. The analysis includes considerations for the impact of rising business costs and the importance of strategies such as improved check-in times and food services to maintain a competitive edge in the market. The report also examines the sales statistics, market share and passenger data to make predictions about the future of the airline industry.
Document Page
DATA ANALYTICS
tabler-icon-diamond-filled.svg

Paraphrase This Document

Need a fresh take? Get an instant paraphrase of this document with our AI Paraphraser
Document Page
TABLE OF CONTENTS
INTRODUCTION...........................................................................................................................1
MAIN BODY...................................................................................................................................1
CONCLUSION................................................................................................................................1
REFERENCES................................................................................................................................2
Document Page
DATA ANALYTICS
1. Growth of the budget airlines in terms of passengers carried
2014 2015 2016 2017 2018 2019
Budget
airlines 57453 66585 78092 79759 81593 82817
The above graph shows the graphical representation of budget airlines over the last six
years. It could be evaluated from the above graph that growth of airlines in terms of the
passengers carried has increased constantly showing upward trend.
2. Figure to show the market share of the airlines in 2019.
Market Share
Budget airlines
market share
Charter 9.40% 1126
Low Cost Carriers 46.33% 5548
Scheduled Airlines 69.32% 8300
Airlines 100.00% 11974
1
06/07/1905 07/07/1905 08/07/1905 09/07/1905 10/07/1905 11/07/1905
0
10000
20000
30000
40000
50000
60000
70000
80000
90000
57453
66585
78092 79759 81593 82817
Budget airlines
Document Page
It could be evaluated from the above chart that market share of the charter is 9.40%, low cost
carriers is 46.33% and the share of scheduled airlines is 69.32%. Largest market share is of
scheduled airlines and lowest share is of charter.
3 Trend in budget airline travel in 2020
On the basis of above chart it could be seen that the trend of the budget airline travel has
been increasing constantly. Based over past trend it could be evaluated there would be increase
in the passengers travelling through the budget airlines. Budget airlines due to their lower costs
are accepted by number of passengers for the foreign travel (Kyrylov and et.al., 2020). Also it is
seen that due to the competition airline companies have decreased the prices to increase the sales
which has attracted more number of customers. As compared with before people travelling
through airlines are increasing and the trend is expected to grow even in future.
From the data it can be analysed that passengers that have used this way of travelling is in
decreasing trend which shows that the company's sale has been fallen drastically. As cost of
carrying out the business is increasing year by year which can be the reason for rise in price of
tickets (Karim and Mustapha,2017). Statistical data of sales of airline shows that from 2014 to
2019 it is increasing even if the travelling in the current situation has become risky so in 2020
2
9.40%
46.33% 69.32%
Market Share Airlines
Charter
Low Cost Carriers
Scheduled Airlines
tabler-icon-diamond-filled.svg

Paraphrase This Document

Need a fresh take? Get an instant paraphrase of this document with our AI Paraphraser
Document Page
from the historical statistic data it can be interpreted that online sales will go in upward direction.
Competition in the industry is high as the data represents that the competing companies
are growing better as compared to Airlines Company but in data, details of its sales are given in
good condition so according to me the company have more scope to grow in 2020 also as it is a
reputed company so it has become first choice of some customer to travel so its sales and
passenger carrying proportions can again increase. The company can take several major actions
to improve its performance (Qin, 2020). Like check in time should be earlier half an hour only
rather than wasting time of passengers for two three hours, good quality food services, and it can
also increase sale by avoiding discount schemes so that can gain more profit on each ticket. As
the airlines have various strategies to cope up with every situation as it's a leading company in
industry.
3
Document Page
REFERENCES
Books and Journals
Karim, Y. F. A. and Mustapha, Y. A. A., 2017. Factors Affecting Leverage Among Asean
Airlines Company. Advanced Science Letters. 23(9). pp.8438-8441.
Kyrylov, Y., and et.al., 2020. International Tourism Development in the Context of Increasing
Globalization Risks: On the Example of Ukraine’s Integration into the Global Tourism
Industry. Journal of Risk and Financial Management. 13(12). p.303.
Qin, T., 2020, September. Elevating Value Marketing Strategies in Singapore Airlines Driven by
Macro and Micro Environment. In The 3rd International Conference on Economy,
Management and Entrepreneurship (ICOEME 2020) (pp. 271-279). Atlantis Press.
4
chevron_up_icon
1 out of 6
circle_padding
hide_on_mobile
zoom_out_icon
[object Object]