Data Analysis and Forecasting Report: Central Tendency & Regression
VerifiedAdded on 2022/12/28
|9
|1710
|89
Report
AI Summary
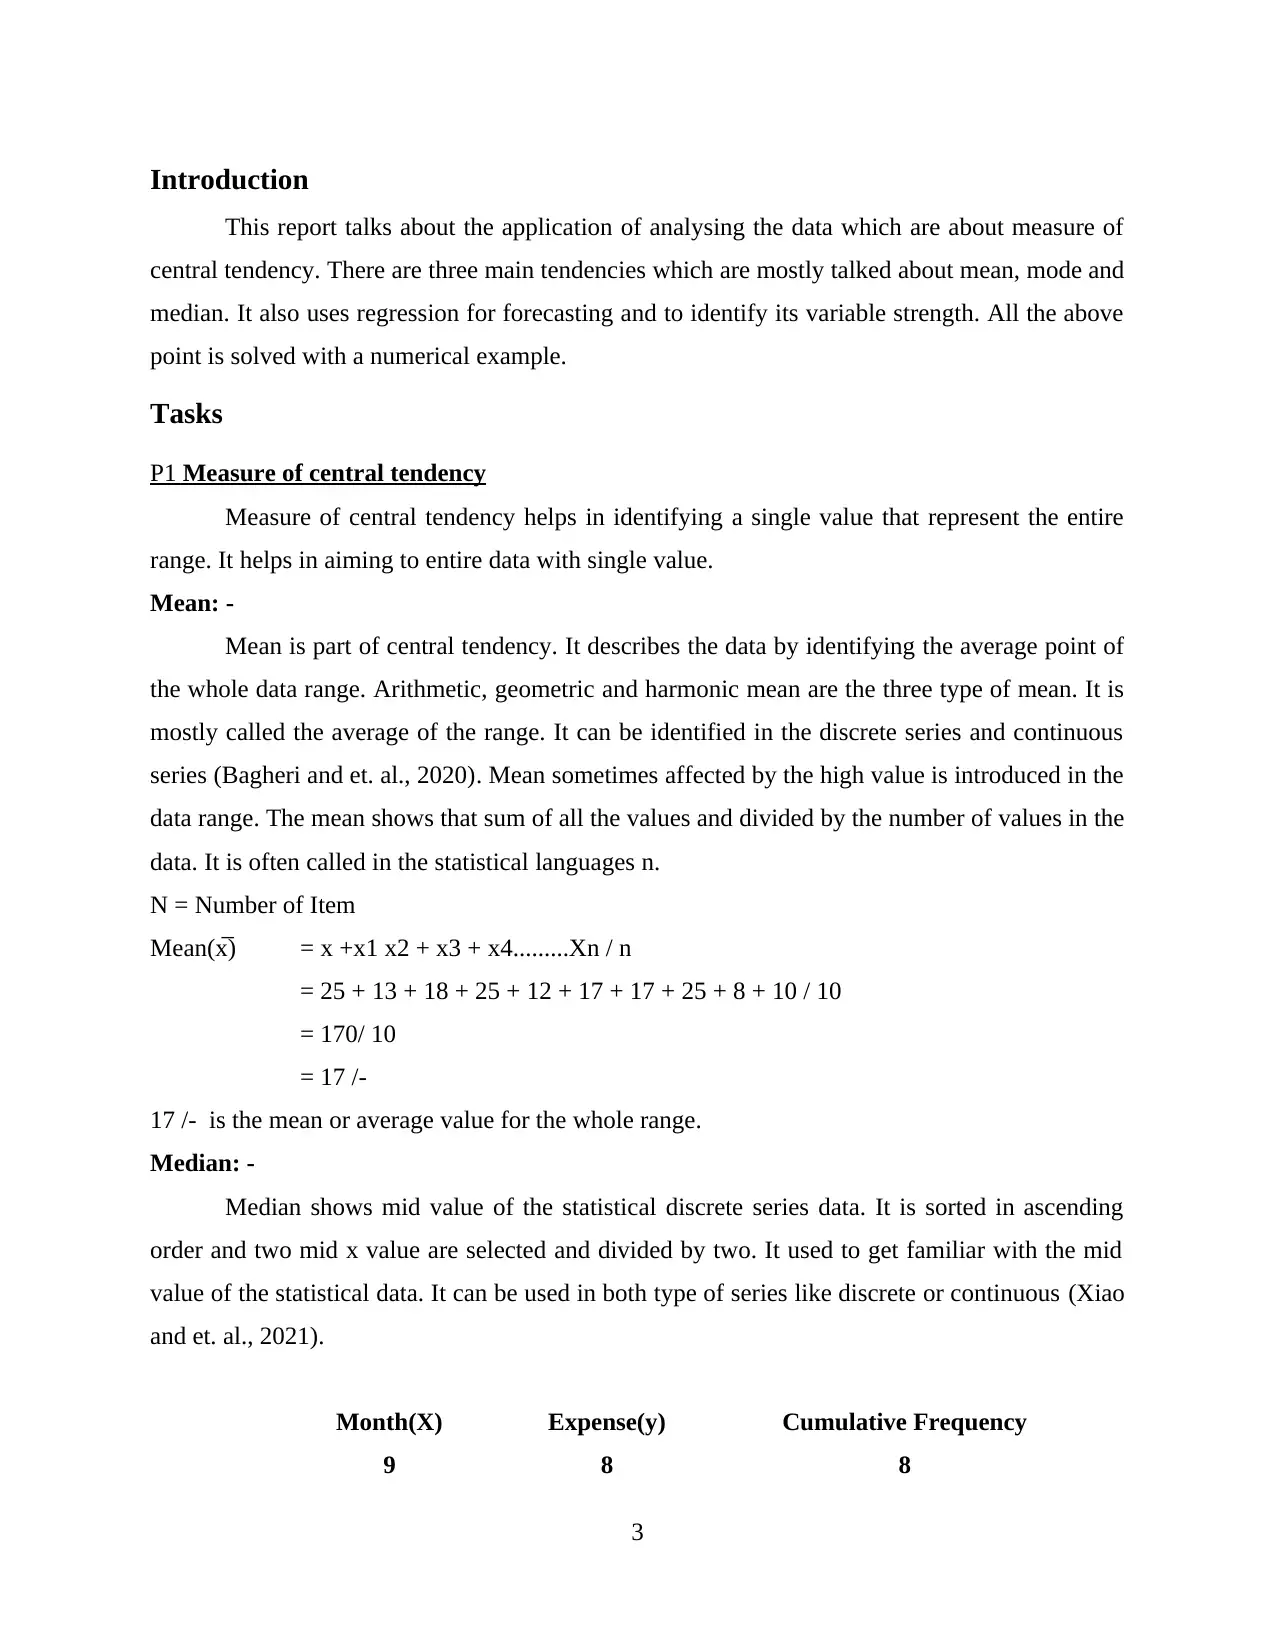
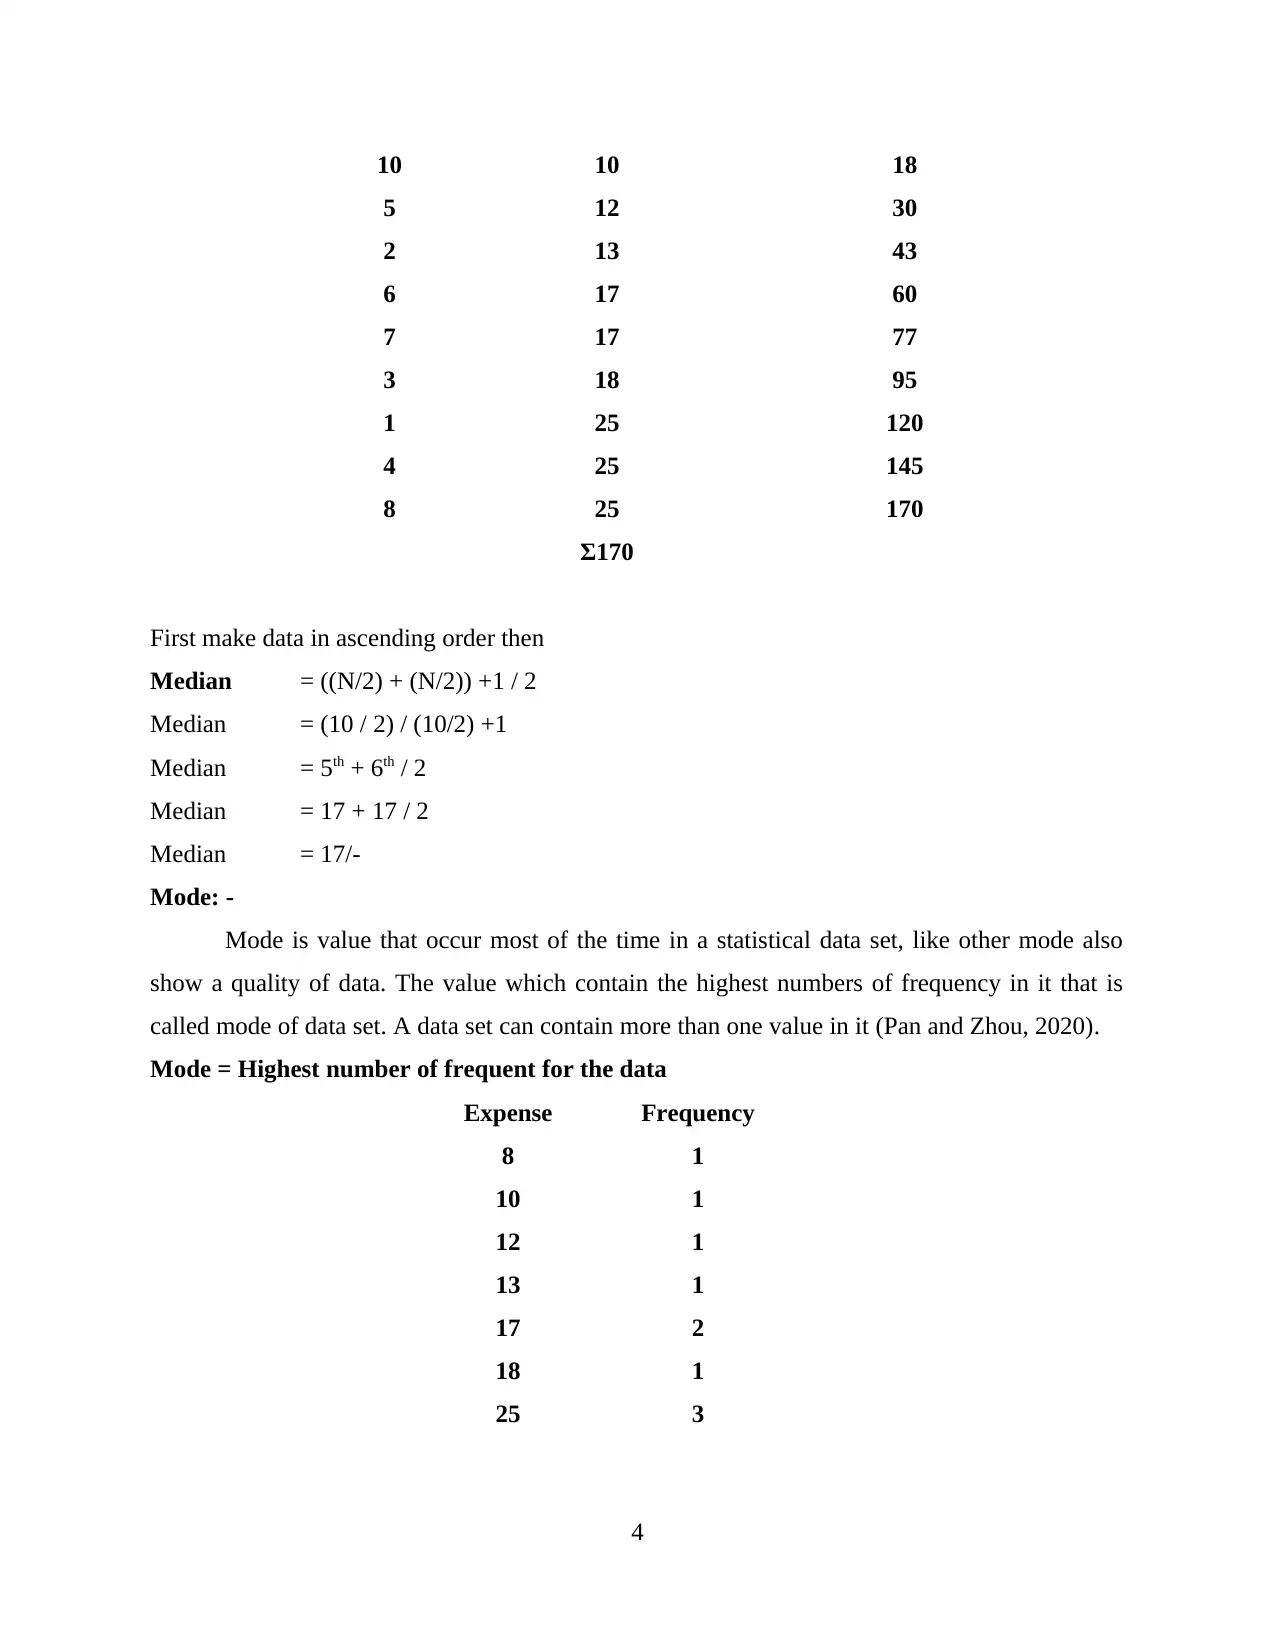
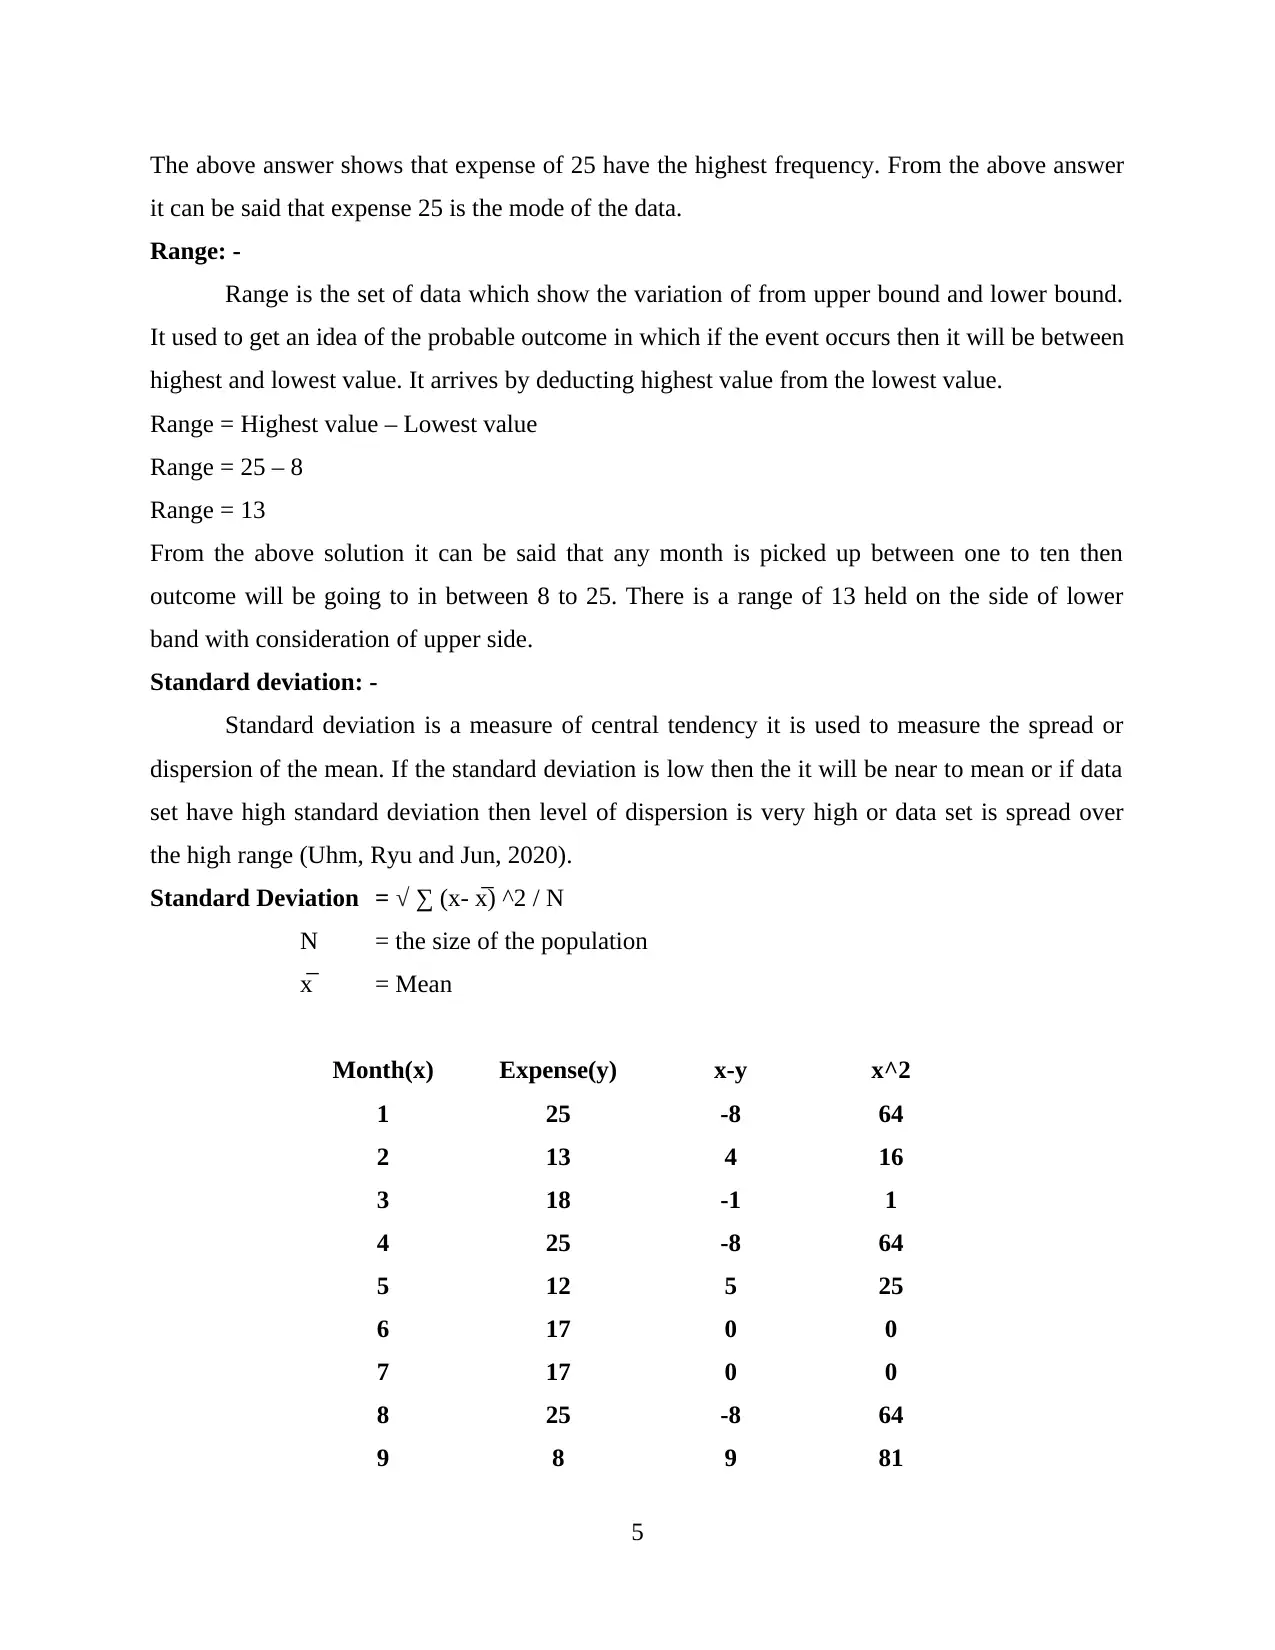
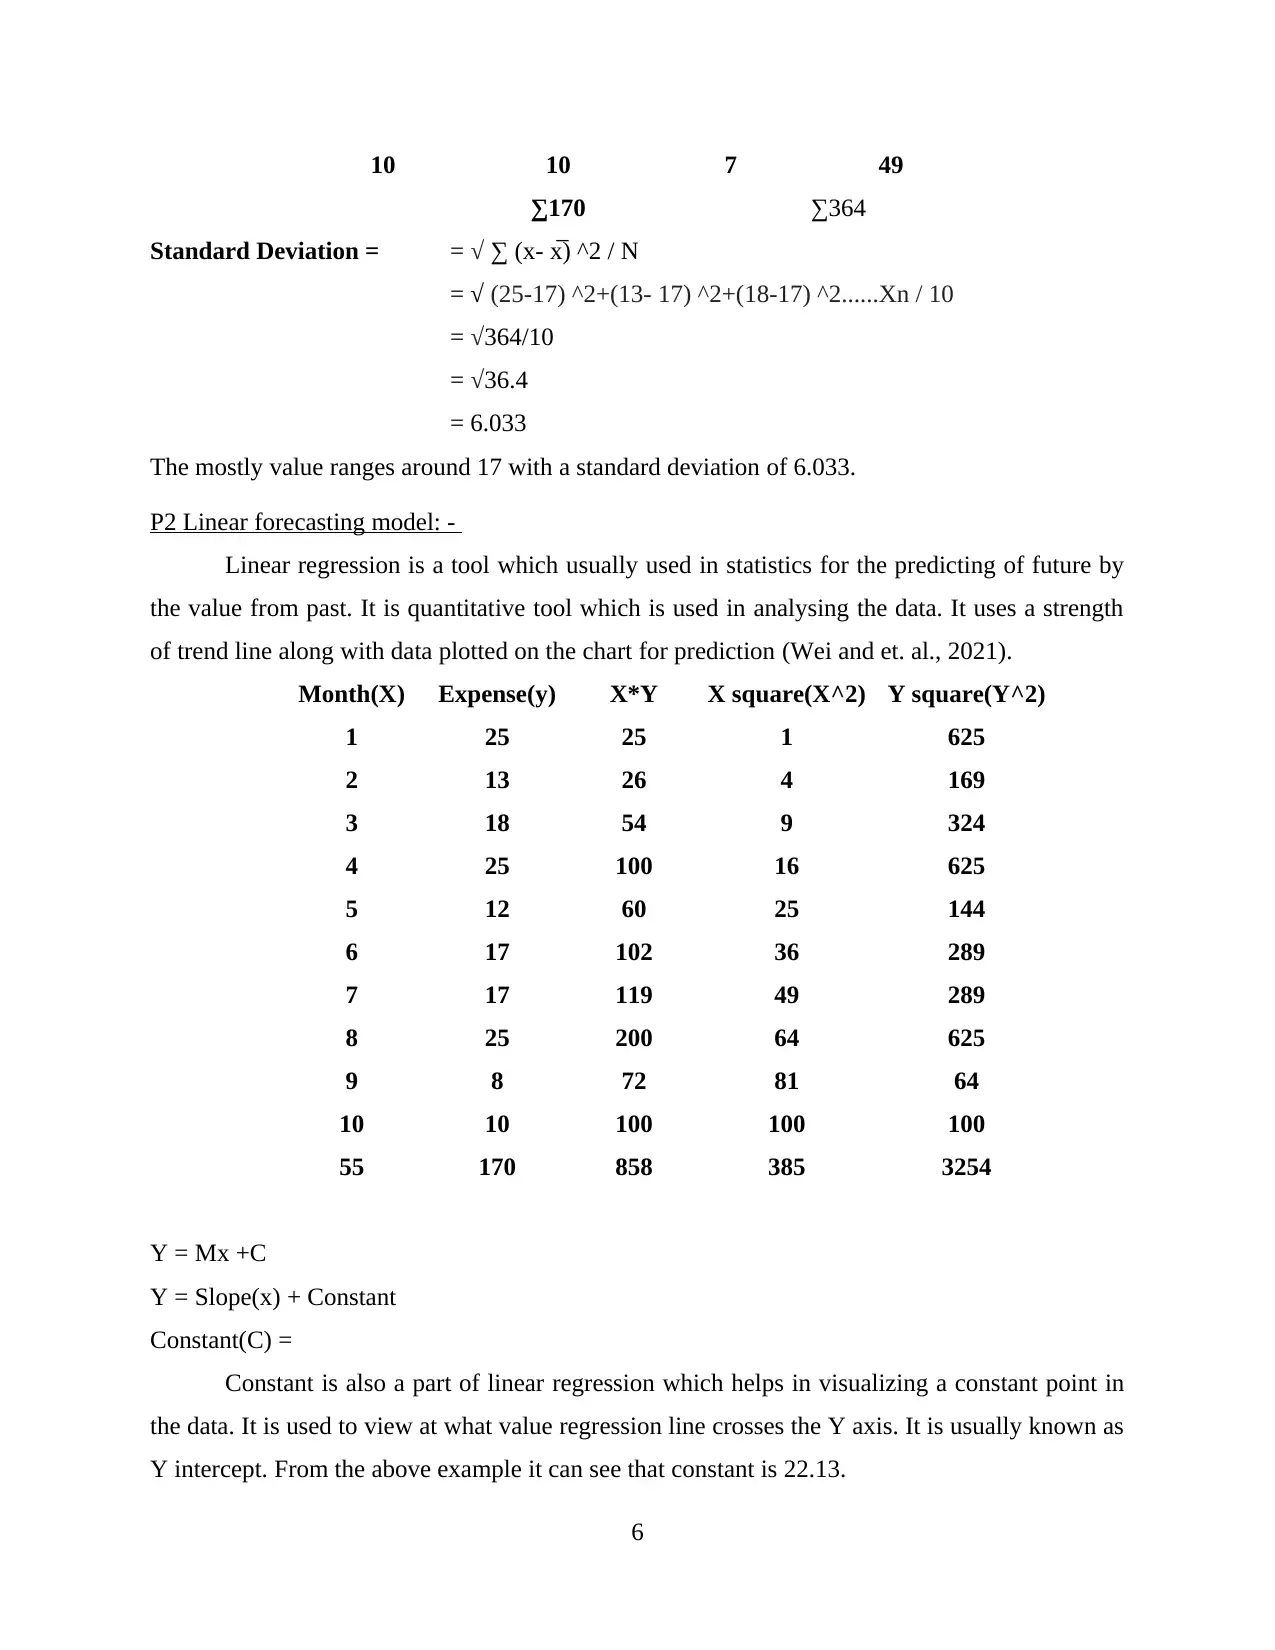
This report provides an in-depth analysis of data using statistical methods and forecasting techniques. It begins by exploring measures of central tendency, including mean, median, mode, range, and standard deviation, and applies these concepts to a numerical example involving monthly expenses. The report then delves into linear forecasting models, specifically linear regression, explaining how it can be used to predict future values based on historical data. It details the components of linear regression, such as the constant and slope, and demonstrates their calculation using the provided expense data. The report concludes by forecasting expenses for future months, highlighting the practical application of these statistical tools. The report also includes a reference section with relevant sources.

Data Analysis and
Forecasting
1
Forecasting
1
Paraphrase This Document
Need a fresh take? Get an instant paraphrase of this document with our AI Paraphraser

Table of Contents
Introduction......................................................................................................................................3
Tasks ...............................................................................................................................................3
P1 Measure of central tendency..................................................................................................3
P2 Linear forecasting model:- ....................................................................................................5
Conclusion ......................................................................................................................................7
Reference ........................................................................................................................................8
2

Introduction
This report talks about the application of analysing the data which are about measure of
central tendency. There are three main tendencies which are mostly talked about mean, mode and
median. It also uses regression for forecasting and to identify its variable strength. All the above
point is solved with a numerical example.
Tasks
P1 Measure of central tendency
Measure of central tendency helps in identifying a single value that represent the entire
range. It helps in aiming to entire data with single value.
Mean: -
Mean is part of central tendency. It describes the data by identifying the average point of
the whole data range. Arithmetic, geometric and harmonic mean are the three type of mean. It is
mostly called the average of the range. It can be identified in the discrete series and continuous
series (Bagheri and et. al., 2020). Mean sometimes affected by the high value is introduced in the
data range. The mean shows that sum of all the values and divided by the number of values in the
data. It is often called in the statistical languages n.
N = Number of Item
Mean(x̅) = x +x1 x2 + x3 + x4.........Xn / n
= 25 + 13 + 18 + 25 + 12 + 17 + 17 + 25 + 8 + 10 / 10
= 170/ 10
= 17 /-
17 /- is the mean or average value for the whole range.
Median: -
Median shows mid value of the statistical discrete series data. It is sorted in ascending
order and two mid x value are selected and divided by two. It used to get familiar with the mid
value of the statistical data. It can be used in both type of series like discrete or continuous (Xiao
and et. al., 2021).
Month(X) Expense(y) Cumulative Frequency
9 8 8
3
⊘ This is a preview!⊘
Do you want full access?
Subscribe today to unlock all pages.

Trusted by 1+ million students worldwide

10 10 18
5 12 30
2 13 43
6 17 60
7 17 77
3 18 95
1 25 120
4 25 145
8 25 170
Σ170
First make data in ascending order then
Median = ((N/2) + (N/2)) +1 / 2
Median = (10 / 2) / (10/2) +1
Median = 5th + 6th / 2
Median = 17 + 17 / 2
Median = 17/-
Mode: -
Mode is value that occur most of the time in a statistical data set, like other mode also
show a quality of data. The value which contain the highest numbers of frequency in it that is
called mode of data set. A data set can contain more than one value in it (Pan and Zhou, 2020).
Mode = Highest number of frequent for the data
Expense Frequency
8 1
10 1
12 1
13 1
17 2
18 1
25 3
4
Paraphrase This Document
Need a fresh take? Get an instant paraphrase of this document with our AI Paraphraser

The above answer shows that expense of 25 have the highest frequency. From the above answer
it can be said that expense 25 is the mode of the data.
Range: -
Range is the set of data which show the variation of from upper bound and lower bound.
It used to get an idea of the probable outcome in which if the event occurs then it will be between
highest and lowest value. It arrives by deducting highest value from the lowest value.
Range = Highest value – Lowest value
Range = 25 – 8
Range = 13
From the above solution it can be said that any month is picked up between one to ten then
outcome will be going to in between 8 to 25. There is a range of 13 held on the side of lower
band with consideration of upper side.
Standard deviation: -
Standard deviation is a measure of central tendency it is used to measure the spread or
dispersion of the mean. If the standard deviation is low then the it will be near to mean or if data
set have high standard deviation then level of dispersion is very high or data set is spread over
the high range (Uhm, Ryu and Jun, 2020).
Standard Deviation = √ ∑ (x- x̅) ^2 / N
N = the size of the population
x̅ = Mean
Month(x) Expense(y) x-y x^2
1 25 -8 64
2 13 4 16
3 18 -1 1
4 25 -8 64
5 12 5 25
6 17 0 0
7 17 0 0
8 25 -8 64
9 8 9 81
5

10 10 7 49
∑170 ∑364
Standard Deviation = = √ ∑ (x- x̅) ^2 / N
= √ (25-17) ^2+(13- 17) ^2+(18-17) ^2......Xn / 10
= √364/10
= √36.4
= 6.033
The mostly value ranges around 17 with a standard deviation of 6.033.
P2 Linear forecasting model: -
Linear regression is a tool which usually used in statistics for the predicting of future by
the value from past. It is quantitative tool which is used in analysing the data. It uses a strength
of trend line along with data plotted on the chart for prediction (Wei and et. al., 2021).
Month(X) Expense(y) X*Y X square(X^2) Y square(Y^2)
1 25 25 1 625
2 13 26 4 169
3 18 54 9 324
4 25 100 16 625
5 12 60 25 144
6 17 102 36 289
7 17 119 49 289
8 25 200 64 625
9 8 72 81 64
10 10 100 100 100
55 170 858 385 3254
Y = Mx +C
Y = Slope(x) + Constant
Constant(C) =
Constant is also a part of linear regression which helps in visualizing a constant point in
the data. It is used to view at what value regression line crosses the Y axis. It is usually known as
Y intercept. From the above example it can see that constant is 22.13.
6
⊘ This is a preview!⊘
Do you want full access?
Subscribe today to unlock all pages.

Trusted by 1+ million students worldwide

Constant(C) = (∑y) (∑x)- (∑x) (∑xy)/n(∑x)-(∑x)
= (170) (385) – (55) (858) / 10(385)- (3025)
= (65450 – 47190) / (3850- 3025)
= 18260 / 825
= 22.13
Slope(M) =
Slope is part of regression which is used to identify the steepness or the strength in the
data. It is used to calculate the rise or fall of the data or the average rate of change. It can be seen
that rate of change in the line is negative. It shows that the data is moving toward the negative
side.
Slope = n(∑xy)-(∑y) (∑x)/ n(∑x)-(∑x)
= 10(858) -(170) (55) / 10(385) -(3025)
= 8580 – 9350 / 3850-3025
= - 770 / 825
= - 0.933
Dependent Variable = Slope(x) + Constant
11 Month = -0.933(11) + 22.13
= -10.26 + 22.13
= 11.86
The value in the 11 month it moved to 11.86
12th Month = -0.933(12) + 22.13
= -11.2 + 22.13
= 10.93
The value in the 11 month it moved to 10.93.
The both the value is not low then the 10th month because the sudden strength is not that much
strong for the downside but slowly and gradually it is moving downside. It can be seen that in the
12th month value is less than the 11th month.
Conclusion
The above report concludes about the measure of central tendency. It shows about the
type of formula which are used in identifying the characteristic of the data like mean (average
7
Paraphrase This Document
Need a fresh take? Get an instant paraphrase of this document with our AI Paraphraser

point), mode (highest frequency), median (mid-range) and many more. They are used to depict
the clear image of data set. This report also includes about one forecasting model which linear
regression and its sub part. This report performs practical example on expense which has a slope
of downside (negative)
8
the clear image of data set. This report also includes about one forecasting model which linear
regression and its sub part. This report performs practical example on expense which has a slope
of downside (negative)
8

Reference
Books and Journal
Bagheri, H. and et. al., 2020. Forecasting the monthly incidence rate of brucellosis in west of Iran
using time series and data mining from 2010 to 2019. PloS one. 15(5). p.e0232910.
Pan, H. and Zhou, H., 2020. Study on convolutional neural network and its application in data
mining and sales forecasting for E-commerce. Electronic Commerce Research. 20(2).
pp.297-320.
Uhm, D., Ryu, J. B. and Jun, S., 2020. Patent data analysis of artificial intelligence using
Bayesian interval estimation. Applied Sciences. 10(2). p.570.
Wei, Y. and et. al., 2021. Compositional data techniques for forecasting dynamic change in
China’s energy consumption structure by 2020 and 2030. Journal of Cleaner
Production. 284. p.124702.
Xiao, X. and et. al., 2021. Lightning Data Assimilation Scheme in a 4DVAR System and Its
Impact on Very Short-Term Convective Forecasting. Monthly Weather Review. 149(2).
pp.353-373.
9
⊘ This is a preview!⊘
Do you want full access?
Subscribe today to unlock all pages.

Trusted by 1+ million students worldwide
1 out of 9
Related Documents
Your All-in-One AI-Powered Toolkit for Academic Success.
+13062052269
info@desklib.com
Available 24*7 on WhatsApp / Email
Unlock your academic potential
Copyright © 2020–2025 A2Z Services. All Rights Reserved. Developed and managed by ZUCOL.


