MN4063 Autumn - Coursework One: Data Analysis and Break-even Analysis

Verified

Added on  2022/12/29

|10
|1284
|36
Homework Assignment
AI Summary
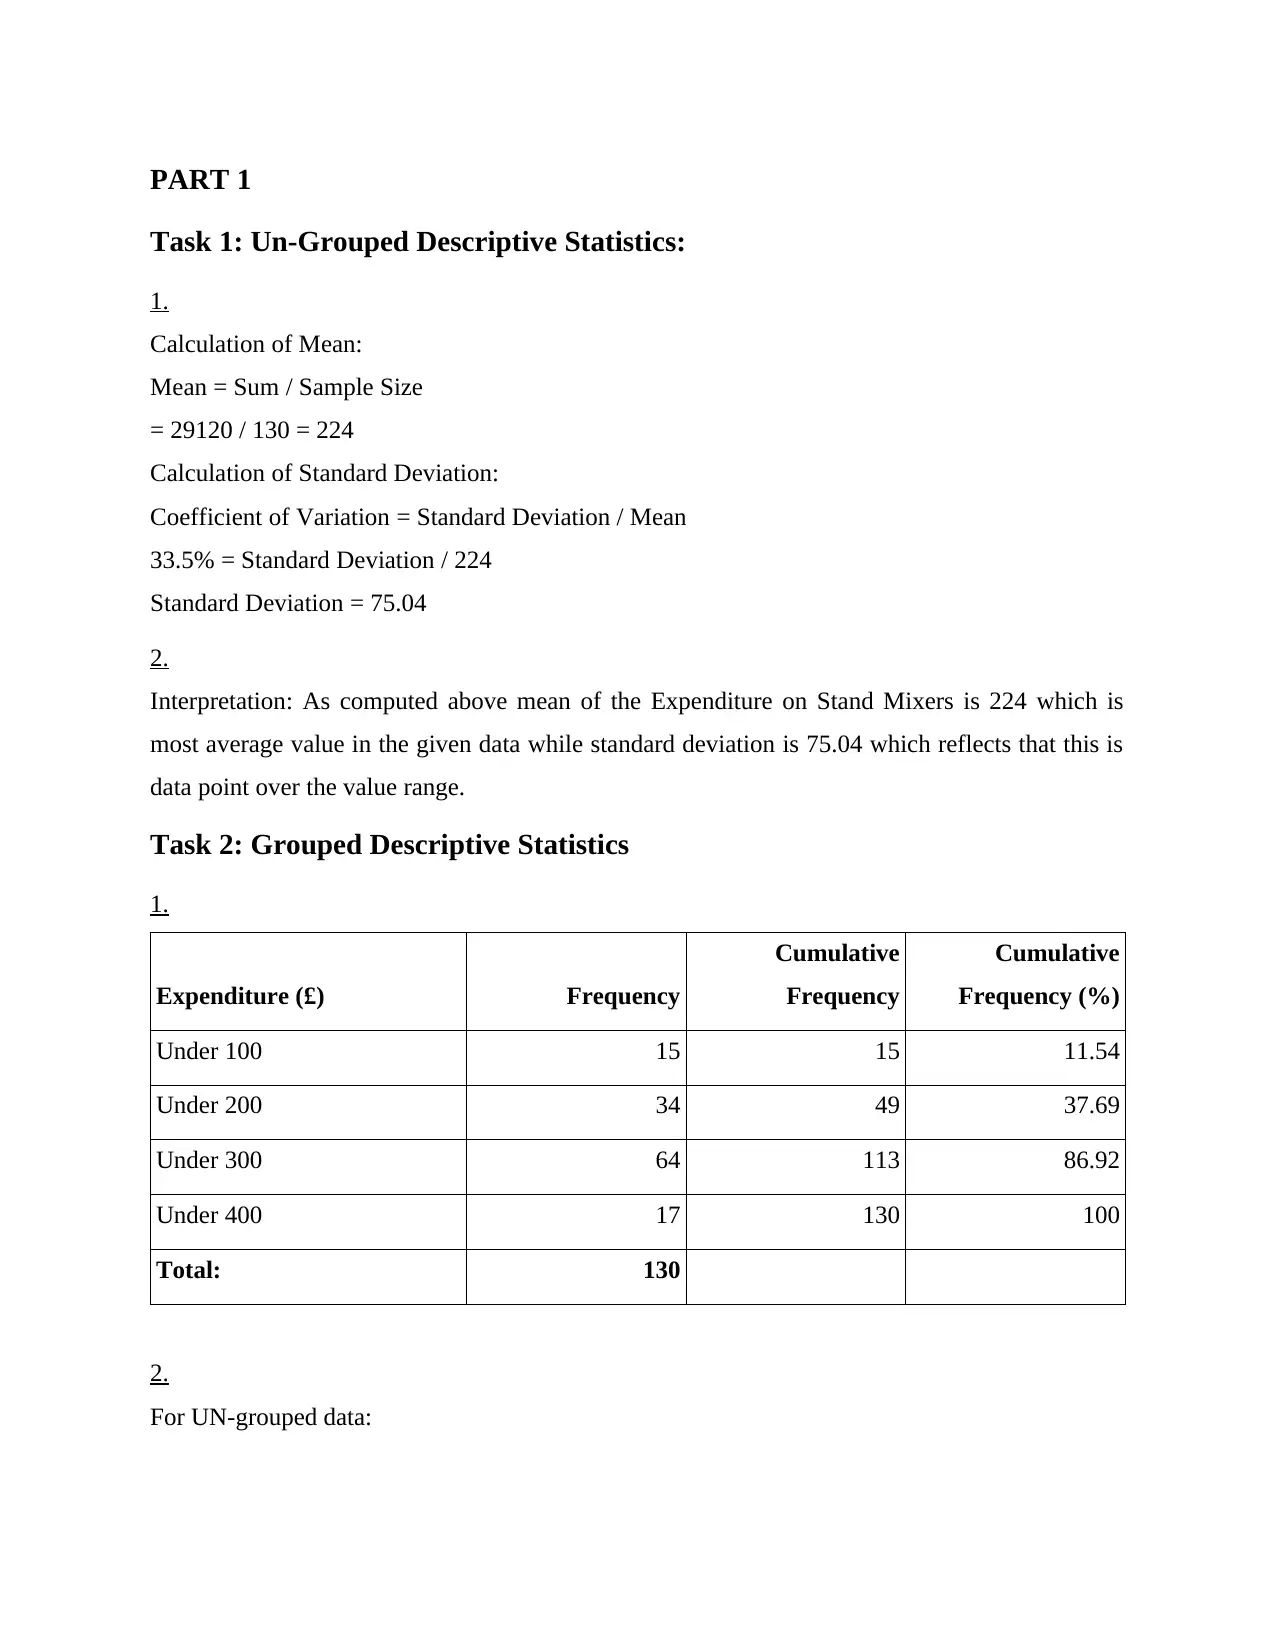
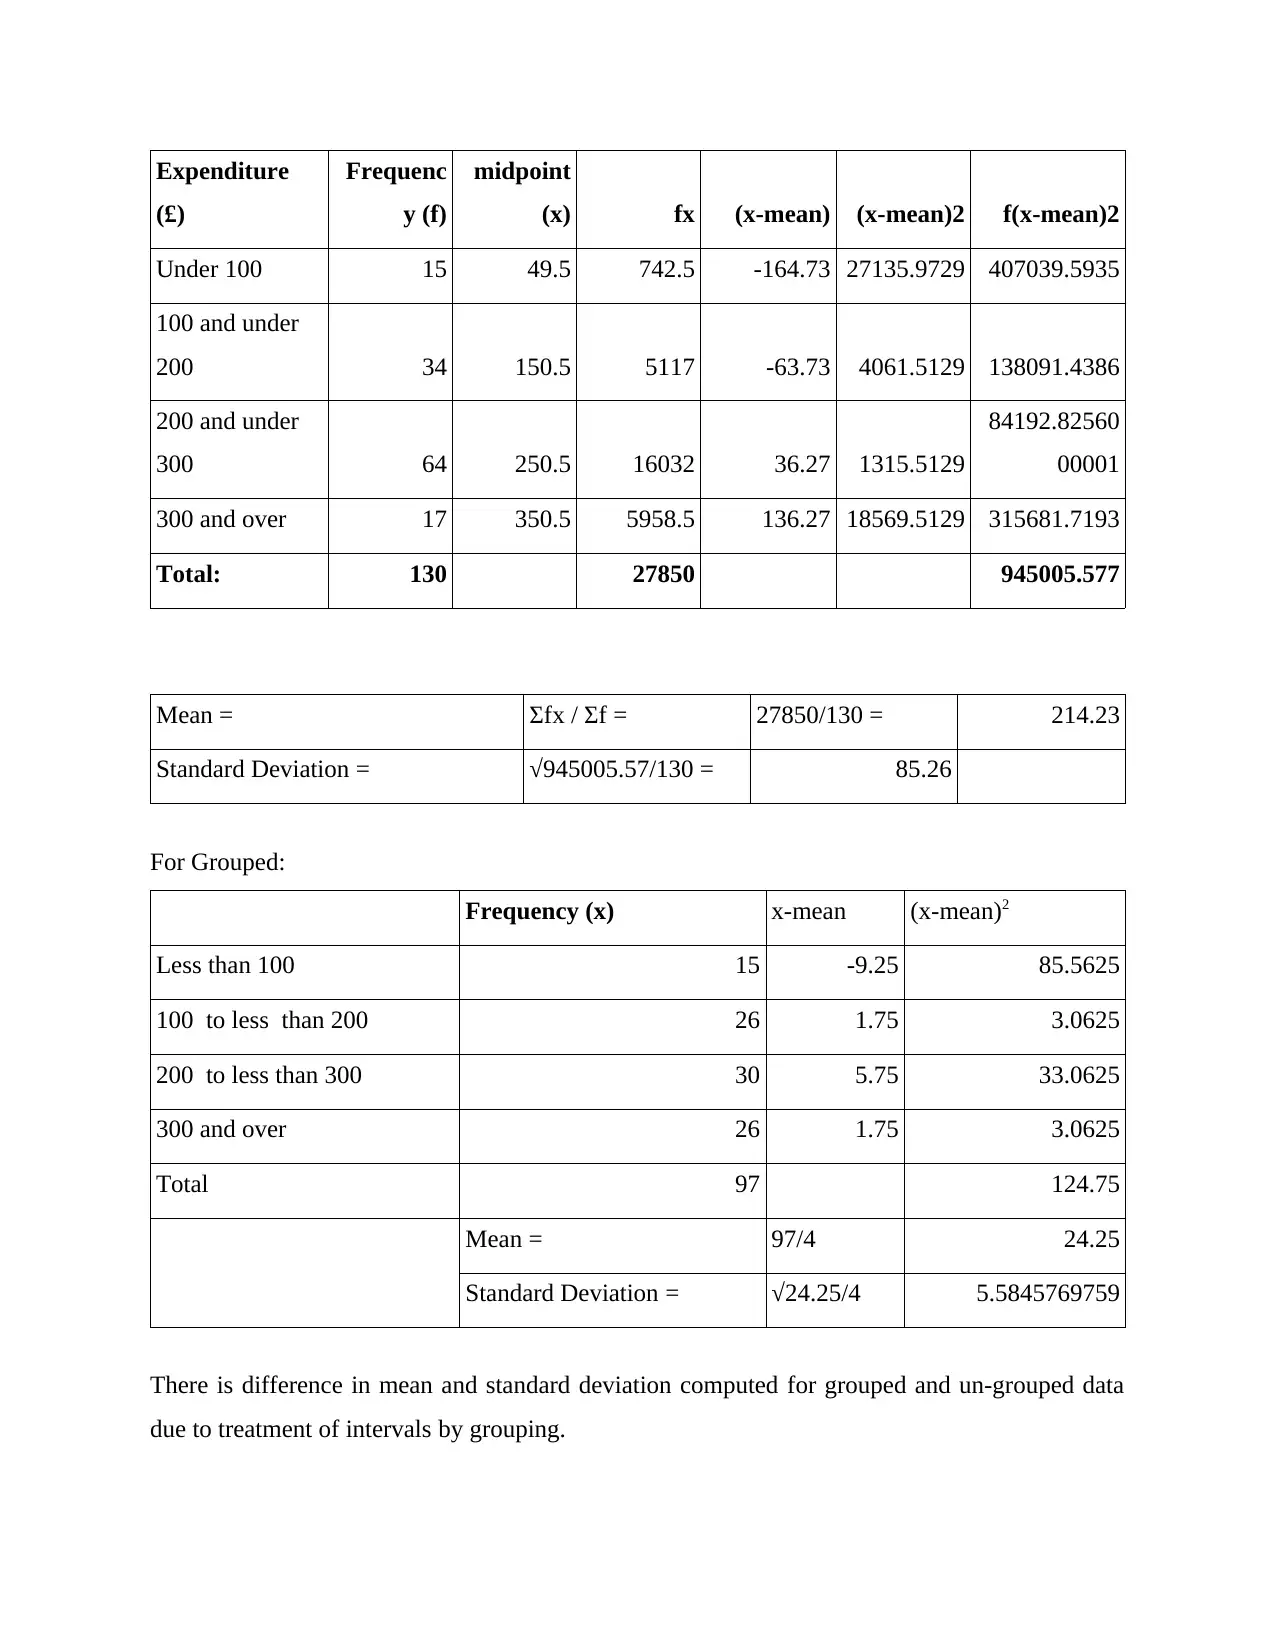
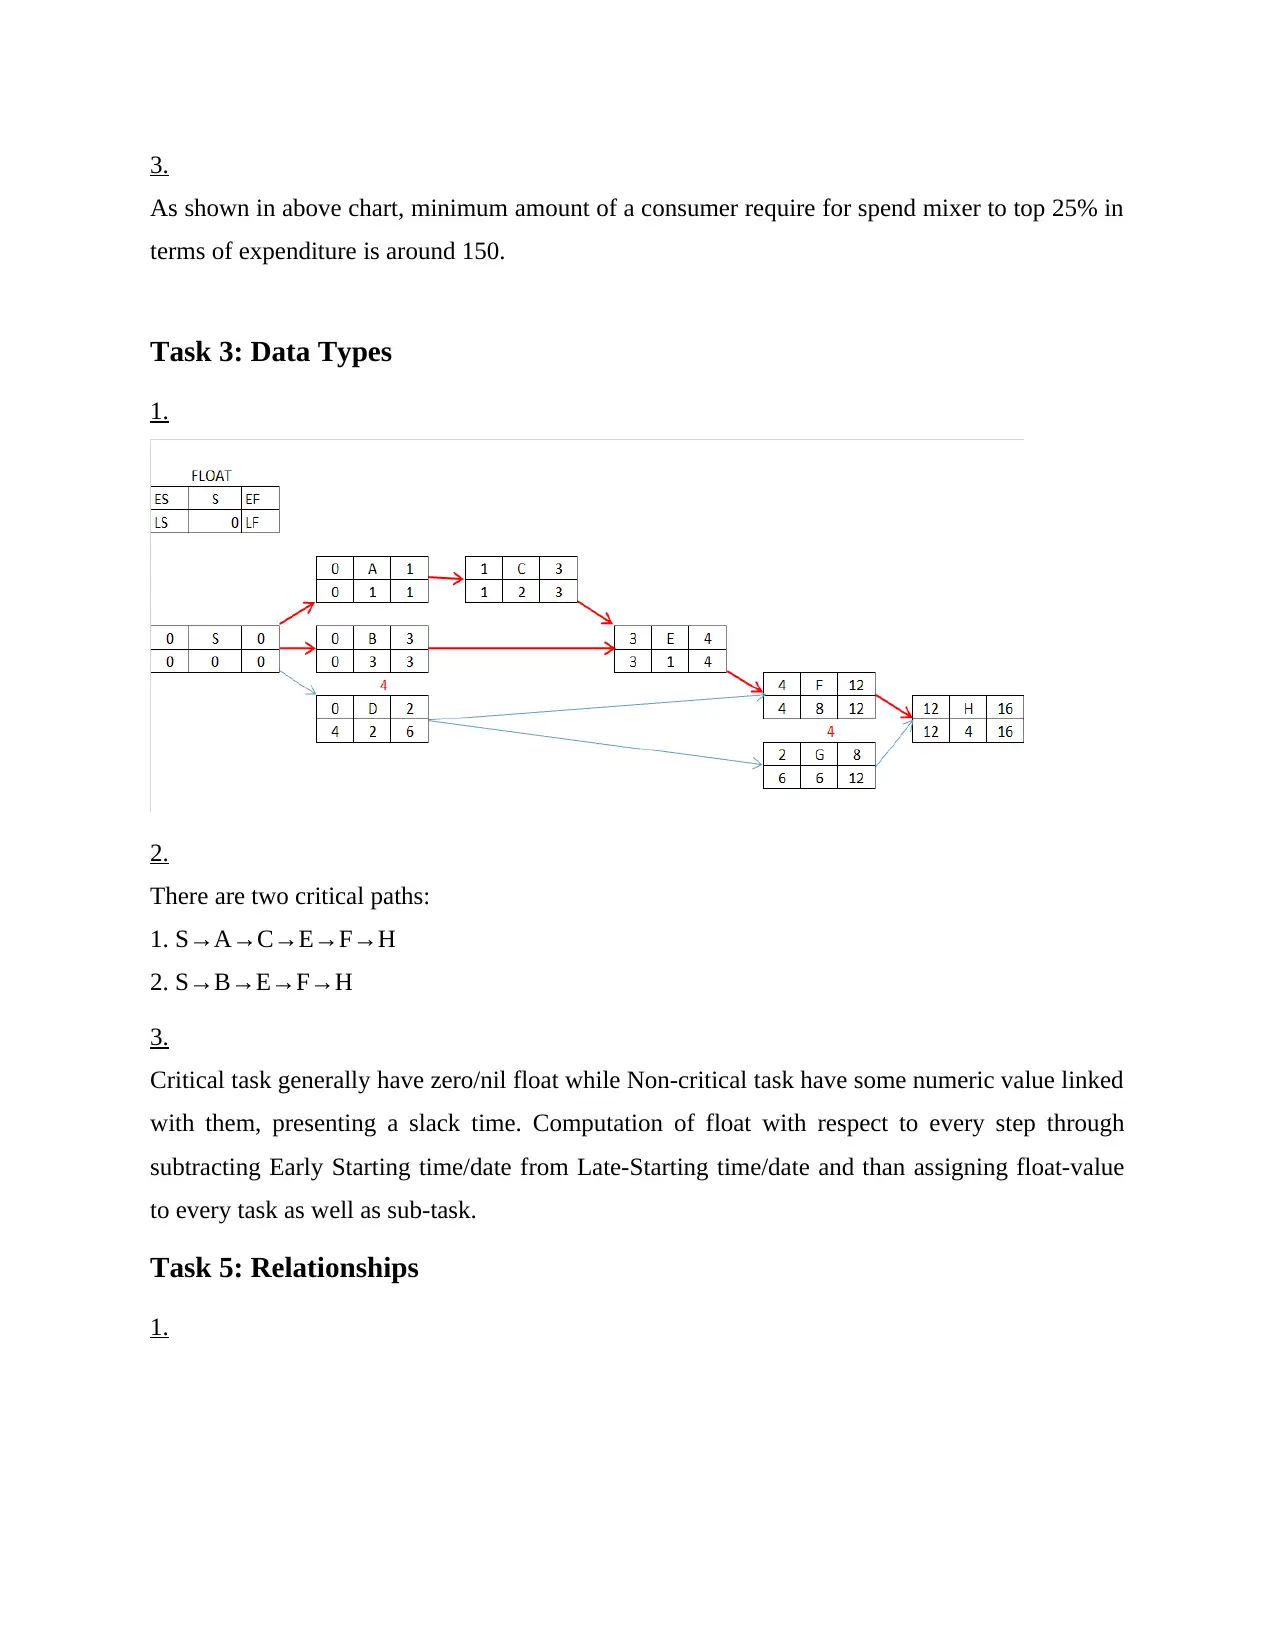
This coursework solution for MN4063, "Understanding and Managing Data," is divided into two parts. Part 1 focuses on data analysis, including calculations and interpretations of un-grouped and grouped descriptive statistics, data types, relationships between variables, and expected values. The solution includes calculations for mean, standard deviation, and coefficient of variation. Part 2 addresses break-even analysis, involving the estimation of variable costs, fixed costs, break-even points, target profit analysis, and margin of safety, along with a discussion of the high-low method and limitations of break-even analysis. The coursework also includes a regression analysis and network diagram with critical path analysis.
Document Page
Understanding and
Managing Data
tabler-icon-diamond-filled.svg

Paraphrase This Document

Need a fresh take? Get an instant paraphrase of this document with our AI Paraphraser
Document Page
Table of Contents
PART 1............................................................................................................................................4
Task 1: Un-Grouped Descriptive Statistics:....................................................................................4
1....................................................................................................................................................4
2....................................................................................................................................................4
Task 2: Grouped Descriptive Statistics............................................................................................4
1....................................................................................................................................................4
2....................................................................................................................................................4
3....................................................................................................................................................5
Task 3: Data Types..........................................................................................................................6
1....................................................................................................................................................6
2....................................................................................................................................................6
3....................................................................................................................................................6
Task 5: Relationships ......................................................................................................................6
1....................................................................................................................................................6
2....................................................................................................................................................7
3....................................................................................................................................................7
4....................................................................................................................................................7
Task 6: Expected Values..................................................................................................................8
1. ..................................................................................................................................................8
2....................................................................................................................................................8
Task 7...............................................................................................................................................8
1. ..................................................................................................................................................8
2....................................................................................................................................................8
3....................................................................................................................................................8
PART 2: Break-even Analysis.........................................................................................................8
1. ..................................................................................................................................................8
2....................................................................................................................................................9
3....................................................................................................................................................9
4....................................................................................................................................................9
Document Page
5....................................................................................................................................................9
6....................................................................................................................................................9
Document Page
PART 1
Task 1: Un-Grouped Descriptive Statistics:
1.
Calculation of Mean:
Mean = Sum / Sample Size
= 29120 / 130 = 224
Calculation of Standard Deviation:
Coefficient of Variation = Standard Deviation / Mean
33.5% = Standard Deviation / 224
Standard Deviation = 75.04
2.
Interpretation: As computed above mean of the Expenditure on Stand Mixers is 224 which is
most average value in the given data while standard deviation is 75.04 which reflects that this is
data point over the value range.
Task 2: Grouped Descriptive Statistics
1.
Expenditure (£) Frequency
Cumulative
Frequency
Cumulative
Frequency (%)
Under 100 15 15 11.54
Under 200 34 49 37.69
Under 300 64 113 86.92
Under 400 17 130 100
Total: 130
2.
For UN-grouped data:
tabler-icon-diamond-filled.svg

Paraphrase This Document

Need a fresh take? Get an instant paraphrase of this document with our AI Paraphraser
Document Page
Expenditure
(£)
Frequenc
y (f)
midpoint
(x) fx (x-mean) (x-mean)2 f(x-mean)2
Under 100 15 49.5 742.5 -164.73 27135.9729 407039.5935
100 and under
200 34 150.5 5117 -63.73 4061.5129 138091.4386
200 and under
300 64 250.5 16032 36.27 1315.5129
84192.82560
00001
300 and over 17 350.5 5958.5 136.27 18569.5129 315681.7193
Total: 130 27850 945005.577
Mean = Σfx / Σf = 27850/130 = 214.23
Standard Deviation = √945005.57/130 = 85.26
For Grouped:
Frequency (x) x-mean (x-mean)2
Less than 100 15 -9.25 85.5625
100 to less than 200 26 1.75 3.0625
200 to less than 300 30 5.75 33.0625
300 and over 26 1.75 3.0625
Total 97 124.75
Mean = 97/4 24.25
Standard Deviation = √24.25/4 5.5845769759
There is difference in mean and standard deviation computed for grouped and un-grouped data
due to treatment of intervals by grouping.
Document Page
3.
As shown in above chart, minimum amount of a consumer require for spend mixer to top 25% in
terms of expenditure is around 150.
Task 3: Data Types
1.
2.
There are two critical paths:
1. S→A→C→E→F→H
2. S→B→E→F→H
3.
Critical task generally have zero/nil float while Non-critical task have some numeric value linked
with them, presenting a slack time. Computation of float with respect to every step through
subtracting Early Starting time/date from Late-Starting time/date and than assigning float-value
to every task as well as sub-task.
Task 5: Relationships
1.
Document Page
Sales Revenue
(£'000)
Total Costs
(£'000)
Average Order
Value (£)
Gross Profit
(£'000)
Sales Revenue
(£'000) 1
Total Costs
(£'000) 0.5463506686 1
Average Order
Value (£) 0.9735337307 0.4660501553 1
Gross Profit
(£'000) 0.4229134499 0.8425735148 0.3336562809 1
2.
As figures stated in above correlation matrix this has been analysed that Average Order Value is
best predictor of quarterly Sales Revenue as this has closer value to 1.
3.
0
500
1000
1500
2000
2500
3000
020406080100120
f(x) = 0.0308643164667242 x + 10.6758133076579
R² = 0.947767924735013
tabler-icon-diamond-filled.svg

Paraphrase This Document

Need a fresh take? Get an instant paraphrase of this document with our AI Paraphraser
Document Page
4.
Interpretation: The curve and computations shows that 95% of data fits regression model. This
higher coefficient indicates issues in regression model.
5.
Regression Equation: f(x) = 0.03x + 10.68
This regression equation shows that there is positive correlation between variables of Sales
Revenue and Average Order Value.
Task 6: Expected Values
1.
Calculate the coefficients of variation:
Venture A:
Net EV = £48.0
Standard Deviation = £31.08
CV = Sd / mean = 31.08 / 48 * 100 = 64.75%
Venture B:
Net EV = £42.2
Standard Deviation = £14.32
CV = 14.32 / 42.2 *100 = 33.94
2.
Assuming that retailer is risk averse, project B with lower CV is more viable and should be
chosen.
Task 7
1.
In the section of UN grouped Descriptive Statistics and grouped Descriptive Statistics,
particularity I done well.
2.
The most challenging task in this coursework is formulation of network diagram and
computation of critical path.
Document Page
3.
I will work on network diagram and critical path aspects to to do large no. activities network
diagram.
PART 2: Break-even Analysis
1.
Estimating variable cost per t-shirt:
Variable cost = (highest cost – lowest cost)/ (highest activity units – lowest activity units)
= (410000 - 193200)/ (36000 – 14320)
= 216800 / 21680
= 10
2.
Fixed Costs = Highest costs - (variable cost per unit * highest units) = 410000 – (10*36000) =
50000
3.
Break-even t-shirts should Silvano Ltd. produce and sell in Jan 2021 = Fixed Cost / (Sales p.u.
Less Variable p.u.)
= 50000 / (15 – 10) = 50000 / 5 = 10000 t-shirts
4.
Target Profit in Jan. 2021 = £200000
Break-even t-shirts should Silvano Ltd. produce and sell in Jan 2021 = Fixed Cost + Target
Profit / (Sales p.u. Less Variable p.u.)
= (200000 + 50000) / (15 – 10)
= 250000 / 5
= 50000
5.
Margin of safety for January 2021= (Current Sales Level – Break-even Point) / Current Sales
Level * 100 = (36000 – 10000) / 36000 = 72.22%
Document Page
6.
a. High-low method is used here because there is no information have been given regarding fixed
costs and variable costs.
b. Fixed cost is part of cost which generally not changes with change in production quantity,
While variable cost is element of cost which changes with number of quantity.
c. Minimum 10000 t-shirts should need to produce and sell to attain targeted profit.
d. Minimum 50000 t-shirts should need to produce and sell to attain break-even point.
e. Margin of safety for Jan 2021 is 72.22% which shows that company has to attain production
and sell capacity of 72.22% as of current level.
f. Limitations of Break-even analysis:
Unrealistic assumptions – units are even not sold as at same rate at the distinct output
level; overall fixed costs will vary whenever output varies.
Sales/revenue are unlikely be as similar as output – here might be certain building up of
the stocks as well as chances of wasted outputs too.
Variable costs not stay at same-level, which may reduce there overall variable cost p.u.
Most of the entities sells multiple products, thus break-even in business will complex to
compute.
Break-even evaluation must be seen as planning assistive instead of decision-making
technique.
chevron_up_icon
1 out of 10
circle_padding
hide_on_mobile
zoom_out_icon
[object Object]