Data Analytics: A Business Case Study on eCommerce Analysis
VerifiedAdded on 2021/04/17
|27
|6003
|29
Case Study
AI Summary
This case study analyzes a dataset of 1000 computer and computer accessory products in an eCommerce setting. The analysis examines the impact of shipping type (free vs. customer-paid), customer type (new vs. existing), and region (NSW, QLD, VIC, ACT, SA) on sales, profit, and customer ratings. The study calculates variables such as total monthly sales, total monthly profit, and profit percentage. It employs statistical techniques like Chi-square tests for association, two-sample t-tests, ANOVA, correlation, and regression analysis to identify significant relationships and patterns. Findings include profit analysis by different variables, association testing between attributes, and t-tests to compare means. The study concludes with recommendations for the company and an implementation plan to improve business performance and customer satisfaction.
Data Analytics: A Business Case Study
Executive Summary
In Today’s world, eCommerce becoming very popular in all over the world. As the
people got interest in the buying through eCommerce platform, it increases the challenges to
the service provider. It mainly consist of customer satisfaction and increased competition. For
the service provider, it is mandatory to satisfy the customer and compete in the market.
In this case study, we develop the data sets regarding to computer and computer
accessories for the 1000 products. We considered the attributes as Product, Price, Shipping
Type (Free or Customer Paid), Sale Price, Customer Type (New or Existing), Number of
customers, Region (NSW, QLD, VIC, ACT, SA), Profit and Average Rating. We have
calculate some other variables.
We summarised the profit percentage on total sale and profit per item for shipping
type, customer type and region. We test the difference between considered variables for
shipping type, customer type and region. We did correlation and regression analysis.
Analytical findings are reported with conclusion. Recommendations to the company with
implementation plan is also given.
Page 1 of 28
Paraphrase This Document
Need a fresh take? Get an instant paraphrase of this document with our AI Paraphraser
Table of Contents
Sr. No. Topic Page No.
1 List of Abbreviations and assumptions made 3
2 Introduction – What is the problem? 4
3 Research Methodology 6
4 Analytical Findings 6
5 Recommendations to the company 24
6
An implementation plan based on the recommendations you
have provided
24
7 Conclusion 25
8 List of References 26
9 Appendix 27
Page 2 of 28
List of Abbreviations and assumptions made
NSW : New South Wales
QLD : Queensland
VIC : Victoria
ACT : Australian Capital Territory
SA : South Australia
Min : Minimum
Max : Maximum
Q1 : First Quartile
Q3 : Second Quartile
Page 3 of 28
NSW : New South Wales
QLD : Queensland
VIC : Victoria
ACT : Australian Capital Territory
SA : South Australia
Min : Minimum
Max : Maximum
Q1 : First Quartile
Q3 : Second Quartile
Page 3 of 28
⊘ This is a preview!⊘
Do you want full access?
Subscribe today to unlock all pages.
Trusted by 1+ million students worldwide
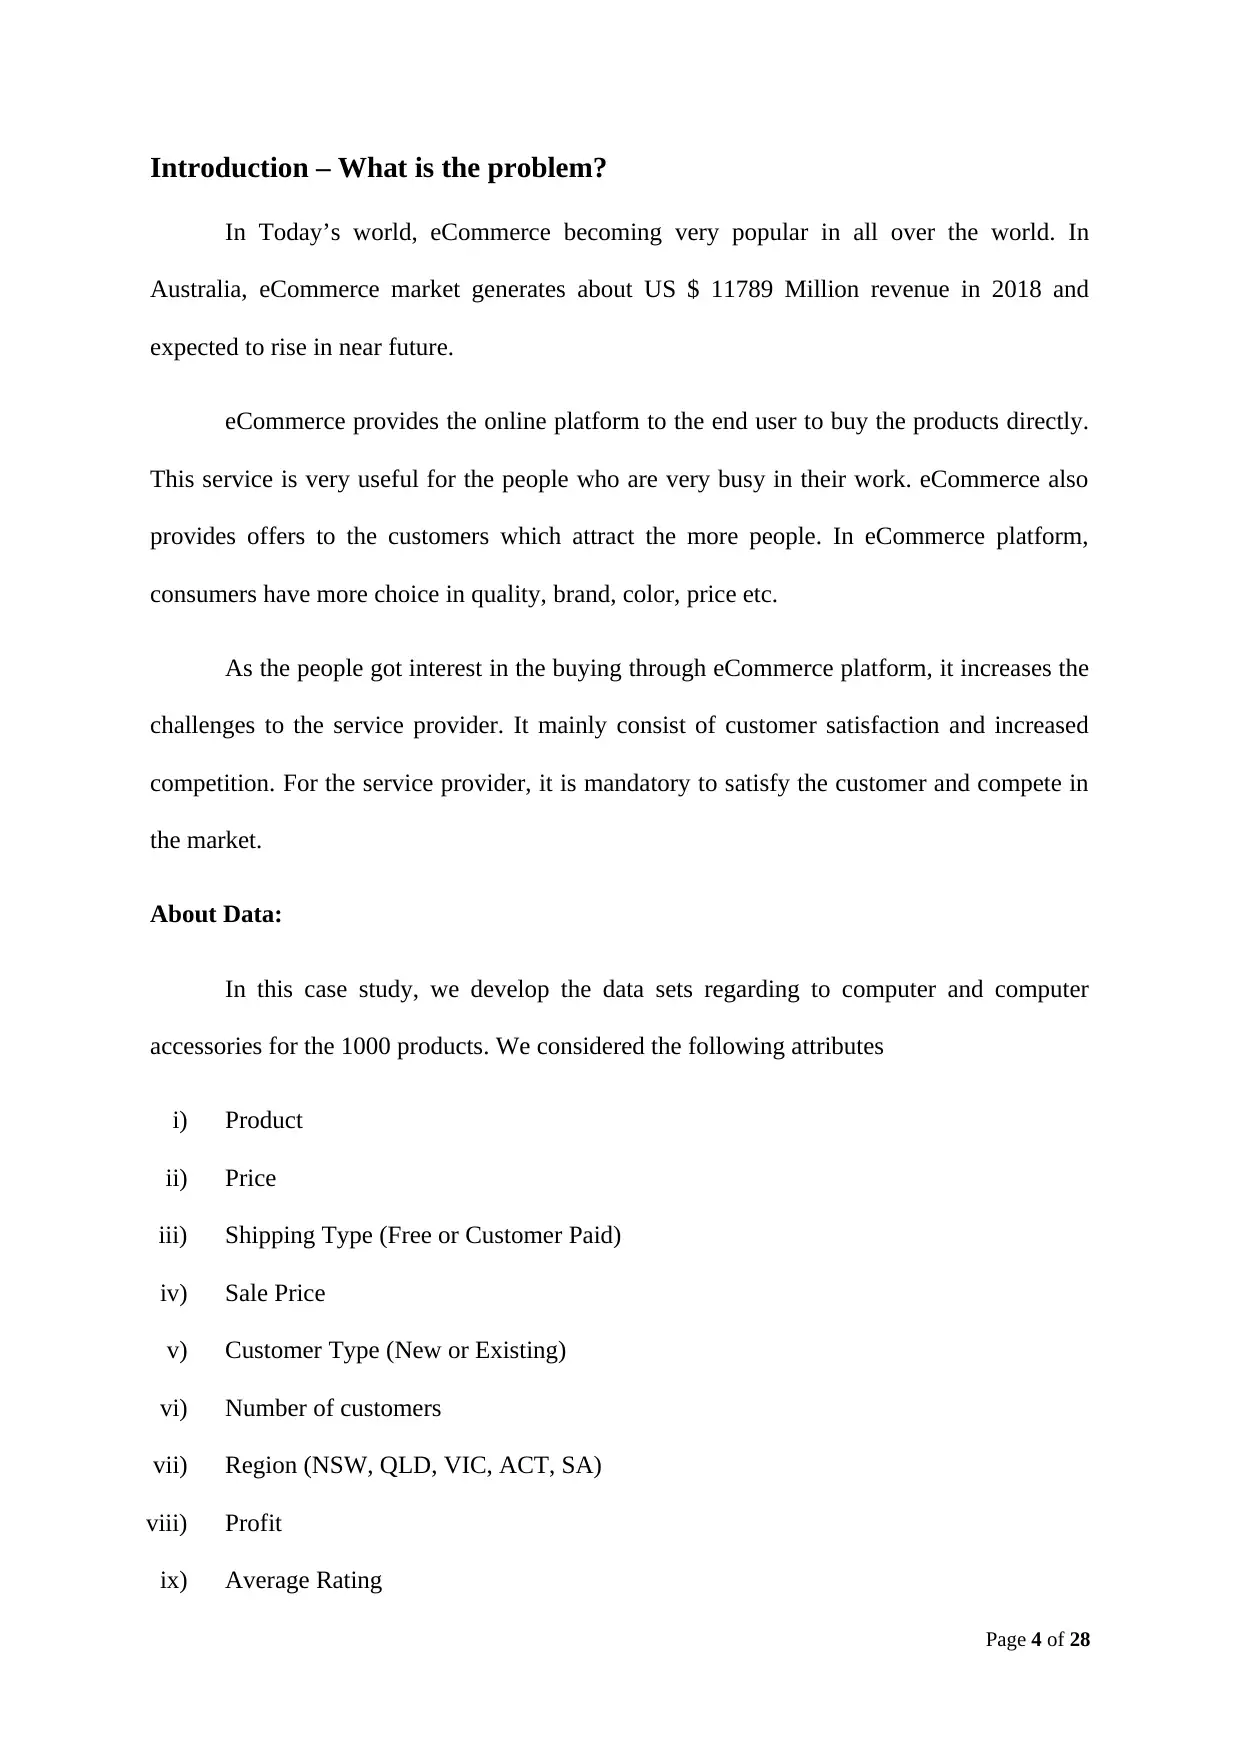
Introduction – What is the problem?
In Today’s world, eCommerce becoming very popular in all over the world. In
Australia, eCommerce market generates about US $ 11789 Million revenue in 2018 and
expected to rise in near future.
eCommerce provides the online platform to the end user to buy the products directly.
This service is very useful for the people who are very busy in their work. eCommerce also
provides offers to the customers which attract the more people. In eCommerce platform,
consumers have more choice in quality, brand, color, price etc.
As the people got interest in the buying through eCommerce platform, it increases the
challenges to the service provider. It mainly consist of customer satisfaction and increased
competition. For the service provider, it is mandatory to satisfy the customer and compete in
the market.
About Data:
In this case study, we develop the data sets regarding to computer and computer
accessories for the 1000 products. We considered the following attributes
i) Product
ii) Price
iii) Shipping Type (Free or Customer Paid)
iv) Sale Price
v) Customer Type (New or Existing)
vi) Number of customers
vii) Region (NSW, QLD, VIC, ACT, SA)
viii) Profit
ix) Average Rating
Page 4 of 28
Paraphrase This Document
Need a fresh take? Get an instant paraphrase of this document with our AI Paraphraser
x) Total monthly sale amount
xi) Total monthly profit
xii) Profit Percentage
We define following variables as
Total Monthly sale amount= Sale Price × Number of customers
Total monthly profit= Profit × Number of customers
Profit Percentage= Total monthly profit /
Project Problem:
We are interested to know the following things
i) Profit analysis by shipping type, customer type and region wise.
ii) Whether there is any association between shipping type and region.
iii) Whether there is any association between customer type and region.
iv) Whether there is any association between shipping type and customer type.
v) Whether the price is significantly different for different shipping type.
vi) Whether the sale price is significantly different for different shipping type.
vii) Whether the profit is significantly different for different shipping type.
viii) Whether the rating is significantly different for different shipping type.
ix) Whether the price is significantly different for different customer type.
x) Whether the sale price is significantly different for different customer type.
xi) Whether the profit is significantly different for different customer type.
xii) Whether the rating is significantly different for different customer type.
xiii) Whether the price is significantly different for different region.
xiv) Whether the sale price is significantly different for different region.
xv) Whether the profit is significantly different for different region.
Page 5 of 28
xvi) Whether the rating is significantly different for different region.
xvii) Correlation analysis of variables
xviii) Regression analysis for total monthly sales
Research Methodology
Statistical tools and techniques are the necessary for analysis. In the analysis,
selection of proper statistical tools and techniques is very important. For profit analysis, we
summarised the profit percentage on total sale and profit per item for shipping type, customer
type and region. We have used the Chi-square test of association for testing the associations
of attributes. We have used independent two sample t-test for the testing the mean price, sale
price, profit and rating for shipping type and customer type. We analyzed the mean price, sale
price, profit and rating of region using one way ANOVA technique. We test the significance
of correlation between two variable. We tried to fit regression model for the monthly profit
and monthly sales.
Analytical Findings
Profit Analysis:
In profit analysis, we have given the total sales amount, total profit, profit percentage
on total sale amount and profit per item. Larger the value of profit percentage on total sale
amount and profit per item would be considered better for increasing the profit.
Table 1 gives the profit analysis according to shipping type. Both the shipping type customer
paid and free have no much difference in the average profit percentage. Still total monthly
sale and profit seems to be large for paid shipping customer than free shipping customer.
Page 6 of 28
⊘ This is a preview!⊘
Do you want full access?
Subscribe today to unlock all pages.
Trusted by 1+ million students worldwide
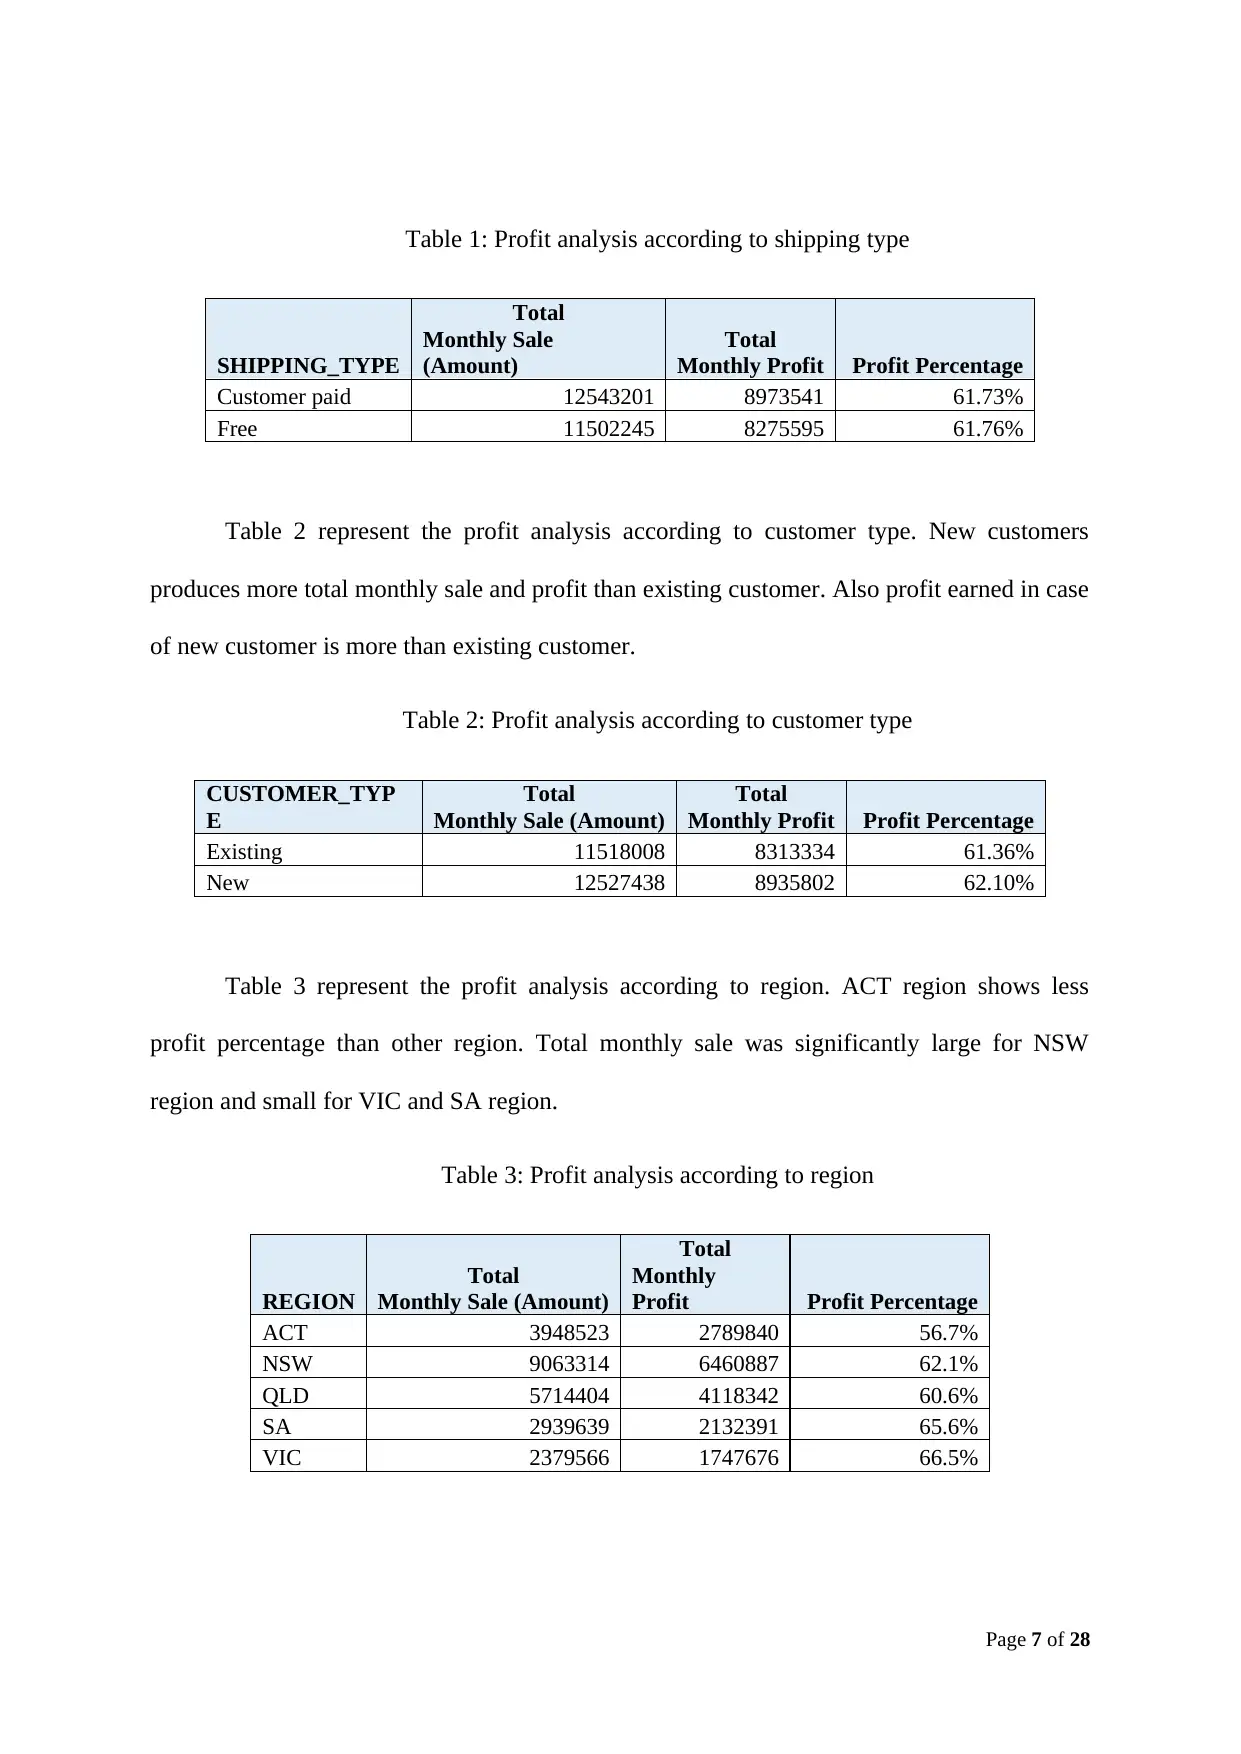
Table 1: Profit analysis according to shipping type
SHIPPING_TYPE
Total
Monthly Sale
(Amount)
Total
Monthly Profit Profit Percentage
Customer paid 12543201 8973541 61.73%
Free 11502245 8275595 61.76%
Table 2 represent the profit analysis according to customer type. New customers
produces more total monthly sale and profit than existing customer. Also profit earned in case
of new customer is more than existing customer.
Table 2: Profit analysis according to customer type
CUSTOMER_TYP
E
Total
Monthly Sale (Amount)
Total
Monthly Profit Profit Percentage
Existing 11518008 8313334 61.36%
New 12527438 8935802 62.10%
Table 3 represent the profit analysis according to region. ACT region shows less
profit percentage than other region. Total monthly sale was significantly large for NSW
region and small for VIC and SA region.
Table 3: Profit analysis according to region
REGION
Total
Monthly Sale (Amount)
Total
Monthly
Profit Profit Percentage
ACT 3948523 2789840 56.7%
NSW 9063314 6460887 62.1%
QLD 5714404 4118342 60.6%
SA 2939639 2132391 65.6%
VIC 2379566 1747676 66.5%
Page 7 of 28
Paraphrase This Document
Need a fresh take? Get an instant paraphrase of this document with our AI Paraphraser
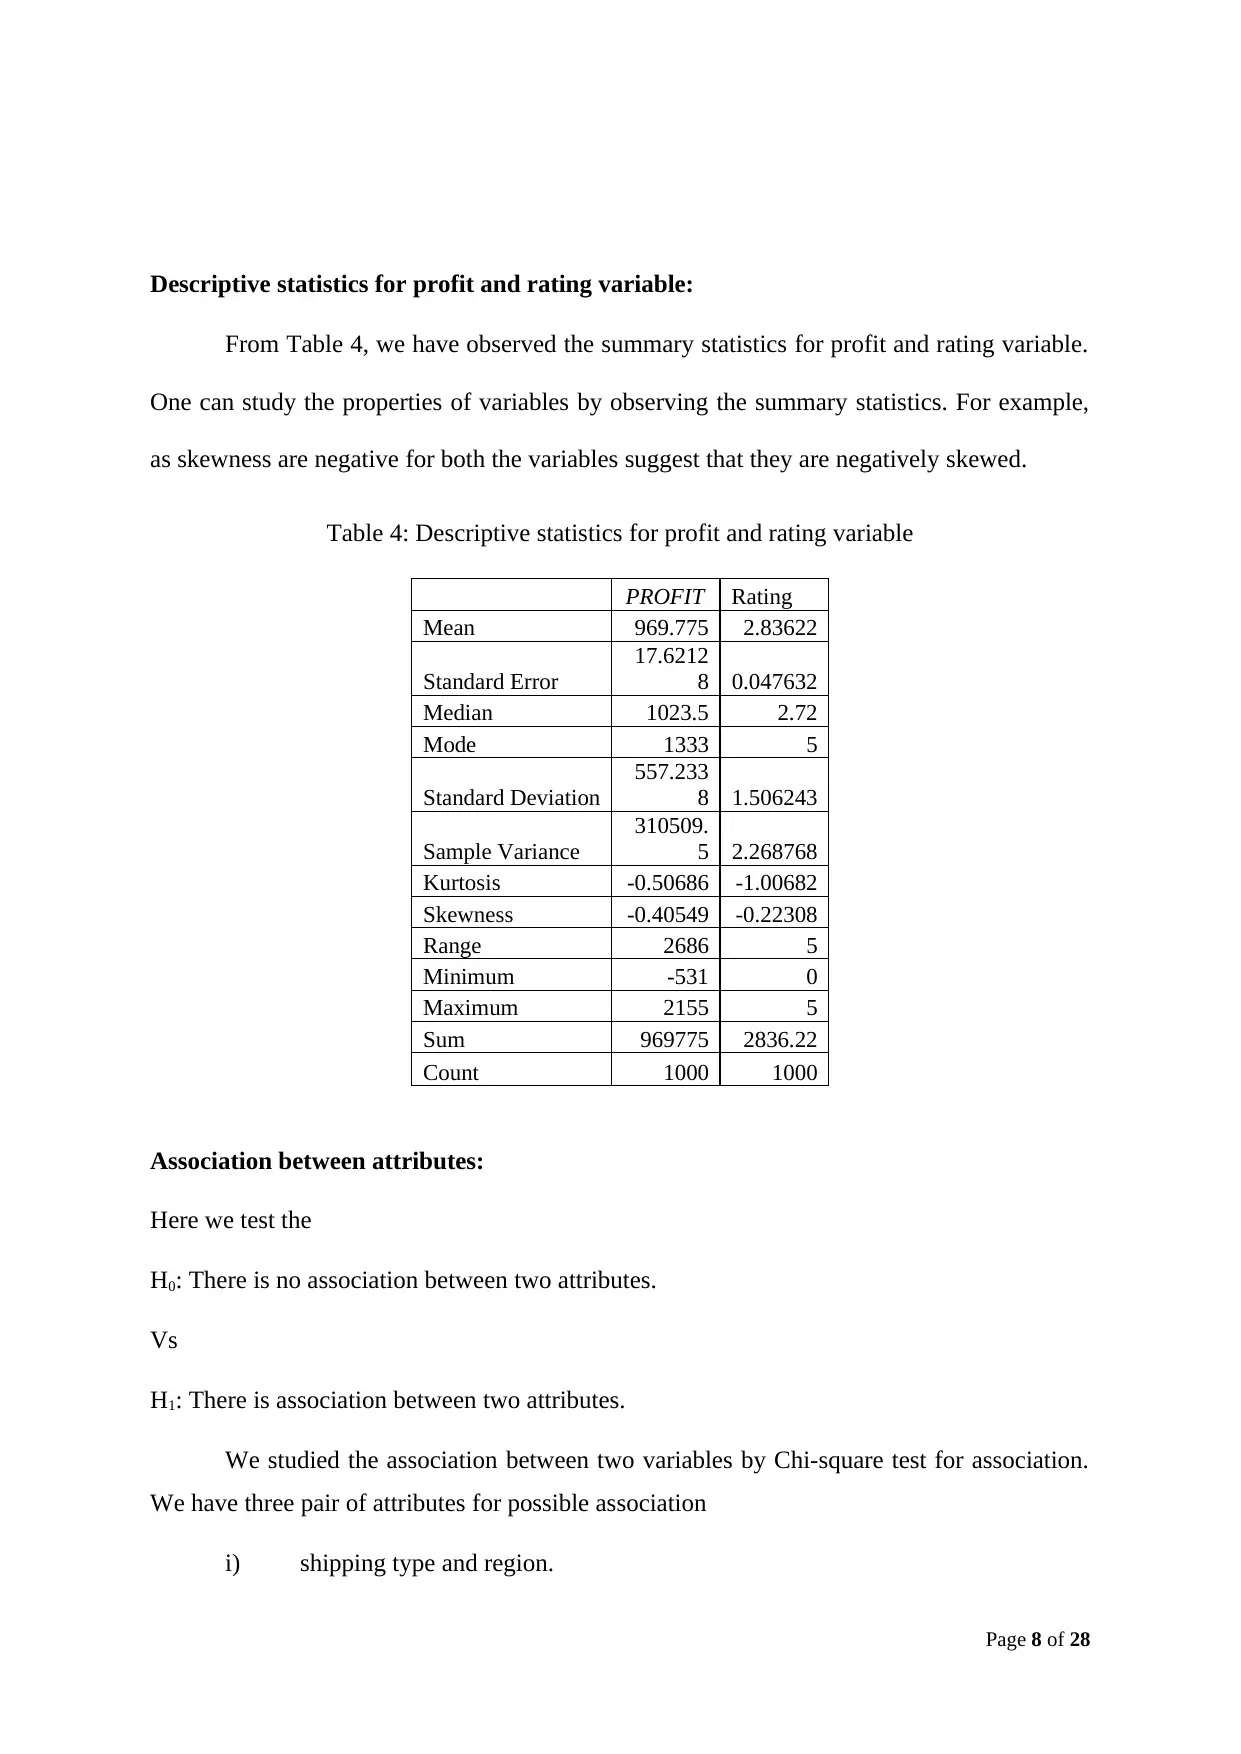
Descriptive statistics for profit and rating variable:
From Table 4, we have observed the summary statistics for profit and rating variable.
One can study the properties of variables by observing the summary statistics. For example,
as skewness are negative for both the variables suggest that they are negatively skewed.
Table 4: Descriptive statistics for profit and rating variable
PROFIT Rating
Mean 969.775 2.83622
Standard Error
17.6212
8 0.047632
Median 1023.5 2.72
Mode 1333 5
Standard Deviation
557.233
8 1.506243
Sample Variance
310509.
5 2.268768
Kurtosis -0.50686 -1.00682
Skewness -0.40549 -0.22308
Range 2686 5
Minimum -531 0
Maximum 2155 5
Sum 969775 2836.22
Count 1000 1000
Association between attributes:
Here we test the
H0: There is no association between two attributes.
Vs
H1: There is association between two attributes.
We studied the association between two variables by Chi-square test for association.
We have three pair of attributes for possible association
i) shipping type and region.
Page 8 of 28
ii) customer type and region.
iii) shipping type and customer type.
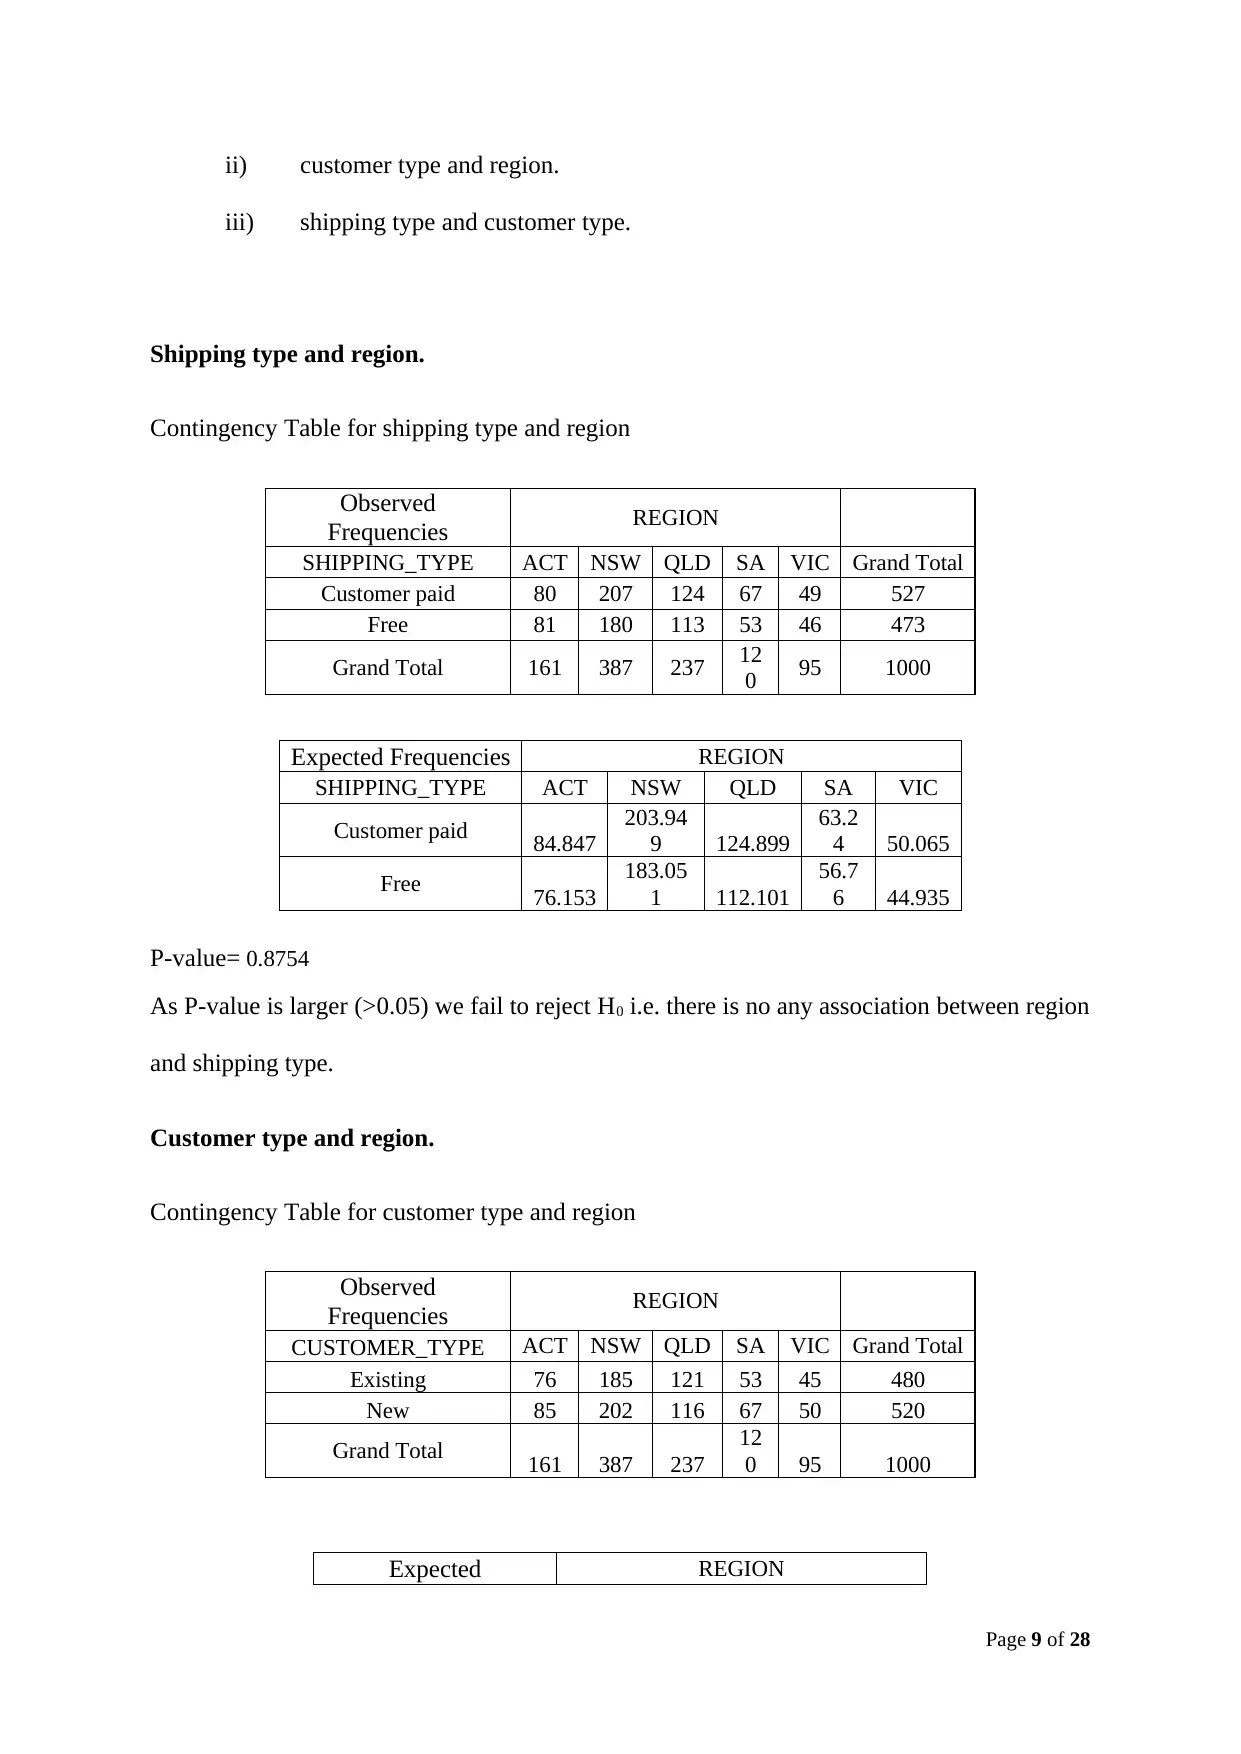
Shipping type and region.
Contingency Table for shipping type and region
Observed
Frequencies REGION
SHIPPING_TYPE ACT NSW QLD SA VIC Grand Total
Customer paid 80 207 124 67 49 527
Free 81 180 113 53 46 473
Grand Total 161 387 237 12
0 95 1000
Expected Frequencies REGION
SHIPPING_TYPE ACT NSW QLD SA VIC
Customer paid 84.847
203.94
9 124.899
63.2
4 50.065
Free 76.153
183.05
1 112.101
56.7
6 44.935
P-value= 0.8754
As P-value is larger (>0.05) we fail to reject H0 i.e. there is no any association between region
and shipping type.
Customer type and region.
Contingency Table for customer type and region
Observed
Frequencies REGION
CUSTOMER_TYPE ACT NSW QLD SA VIC Grand Total
Existing 76 185 121 53 45 480
New 85 202 116 67 50 520
Grand Total 161 387 237
12
0 95 1000
Expected REGION
Page 9 of 28
iii) shipping type and customer type.
Shipping type and region.
Contingency Table for shipping type and region
Observed
Frequencies REGION
SHIPPING_TYPE ACT NSW QLD SA VIC Grand Total
Customer paid 80 207 124 67 49 527
Free 81 180 113 53 46 473
Grand Total 161 387 237 12
0 95 1000
Expected Frequencies REGION
SHIPPING_TYPE ACT NSW QLD SA VIC
Customer paid 84.847
203.94
9 124.899
63.2
4 50.065
Free 76.153
183.05
1 112.101
56.7
6 44.935
P-value= 0.8754
As P-value is larger (>0.05) we fail to reject H0 i.e. there is no any association between region
and shipping type.
Customer type and region.
Contingency Table for customer type and region
Observed
Frequencies REGION
CUSTOMER_TYPE ACT NSW QLD SA VIC Grand Total
Existing 76 185 121 53 45 480
New 85 202 116 67 50 520
Grand Total 161 387 237
12
0 95 1000
Expected REGION
Page 9 of 28
⊘ This is a preview!⊘
Do you want full access?
Subscribe today to unlock all pages.
Trusted by 1+ million students worldwide
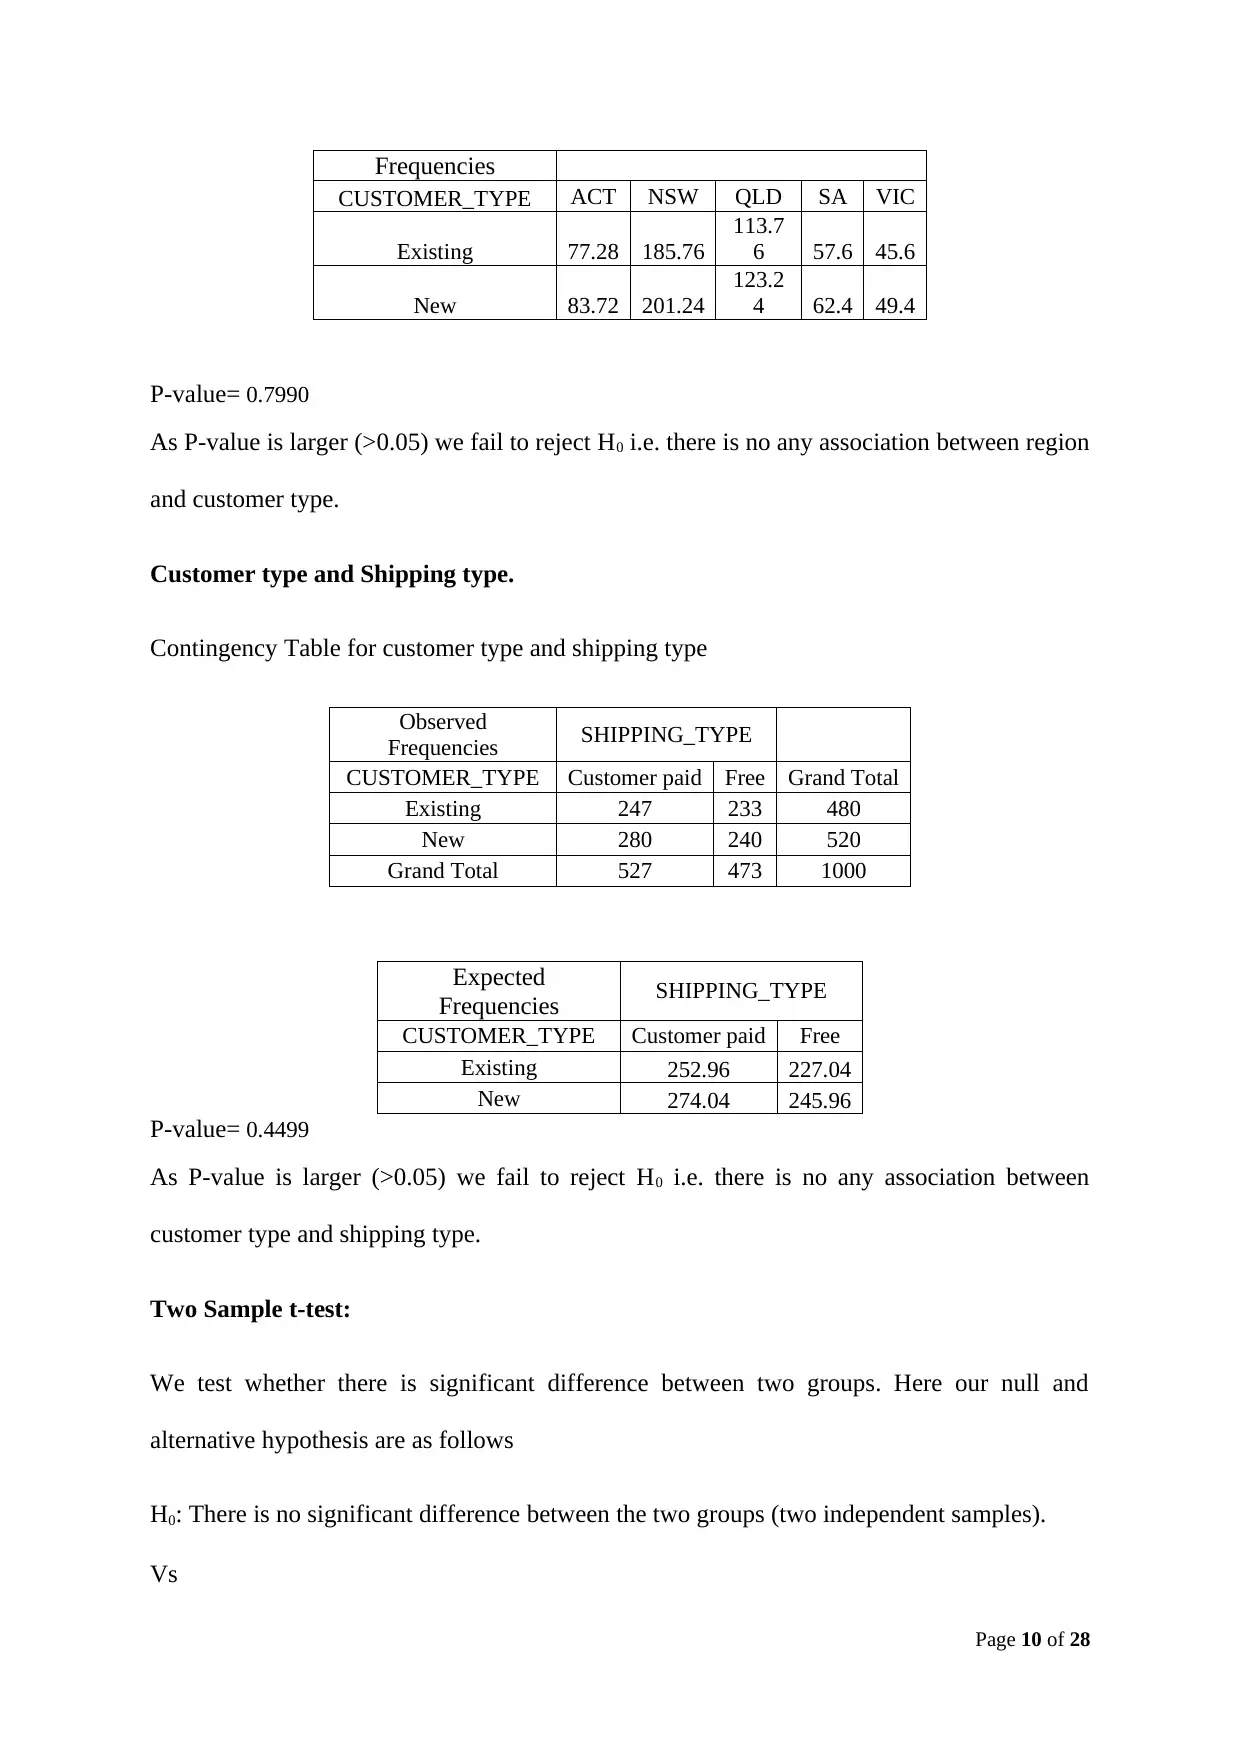
Frequencies
CUSTOMER_TYPE ACT NSW QLD SA VIC
Existing 77.28 185.76
113.7
6 57.6 45.6
New 83.72 201.24
123.2
4 62.4 49.4
P-value= 0.7990
As P-value is larger (>0.05) we fail to reject H0 i.e. there is no any association between region
and customer type.
Customer type and Shipping type.
Contingency Table for customer type and shipping type
Observed
Frequencies SHIPPING_TYPE
CUSTOMER_TYPE Customer paid Free Grand Total
Existing 247 233 480
New 280 240 520
Grand Total 527 473 1000
Expected
Frequencies SHIPPING_TYPE
CUSTOMER_TYPE Customer paid Free
Existing 252.96 227.04
New 274.04 245.96
P-value= 0.4499
As P-value is larger (>0.05) we fail to reject H0 i.e. there is no any association between
customer type and shipping type.
Two Sample t-test:
We test whether there is significant difference between two groups. Here our null and
alternative hypothesis are as follows
H0: There is no significant difference between the two groups (two independent samples).
Vs
Page 10 of 28
Paraphrase This Document
Need a fresh take? Get an instant paraphrase of this document with our AI Paraphraser
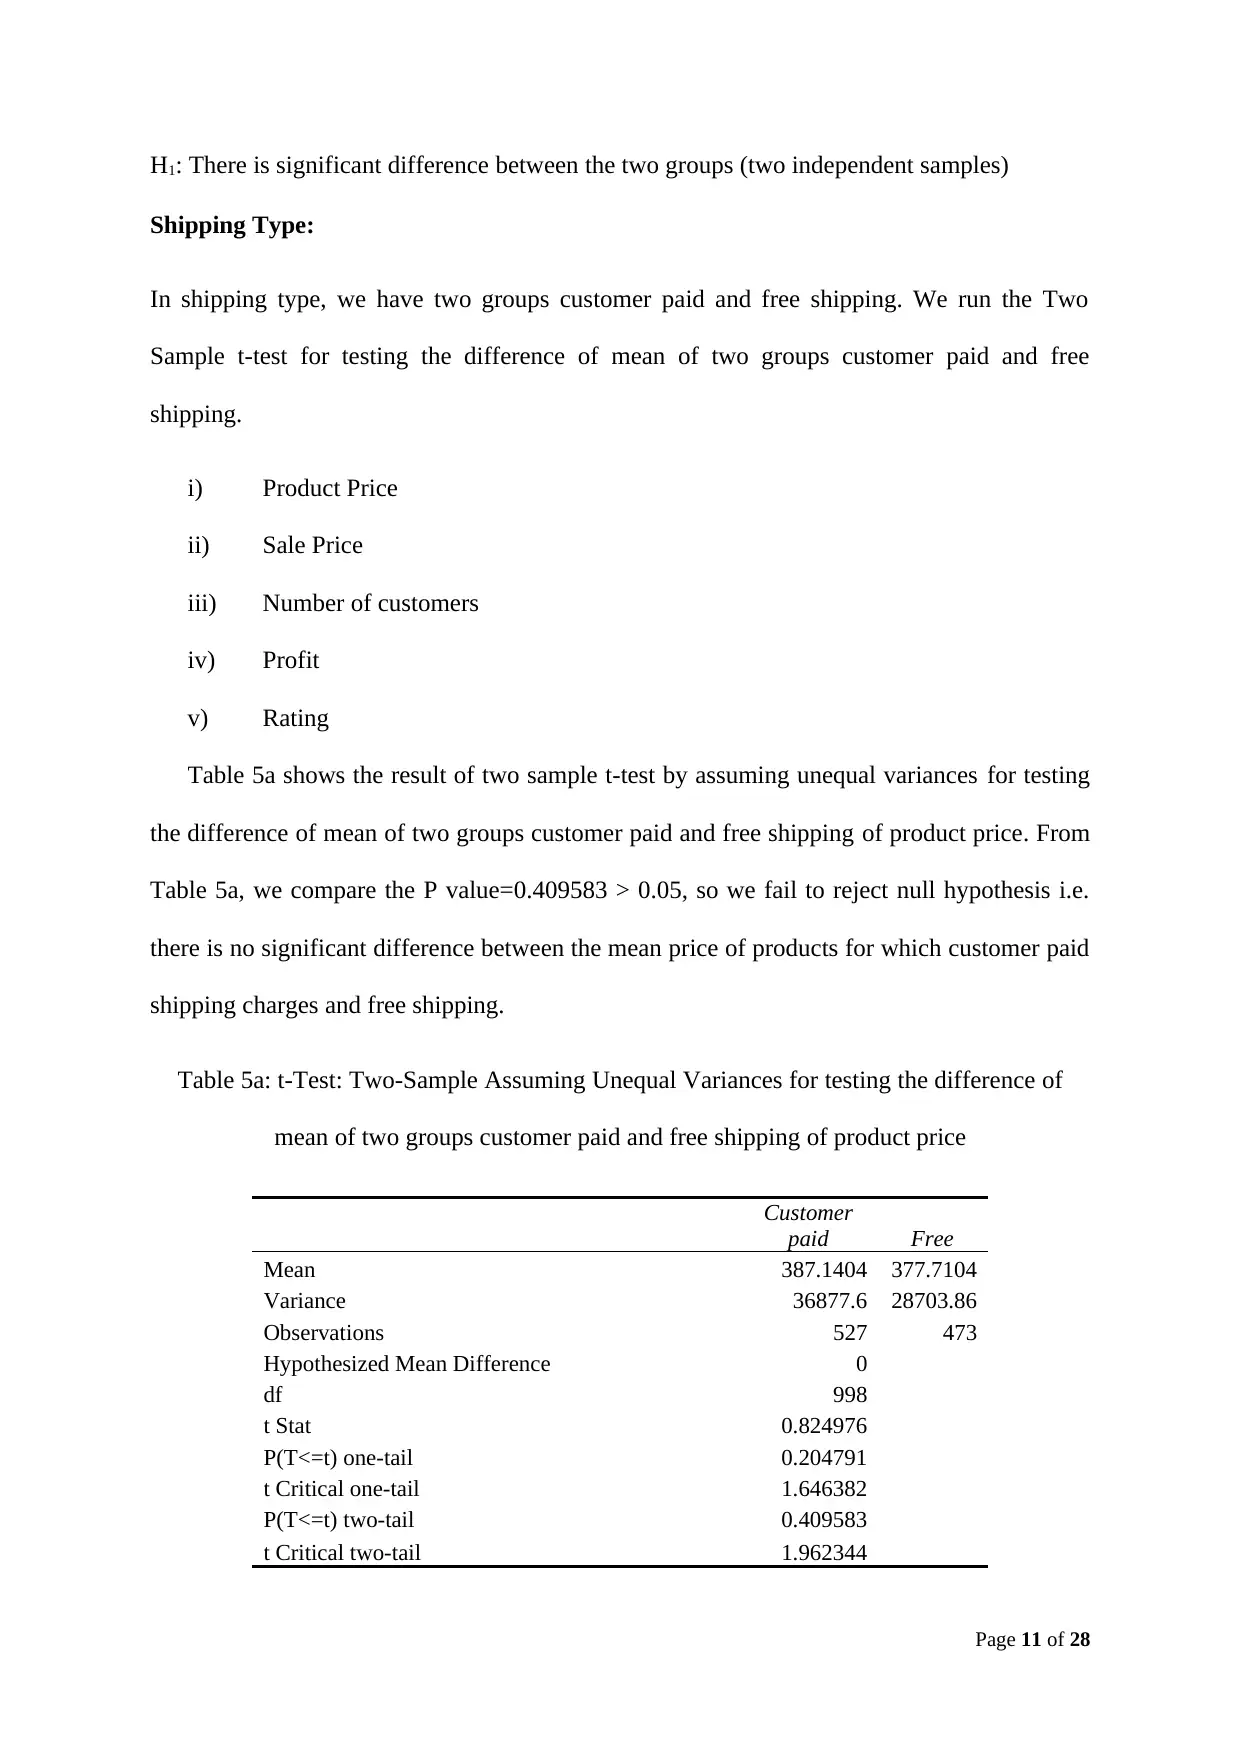
H1: There is significant difference between the two groups (two independent samples)
Shipping Type:
In shipping type, we have two groups customer paid and free shipping. We run the Two
Sample t-test for testing the difference of mean of two groups customer paid and free
shipping.
i) Product Price
ii) Sale Price
iii) Number of customers
iv) Profit
v) Rating
Table 5a shows the result of two sample t-test by assuming unequal variances for testing
the difference of mean of two groups customer paid and free shipping of product price. From
Table 5a, we compare the P value=0.409583 > 0.05, so we fail to reject null hypothesis i.e.
there is no significant difference between the mean price of products for which customer paid
shipping charges and free shipping.
Table 5a: t-Test: Two-Sample Assuming Unequal Variances for testing the difference of
mean of two groups customer paid and free shipping of product price
Customer
paid Free
Mean 387.1404 377.7104
Variance 36877.6 28703.86
Observations 527 473
Hypothesized Mean Difference 0
df 998
t Stat 0.824976
P(T<=t) one-tail 0.204791
t Critical one-tail 1.646382
P(T<=t) two-tail 0.409583
t Critical two-tail 1.962344
Page 11 of 28
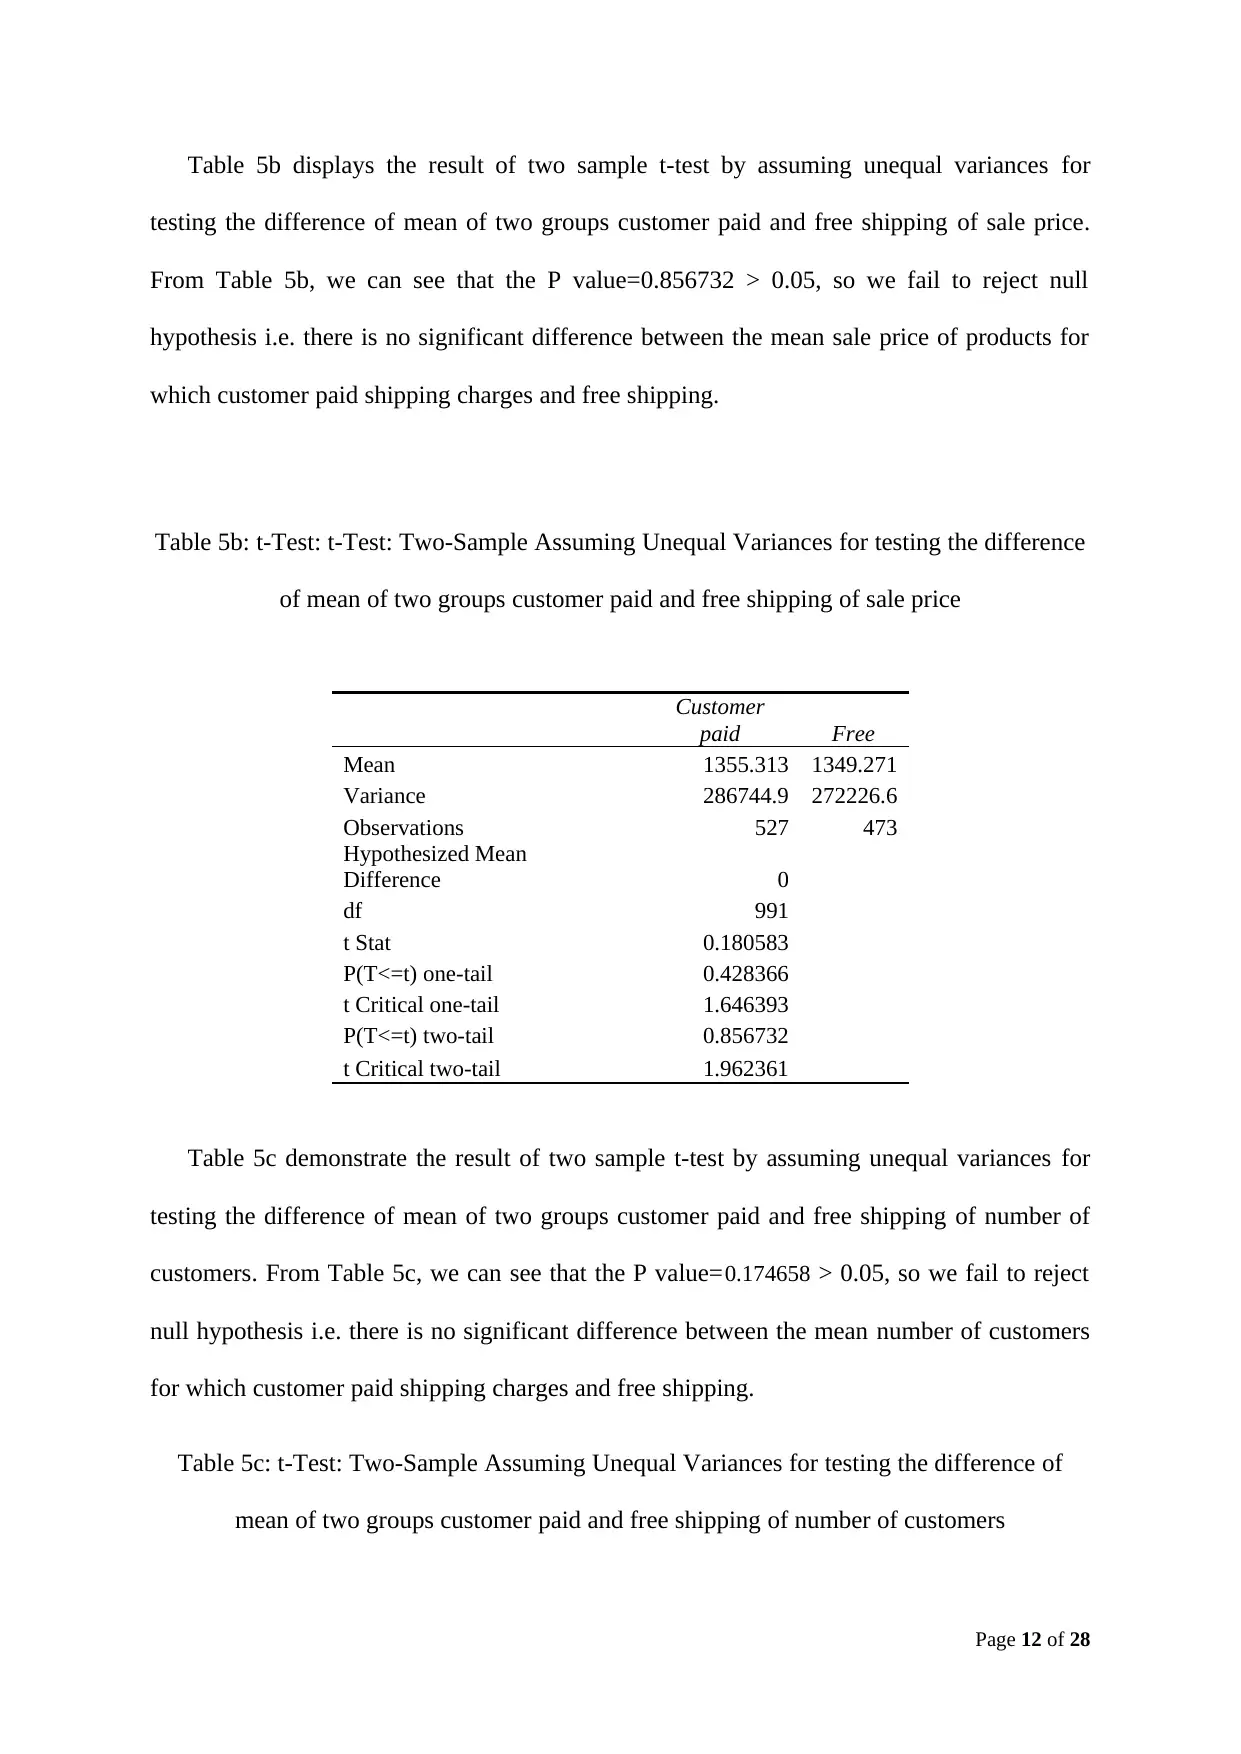
Table 5b displays the result of two sample t-test by assuming unequal variances for
testing the difference of mean of two groups customer paid and free shipping of sale price.
From Table 5b, we can see that the P value=0.856732 > 0.05, so we fail to reject null
hypothesis i.e. there is no significant difference between the mean sale price of products for
which customer paid shipping charges and free shipping.
Table 5b: t-Test: t-Test: Two-Sample Assuming Unequal Variances for testing the difference
of mean of two groups customer paid and free shipping of sale price
Customer
paid Free
Mean 1355.313 1349.271
Variance 286744.9 272226.6
Observations 527 473
Hypothesized Mean
Difference 0
df 991
t Stat 0.180583
P(T<=t) one-tail 0.428366
t Critical one-tail 1.646393
P(T<=t) two-tail 0.856732
t Critical two-tail 1.962361
Table 5c demonstrate the result of two sample t-test by assuming unequal variances for
testing the difference of mean of two groups customer paid and free shipping of number of
customers. From Table 5c, we can see that the P value=0.174658 > 0.05, so we fail to reject
null hypothesis i.e. there is no significant difference between the mean number of customers
for which customer paid shipping charges and free shipping.
Table 5c: t-Test: Two-Sample Assuming Unequal Variances for testing the difference of
mean of two groups customer paid and free shipping of number of customers
Page 12 of 28
⊘ This is a preview!⊘
Do you want full access?
Subscribe today to unlock all pages.
Trusted by 1+ million students worldwide
1 out of 27
Related Documents


Your All-in-One AI-Powered Toolkit for Academic Success.
+13062052269
info@desklib.com
Available 24*7 on WhatsApp / Email
![[object Object]](/_next/static/media/star-bottom.7253800d.svg)
Unlock your academic potential
Copyright © 2020–2026 A2Z Services. All Rights Reserved. Developed and managed by ZUCOL.